
Process Capability Analysis Using Interval Type-2 Fuzzy Sets
- DOI
- 10.2991/ijcis.2017.10.1.48How to use a DOI?
- Keywords
- process capability; fuzzy quality; interval type-2 fuzzy sets; specification limits
- Abstract
In some cases, the specification limits of a quality characteristic should be defined under uncertain information. In the literature, process capability analyses have been handled by using type-1 fuzzy sets under fuzziness up to now. In this paper, we develop the concept of type-2 fuzzy quality and use it in the calculation of process capability. Lower and upper specification limits are considered as type-2 fuzzy sets. We define the addition and subtraction operations for introducing interval type-2 fuzzy process capability indices. We can calculate the nonconforming percentage of the production using the developed equations. We present some numerical examples to show the applicability of the proposed equations.
- Copyright
- © 2017, the Authors. Published by Atlantis Press.
- Open Access
- This is an open access article under the CC BY-NC license (http://creativecommons.org/licences/by-nc/4.0/).
1. Introduction
Process capability can be defined as the ability of a process to meet customer expectations which are expressed in terms of specification limits (SLs). Process capability analysis measures a process’s ability to meet SLs. The process capability analysis (PCA) is used to define the relationship between SLs and the considered process’ ability to meet these SLs. The process capability index (PCI) is used for establishing this relationship as an index [1]. Through these capability indices, PCA compares the output of a process with the specification limits.
Process capability analysis helps us to calculate the nonconforming percentage of the production and thus we try to reduce this percentage by obtaining a smaller variation for the considered characteristic of the process. At the end of this effort, our production costs decrease and more economical production is realized.
In contrast to conventional analysis, SLs may not be precise numbers and they are expressed in linguistic terms or fuzzy sets or fuzzy numbers. The traditional PCIs are not suitable under these circumstances. In the fuzzy literature, specification limits and PCIs have been analyzed using type-1 triangular and trapezoidal fuzzy numbers. In recent years, some papers which have concentrated on different areas of PCIs using the fuzzy set theory have been published. They are summarized in Section 3.
In type-1 fuzzy sets, each element has a degree of membership which is described with a membership function valued in the interval [0,1] [2]. The concept of a type-2 fuzzy set was introduced by Zadeh [3] as an extension of the concept of an ordinary fuzzy set called a type-1 fuzzy set. Such sets are fuzzy sets whose membership grades themselves are type-1 fuzzy sets; they are very useful in circumstances where it is difficult to determine an exact membership function for a fuzzy set. An interval type-2 fuzzy set is a special case of a generalized type-2 fuzzy set. Since generalized type-2 fuzzy sets require complex and immense computational burdensome operations, the wide spread application of generalized type-2 fuzzy systems has not occurred. Interval type-2 fuzzy sets are the most commonly used type-2 fuzzy sets because of their simplicity and reduced computational effort with respect to generalized type-2 fuzzy sets.
Process capability analysis requires many parameters such as upper and lower specification limits, mean and variance of the distribution. Under fuzziness, definition of a correct membership function for each of these parameters is extremely hard. Realizing this by using type-1 fuzzy sets and finding the correct membership function is very difficult. Interval Type-2 fuzzy sets provide flexibility in defining these membership functions by assigning a membership interval for any point on x-axis. This can be explained as follows: In type-1 fuzzy sets, the representation of fuzziness is made using membership degrees which are precise real numbers whereas type-2 fuzzy sets have membership degrees that are themselves fuzzy. Ordinary fuzzy sets are based on precision even they are called fuzzy. This precision is fuzzified through type-2 fuzzy sets. For instance, an ordinary fuzzy USL can be defined by (x,μ)=(99.5,0.75) or as a triangular fuzzy number (98,100,102). Here, the membership degree of 99.5 is 0.75, which is a precise number in both fuzzy sets whereas it is very hard to determine this crisp number. Definition of a membership function should be based on a more flexible way as it is aimed by Type-2 fuzzy sets. The fuzzy USL, (98,100,102), can be flexibly defined by Type-2 fuzzy sets as ((98,100,102;1) (99,100,101;0.8)). In this case, the membership of USL = 99.5 is between [0.4, 0.75]. Thus, the expert is not forced to give a single membership value.
To the best of our knowledge, the process capability analysis has not been handled by using type-2 fuzzy sets in the literature up to now. In this paper, type-2 fuzzy quality concept is developed based on type-2 fuzzy specification limits and then process capability indices are produced using the extended arithmetic operations. Using the proposed equations based on type-2 fuzzy sets, process capability indices and the nonconforming percentage of a production can be easily calculated.
2. Conventional PCA and PCIs: A Brief Introduction
Process capability can be broadly defined as the ability of a process to meet customer expectations which are defined as specification limits (SLs). The measure of process capability summarizes some aspects of a process’s ability to meet SLs. A process is said to be capable if with high the real valued quality characteristic of the produced items lies between a lower and upper specification limits [4].
The first process capability index in the literature is Cp and called precision index [5]. It is the ratio of specification width (USL – LSL) divided by the process spread (6σ). It never considers any process shift as presented in Figure1 and it is calculated by using Eq. (1). Cp simply measures the spread of the specifications relative to the six-sigma spread in the process [4].
Cp measures the dispersion of the considered process and does not examine if the process is centered between SLs. It does not give any information about the actual process performance. To remove this problem, Kane [5] introduced the Cpk index. The Cpk index shows how a process is centered between SLs [6].
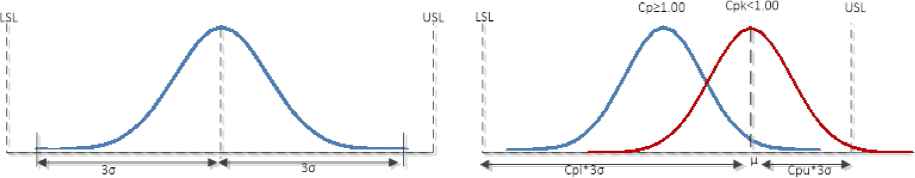
Cp and Cpk capability indices
Since Cp and Cpk indices do not take into account the cost of failing to meet customer’s requirements, another index Cpm given in Eq. (3) has been proposed [7].
3. Literature Review: Process Capability Indices under Fuzziness
SLs may not be precise numbers and they may be expressed in linguistic terms, fuzzy sets or fuzzy numbers. Using the traditional PCIs is not suitable under these circumstances. In the literature there are many works developing PCIs under fuzziness. We divide the publications on fuzzy PC into two parts. The first part involves the publications using fuzzy numbers for the parameters of process capability analysis. The second part involves the publications using fuzzy quality which the specification limits do not necessarily need to be fuzzy numbers but fuzzy sets.
In the following we summarize the literature for the first part. In this part PCIs are generally handled using triangular and trapezoidal fuzzy numbers. Lee et al. [8] presented a model for designing process tolerances to maximize the process capability index. The authors determine the lower and upper bounds of the process capability index via a fuzzy membership function and propose a fuzzy approach to maximize the process capability index of each operation. Lee [9] focus on the construction of the membership function of the fuzzy process capability index and propose a model for cases in which the observations are obtained as fuzzy numbers. Gao and Huang [10] propose a nonlinear optimal process tolerance allocation approach to optimize process tolerances based on manufacturing capability indices. When compared with the existing methods the results reveal that the proposed model is quite stable and is able to provide improvements in acceptable process probability. Chen et al. [11] integrate fuzzy inference with process capability index in the bigger-the-best type quality characteristics assessments. The authors use a brief score concept to characterize the grade of the process capability and develop an evaluation procedure to use the method efficiently. Chen et al. [12] develop a fuzzy inference system for supplier selection based on an estimated capability index of Cpm calculated from sampled data. The authors use triangular and trapezoid membership functions to represent input and output which are obtained by linguistic variables. Parchami et al. [13] introduce new process capability indices as triangular fuzzy numbers, where the specification limits are also defined as triangular fuzzy numbers. The authors also propose a methodology for the comparison of fuzzy processes and apply the methodology to two examples. Parchami et al. [14] after defining the specification limits as fuzzy numbers, obtain a (1−α)100% fuzzy confidence interval for fuzzy process capability indices and present interpretations for the fuzzy confidence interval. Tsai and Chen [1] extend the application of the process capability index Cp to a fuzzy environment and propose a methodology for testing the Cp of fuzzy numbers based on α-cuts. The authors formulate the membership functions of
Chen and Chen [16] propose a fuzzy inference approach that uses maximum-minimum product composition to operate fuzzy if-then rules to evaluate the multi-process capability based on distance values of a confidence box. Hsu and Shu [17] propose a method for combining the vector of fuzzy numbers to produce the membership function of fuzzy estimator of Taguchi index. The authors also propose critical value and fuzzy p-value, to assess the manufacturing process based on Cpm. Kaya and Kahraman [18] apply the fuzzy process capability analyses in cases where the specifications limits are obtained as triangular fuzzy numbers and apply the proposed approach to teaching processes for some courses in a faculty.
Kaya and Kahraman [19] analyze the risk assessment of air pollution in Istanbul using fuzzy process capability indices. In the application, the levels of the air pollutants nine different stations in Istanbul as input and in cases where a correlation is observed, robust process capability indices are used to obtain more sensitive results. Kahraman and Kaya [20] use process capability indices to risk assessment of drought effects utilizing triangular or trapezoidal fuzzy numbers for the specification limits and mean. For risk assessment process accuracy index is used to measure the degree of the process centering and give alerts when the process mean departures from the target value. Kaya and Kahraman [21] evaluate fuzzy process capability indices in six-sigma approach and construct the membership functions of PCIs based on the six-sigma approach and apply the methodology for air pollution. Wu and Liao [22] propose using an extended version of Buckley’s approach to develop a realistic approach for assessing process yield. The authors propose the membership function of fuzzy estimator Spk index and suggest two criteria for fuzzy hypothesis testing, critical value and fuzzy p-value to assess process yield based on Spk.
Kaya and Kahraman [23] modify the traditional process accuracy index to obtain a new decision making tool where specification limits and process mean can be defined as triangular or trapezoidal fuzzy numbers. Kaya and Kahraman [24] propose robust PCIs for a piston manufacturing company by incorporation the fuzzy set theory in order to increase flexibility and sensitivity by defining specification limits and standard deviation as fuzzy numbers. Kaya and Kahraman [25] first use fuzzy normal distribution with crisp specification limits to calculate the fuzzy percentages of conforming and nonconforming items by taking into account fuzzy process mean and fuzzy variance. The authors than propose fuzzy formulation of the indices Cp and Cpk in cases where specification limits are either triangular or trapezoidal fuzzy numbers. Liao and Wu [26] investigate the situation of uncertain or imprecise product quality measurements. The authors use triangular fuzzy numbers for estimating the CPP index and develop a decision testing rule and procedure to evaluate process performance based on critical values and fuzzy p-values based on the δ-cuts of the fuzzy estimators.
Kaya and Kahraman [27] develop fuzzy formulations of the most used PCIs with asymmetric tolerances, using fuzzy extension principle. Abdolshah et al. [28], propose loss based process capability index (Cpmk) for fuzzy numbers and compare the results with current fuzzy indices. Kaya and Kahraman [29] proposed converting linguistic definition of the quality characteristic measurements to fuzzy numbers. Based on these measurements and fuzzy specification limits (SLs) fuzzy PCIs are produced. Besides fuzzy control charts are derived for fuzzy measurements of the related quality characteristic.
Kaya and Baracli [30] propose fuzzy process incapability index asymmetric tolerances by using fuzzy set theory to obtain a deep and flexible analysis. The authors use fuzzy extension principle to obtain fuzzy process mean µ and fuzzy variance σ2, the values are later used together with fuzzy specification limits (SLs) and target value (T). Yen [31] propose using triangular fuzzy numbers for Cpl and Cpu and also the triangular fuzzy numbers for critical values are derived to execute the fuzzy hypothesis testing for these parameters. Shu and Wu [32] propose a constructive methodology for obtaining the fuzzy estimate of loss based capability index based on ‘resolution identity’ in fuzzy sets theory. The proposed model has four decision rules to judge the process condition by simultaneously introducing randomness and fuzziness. Khodaygan and Movahhedy [33] describe sample observations of manufactured variables are as fuzzy numbers and propose a method, which can estimate the ability of the manufacturing process in satisfying the assembly quality in the mechanical assemblies with asymmetric tolerances, which have non-normal distributions.
Moradi and Gildeh [34] propose a graphical approach for monitoring whether the process is capable or not by using the process capability plots for two families of the one-sided PCIs based on fuzzy data.
Senvar and Kahraman [35] examine the percentile based basic PCIs for non-normal data and propose fuzzy formulations for them using Clements’ method. The authors also compared the proposed method with the data generated from Weibull. Basu et al. [36] investigate the process parameters of soap manufacturing industries. The process capability is determined using Fuzzy Inference System and the data has been collected in linguistic form to derive its process capability. Wu and Liao [22] integrate fuzzy numbers to describe the quality characteristic measurements to construct the fuzzy estimation for Spk using a nonlinear programming approach.
In the following, we summarize the literature for the second part which involves the publications using fuzzy quality concept. For the first time, Yongting [37] defines the fuzzy quality by substituting the indicator function I{x|x∈[LSL,USL]} with the membership function of the fuzzy set
The given works above are all based on type-1 fuzzy sets, which force the experts to use a single membership value for every X. We need better definitions for the membership functions which will provide flexible representation of the capability indices under uncertainty. Type-2 fuzzy sets present this flexibility in defining three dimensional membership functions. To the best knowledge of the authors, there has not yet been a study on type-2 fuzzy process capability analysis.
Ordinary fuzzy sets are composed of singletons which mean a crisp membership degree for any element in the set. Type-2 fuzzy sets let a triangular, trapezoidal, or Gaussian membership functions for the elements in the set. Even they require many parameters to be defined, causing a degree of complexity; they constitute a better definition of fuzziness by handling imprecision and vagueness in an enhanced way.
4. Interval Type-2 Fuzzy Sets
Type-2 fuzzy sets are used for modeling uncertainty and imprecision by defining a more flexible membership function. Type-1 fuzzy sets force decision makers to define an exact membership function. Type-2 fuzzy sets are the fuzzy sets whose membership functions are fuzzy [3]. Some definitions of type-2 fuzzy sets are given in the following [45]:
If all
The upper membership function and the lower membership function of an interval type-2 fuzzy set are type-1 membership functions, respectively. A trapezoidal interval type-2 fuzzy set is illustrated in Figure 2.
Trapezoidal interval type-2 fuzzy set
A trapezoidal interval type-2 fuzzy set is represented as
The addition operation between the trapezoidal interval type-2 fuzzy sets
The subtraction operation between the trapezoidal interval type-2 fuzzy sets
5. Fuzzy Quality
In the following, Yongting’s fuzzy quality concept will be handled by type-2 fuzzy sets. We define lower and upper specification limits as type-2 fuzzy sets and then the intersection of these limits constitute Yongting’s fuzzy quality.
5.1. Interval type-2 fuzzy specification limits
In the following we first define interval type-2 fuzzy upper specification limit. For the intervals (−∞, l3] and (−∞, u3] we have two fixed functions whose heights are equal to HL1 and HU1, respectively. For the intervals [l3, l4] and [u3, u4] we have decreasing functions as it is shown in Figure 3.
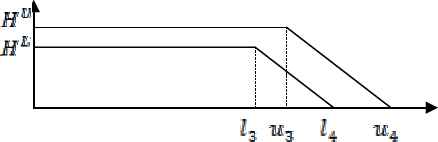
Type-2 Fuzzy Upper Specification Limit
The interval type-2 fuzzy upper specification limit defined in Figure 3 can be expressed as in Eq. (9).
Interval type-2 fuzzy lower specification limit is defined as follows. For the intervals [l2, ∞) and [u2, ∞) we have two fixed functions whose heights are equal to HL2 and HU2, respectively. For the intervals [l1, l2] and [u1, u2], we have increasing functions as it is shown in Figure 4.

Type-2 Fuzzy Lower Specification Limit
The interval type-2 fuzzy lower specification limit defined in Figure 4 can be expressed as in Eq. (10).
5.2. Definition of fuzzy quality
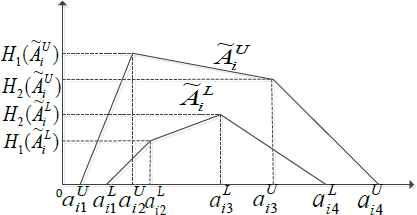
Interval type-2 fuzzy quality can be obtained by the intersection of interval type-2 fuzzy upper and lower specification limits as it is expressed in Eq. (11). One can see a similar relationship in Parchami and Mashinchi’s [40] on type-1 fuzzy sets. Interval type-2 fuzzy quality is illustrated as in Figure 5 in which u1 ≤ l1 ≤ u2 ≤ l2 ≤ 13 ≤ u3 ≤ l4 ≤ u4. We also assume that HL1 = HL2 = HL and HU1 = HU2 = HU. There are two linear trapezoids to represent the type-2 fuzzy quality: a lower trapezoid and an upper trapezoid.
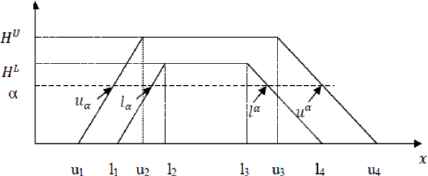
Interval type-2 fuzzy quality function
Here
6. Process Capability Based on Fuzzy Quality
For the development of interval type-2 process capability indices, we need subtraction and addition operations for interval type-2 fuzzy specification limits.
Definition 1.
The distance and summation of interval type-2 fuzzy specification limits
Remark 1
The introduced distance in Definition 1 is an extension of the ordinary difference on R. That is because of when the fuzzy specification limits reduce to crisp numbers LSL and USL, or equivalently the type-2 fuzzy quality function
6.1. Distance and addition for Linear type-2 fuzzy SLs
Under considering a linear form for type-2 fuzzy specification limits
Therefore, the introduced distance in Definition 1 can by simplified for linear type-2 fuzzy specification limits as follows
Meanwhile, under considering a linear form for the type-2 fuzzy quality
6.2. Interval type-2 fuzzy process capability indices
A process with fuzzy type-2 upper specification limit
Note that C[p] is useful when
Remark 2
When fuzzy specification limits
Remark 3
Nonconforming percentage (NP) of the production can be calculated based on Zadeh [47]’s probabilistic definition by
7. A Numerical Example
A real world numerical example is given in this section to show the performance of the proposed approach and the robustness of the method will be observed with a comparative analysis.
To the best of our knowledge, this is the first paper on capability indices in domain of interval-valued type-2 fuzzy sets. Therefore, the proposed method is compared with interval-valued crisp quality and type-1 fuzzy quality.
7.1. Illustrative example
A firm producing gears for automobiles wants to calculate the process capability of the produced inside diameters (R) of the gears shown in Figure 6. The mean and standard deviation values of this dimension are 10 mm and 0.2 mm, respectively. Considering the special shape and matching situation of the gears, the specification limits for this dimension are not defined by sharp values as they are in the classical case which is given by [9.2, 10.4]. The engineering department wants to define the specification limits by type-2 fuzzy sets. The type-2 fuzzy quality for this dimension is determined as
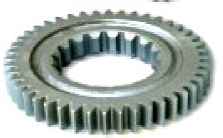
The interested dimension of the gear

Position of the process distribution on the type-2 fuzzy quality
Here we have μ = 10; σ = 0.2; T = 9.8. We first calculate the difference (subtraction) and sum of type-2 fuzzy specification limits by Eqs. (20–21):
Now we can calculate the interval-valued capability indices C[p], C[pk], and C[pm] as follows:
Since
Till now, the introduced target value is not considered in capability calculation. From the obtained results, it is clearly seen that all the interval type-2 fuzzy capability indices are larger than 1.33. This means that the process for the considered dimension is capable. The distribution of the considered dimension is closer to upper specification limit rather than the lower one. As the upper specification limit moves to the left side with respect to the fixed process distribution, the interval type-2 fuzzy process capability indices C[p], C[pm], and C[pk] get smaller. The lower bounds in the calculated intervals show the least possible values of these indices while the upper bounds of the intervals show the largest possible values.
Also considering the normality assumption for the quality characteristic, the interval-valued probability of “the product is qualified” can be calculated as follows
The meaning of the obtained nonconforming percentage is that our production process may produce at least 0.1% and at most 5.16% nonconforming products.
7.2. Comparison with existing methods
As mentioned earlier, this is the first scientific manuscript which discusses on PCIs using interval-valued type-2 fuzzy sets. Therefore, the comparative analysis is presented for classical/crisp quality and type-1 fuzzy quality, respectively in the following.
Comparative analysis based on crisp quality: The above problem will be examined using crisp sets and the results will be compared with the results of the proposed method. In this case the LSL is 9.2 and USL is 10.4. Then, using the classical formulas the following results are obtained.
Since the fuzziness does not use sharp boundaries, this process becomes capable with the fuzzy approach while the crisp approach informs that it is incapable. This result also shows the importance of the fuzzy information in case of uncertain data. It is clear that process indicated by the crisp approach as incapable might be capable when the fuzzy approach is used. Considering crisp quality, the nonconforming percentage of the production can be calculated as follows
Comparative analysis based on type-1 fuzzy quality: Now, let us to consider the above problem with two ordinary fuzzy sets
Now, the real-valued PCIs can be computed on the basis of Eqs. (20–22) [48]. In the following, we compare these results with the results of the proposed method.
The real-valued probability of “the product is qualified” can be calculated as follows under the normality assumption for the quality characteristic based on Zadeh [47]’s probabilistic definition:
8. Conclusions
Regarding to the importance on the quality of the products, it is more appropriate to change the traditional crisp interval [LSL,USL] into a trapezoidal type-2 fuzzy interval. It is equivalent to exactly determining the specification limits by two type-2 fuzzy sets rather than considering a crisp interval [LSL,USL] for any quality characteristic. When the specification limits are considered as type-2 fuzzy sets, the traditional process capability indices should be modified to use them for measuring the capability of a process. In this paper, interval type-2 fuzzy capability indices, namely,
References
Cite this article
TY  - JOUR
AU  - Abbas Parchami
AU  - Sezi Çevik Onar
AU  - Başar Öztayşi
AU  - Cengiz Kahraman
PY  - 2017
DA  - 2017/02/20
TI  - Process Capability Analysis Using Interval Type-2 Fuzzy Sets
JO  - International Journal of Computational Intelligence Systems
SP  - 721
EP  - 733
VL  - 10
IS  - 1
SN  - 1875-6883
UR  - https://doi.org/10.2991/ijcis.2017.10.1.48
DO  - 10.2991/ijcis.2017.10.1.48
ID  - Parchami2017
ER  -