
Fuzzy-Based Methodology for Integrated Infrastructure Asset Management
- DOI
- 10.2991/ijcis.2017.10.1.50How to use a DOI?
- Keywords
- Infrastructure Asset Management; Infrastructure Condition Assessment; Fuzzy expert system; Fuzzy/Monte Carlo Simulation; Analytical Hierarchical Process; Genetic Algorithms
- Abstract
Most municipal agencies are facing challenges regarding the deterioration of infrastructures due to the lack of available funds and available data. There is a need to perform infrastructure asset management for infrastructure assets in an integrated manner. This research proposes a decision making plan to help the agencies to perform integrated infrastructure asset management. This research presents a methodology that helps infrastructure managers conduct their short and long terms management plans. The proposed methodology is capable to assess the condition of three infrastructure asset types including, Water networks, Sewer networks, and Road networks. Also, it is capable to assess the risk and perform the life cycle cost analysis for the integrated infrastructure assets. Factors that affect the deterioration rates of the three considered infrastructure assets types have been concluded from analyzing the literature and from gathering the expert opinions through a questionnaire sent to them. Pair-wise technique has been used to produce weight of effect of each factor at the deterioration rate. Then, a deterioration model is developed using hierarchical fuzzy expert system (HFES) technique. Another risk model is developed for assets’ failure in order to evaluate the risk associated with each segment in the network for the three infrastructure types. Fuzzy Monte Carlo Simulation (FMCS) is used to model the probability of failure (POF) and developing the risk index distribution for each type of asset. In an effort to facilitate decision-making during the rehabilitation planning, multi-objective optimization is performed, considering four objective functions; overall risk index, infrastructure’s condition, assets’ level of service and life cycle cost. A case study is considered in order to demonstrate the features of the proposed methodology.
- Copyright
- © 2017, the Authors. Published by Atlantis Press.
- Open Access
- This is an open access article under the CC BY-NC license (http://creativecommons.org/licences/by-nc/4.0/).
1. Introduction
Infrastructure asset management is the integrated, multidisciplinary set of strategies in sustaining public infrastructure assets such as water treatment facilities, sewer lines, roads, utility grids, bridges, and railways. Asset managers are faced with many challenges regarding when and how to inspect, maintain, repair and replace a diverse set of existing infrastructure assets cost effectively. Infrastructure systems and their constituent components are often considered as a network of interdependent, complex, and adaptive systems, where “what happens to one infrastructure can directly and indirectly affect other infrastructures,” within large geographic regions. However, in practice, infrastructure systems and their components are typically managed separately, and the data are stored and managed in isolated and often incompatible, data sources. Implementing successful management strategies would largely depend on the ability to address infrastructure interdependencies by integrating the procedures and process of rehabilitation management decision for those infrastructure assets.
The development and deployment of integrated infrastructure management systems is important to maintain infrastructure assets. Integrated infrastructure management would facilitate information flow across various disciplines and activities, which in return would improve the availability, reliability, and consistency of infrastructure information, resulting in timely and more efficient decisions. The need to adopt an integrated approach to infrastructure management is widely recognized in industry and academia1–4. Throughout the last two decades, municipalities have made significant investments in implementing software tools that focus on infrastructure management processes5–6. The majority of the software tools were developed to function as stand-alone systems, and many have limited or no capability for sharing or exchanging information with other tools. Halfawy et al.6 reviewed commercial asset management systems in Canada in an effort to provide asset managers with an objective review of existing systems and technologies, and to identify a number of considerations that need to be addressed in the process of selecting an asset management system. It also highlights areas where further research and development are needed in order to extend the scope and capabilities of existing systems.
The InfraGuide report suggested a systematic integration approach for the renewal of municipal road, sewer and water systems1. This approach consists of five tasks: Inventory, Investigation, Condition Assessment, Performance Evaluation, and Renewal Plan. Finally, the approach concludes with task five; developing a sound renewal plan, which include economic analysis, coordination with growth needs regulations, and risk management. The report set a high-level framework for municipalities to adopt which will standardize procedures and integration of asset management initiatives. It is recommended for municipalities and government officials to join forces to enforce and standardize these practices among all municipalities.
The condition assessment for different infrastructure has been conducted in several researches. For water main networks condition assessment, Geem7 developed decision support system for pipe condition using back propagation neural networks. Also, Al-Barqawi and Zayed8 used both artificial neural networks and analytic hierarchical process (AHP) to assess the condition of water types of water mains. Kleiner and Rajani9 proposed factors that affect the structure deterioration of water pipes and its failure. Devera10 studied several physical factors that can contribute to pipe failure. Also, several studies investigated the condition assessment for sewer main pipes. Najafi and Kulandaivel11 considered seven physical and environment al factors in their developed model for predicting the condition of sewer pipes. Ariaratnam et al.12 presented a methodology for predicting the likelihood that a particular infrastructure system is in a deficient state, using logistic regression models, a special case of linear regression. Chughtai and Zayed13 presented a method for assessing a sewer’s structural condition by utilizing general pipeline inventory data. Based on historic condition assessment data, condition prediction models for sewers are developed using multiple regression technique. Khan et al.14 presents a study which uses artificial neural networks to investigate the importance and influence of certain characteristics of sewer pipes upon their structural performance, expressed in terms of condition rating. Also, some studies discussed the condition of road networks such as Obaidat and Al-Kheder15 and Cunningham et al.16.
For the water main risk assessment, Ezell et al.17 introduced Probabilistic Infrastructure Risk Analysis model (IRAM) for small community water supply and treatment systems. Kleiner et al.18 developed a methodology to evaluate pipeline failure risk using the fuzzy logic technique. Rajani et al.19 used a fuzzy synthetic evaluation technique to translate observations from visual inspection and non-destructive tests into water main condition ratings. For the sewer main risk assessment, Hahn20 developed a knowledge-based expert system to predict the criticality of sewer pipelines. The expert system considers information about the environment and the state of a sewer line through an extensive set of relationships that describe failure impact mechanisms using Bayesian belief network. Yan and Vairavamoorthy21 proposed a methodology to assess pipeline condition using Multi-Criteria Decision Making (MCDM) techniques which combine the available pipe condition indicators into one single indicator. Both fuzzy set theory and its arithmetic corollaries are incorporated in the Composite Programming to form Fuzzy Composite Programming (FCP). Also, for road networks Paine22 demonstrated that an alternative approach could be developed for the management of pavements through the use of risk management. The system was an adoption of a risk analysis that had been used for slopes but with the necessary changes to cover the wide range of risks associated with road networks. The model developed by Reigle & Zaniewski23 is probabilistic and derives flexible pavement designs, generates preservation strategies, and evaluates the life-cycle costs of each alternative. Risk analysis is incorporated into the LCCA model so that the inherent uncertainty of each input parameter is considered. Cunningham et al.16 Proposed a framework to manage the Risk of aging pavement infrastructure in New Brunswick by identifying the appropriate timing for the most effective and economical treatment based on long term, least life cycle costs to achieve optimal performance within annual budgets.
This research will go through several steps to reach the proposed decision making methodology for operating, maintaining and rehabilitating the infrastructure in integrated manner. Firstly, a fuzzy based methodology is conducted to make a condition assessment of each infrastructure asset (water networks, sewer networks and roads networks). Then, a risk model is developed for assets’ failure in order to evaluate the risk associated with each segment in the network for the three infrastructure types using Fuzzy Monte Carlo Simulation (FMCS) to model the probability of failure (POF) and Analytical Hierarchy Process (AHP) to model the consequence of failure (COF). At the end, multi-objective optimization is performed using Genetic Algorithms (GA) to facilitate the decision making during the rehabilitation planning phase. A case study is presented in order to demonstrate the feature of the proposed methodology.
2. Methodology
The methodology to develop the integrated infrastructure management system methodology consists of six steps are: i) data collection, ii) condition assessment, iii) risk estimate, iv) performance estimate, v) life cycle cost analysis and vi) multi objective optimization. Those steps have inspired from the InfraGuide report1 with some interference and enhancement like the idea of risk assessment and using the optimization tools to choose the renewal plan. Table 1 lists the models of the proposed integrated infrastructure system methodology. The data collection phase passed through the following steps to collect the data required for the proposed models: i) Select a case study and ii) Conduct interview workshops/ questionnaire.
| Model | Tool | Output |
|---|---|---|
| Data Collection | Workshops / Questionnaire | Condition assessment and risk factors |
| Condition assessment | Hierarchical Fuzzy Expert System | Segments’ Condition |
| Risk assessment | Analytical Hierarchy Process | Consequence of failure |
| Level of service | Fuzzy Monte Carlo Simulation | Probability of Failure |
| Life Cycle Cost | Analytical Hierarchy Process | Performance Index |
| Probability of Failure | Deterministic method | Life cycle cost for each plan |
Utilized Tools in Proposed System Models
These phases of data collection were conducted over the various stages of the research. The selected case study considers the city Zahraa El-Maadi, Cairo, Egypt. The workshop interviews and questionnaires were conducted with municipal experts and consultants. These workshops and questionnaires were designed to collect the opinions of practitioners regarding the main factors that affect the condition, risk, performance indicators and business processes related to infrastructure management current practice. The using of Fuzzy- based methodology was very effective to deal with the uncertainties of data gathered from the expertise.
2.1. Data collection
The condition assessment for each infrastructure network depends on several factors. Several research efforts investigated many of those factors. This research reviews some of those researches to conduct the most important factors the was frequent used at those researches. Most common and frequently factors causes of affected the deterioration rate of water main networks, sewer main networks and road networks based on the previous research are listed in Table 2 to 4. Depends on Considering the most frequent factors in literature and a survey made for several of the experts at infrastructure field, the factors used at the condition assessment model has been investigated.
| Factors | Ref. 15 | Ref. 34 | Ref. 35 | Ref. 36 | Ref. 16 | Frequency |
|---|---|---|---|---|---|---|
| Age | √ | √ | √ | √ | 4 | |
| Traffic | √ | √ | √ | √ | √ | 5 |
| Road Class | √ | √ | √ | 3 | ||
| Land use | √ | 1 | ||||
| Load | √ | 1 | ||||
| Climate | √ | √ | √ | 3 | ||
| Drainage | √ | 1 | ||||
| O&M practices | √ | √ | √ | √ | 4 | |
| Material | √ | 1 |
Road Network Deterioration Rate Factors
| Factors | Ref. 24 | Ref. 7 | Ref. 25 | Ref. 21 | Ref. 8 | Ref. 8 | Ref. 26 | Ref. 27 | Ref. 9 | Ref. 28 | Ref. 10 | Frequency | |
|---|---|---|---|---|---|---|---|---|---|---|---|---|---|
| Physical Factors | Pipe material | √ | √ | √ | √ | √ | √ | √ | √ | √ | √ | √ | 11 |
| Pipe wall thickness | √ | √ | 2 | ||||||||||
| Pipe age | √ | √ | √ | √ | √ | √ | √ | √ | √ | √ | √ | 11 | |
| Pipe vintage | √ | 1 | |||||||||||
| Pipe diameter | √ | √ | √ | √ | √ | √ | √ | √ | √ | √ | √ | 11 | |
| Type of joints | √ | 1 | |||||||||||
| Thrust restraint | √ | 1 | |||||||||||
| Lining and coating | √ | √ | √ | √ | √ | 5 | |||||||
| Dissimilar metals | √ | 1 | |||||||||||
| Pipe installation | √ | √ | 2 | ||||||||||
| Pipe manufacture | √ | √ | 2 | ||||||||||
| Environmental factors | Pipe bedding | √ | √ | √ | √ | √ | 5 | ||||||
| Trench backfill | √ | √ | √ | √ | 4 | ||||||||
| Soil type | √ | √ | √ | √ | √ | √ | √ | √ | √ | √ | 10 | ||
| Groundwater | √ | √ | √ | 3 | |||||||||
| Climate | √ | √ | √ | √ | √ | √ | 6 | ||||||
| Pipe location | √ | √ | 2 | ||||||||||
| Disturbances | √ | 1 | |||||||||||
| electrical currents | √ | √ | √ | √ | 4 | ||||||||
| Seismic activity | √ | 1 | |||||||||||
| Depth | √ | √ | √ | 3 | |||||||||
| Type of traffic/Road | √ | √ | √ | √ | √ | √ | √ | 7 | |||||
| Service area type | √ | 1 | |||||||||||
| Operational Factors | pressure | √ | √ | √ | √ | √ | √ | √ | 7 | ||||
| Leakage | √ | √ | 2 | ||||||||||
| Water quality | √ | √ | 2 | ||||||||||
| Plow velocity | √ | 1 | |||||||||||
| Backflow potential | √ | 1 | |||||||||||
| O&M practices | √ | √ | √ | 3 | |||||||||
| Breakage rate | √ | √ | √ | 3 | |||||||||
| Hydraulic factor | √ | √ | √ | 3 | |||||||||
Water-Main Deterioration Rate Factors
| Cat. | Factors | Ref. 12 | Ref. 29 | Ref. 30 | Ref. 11 | Ref. 31 | Ref. 13 | Ref. 32 | Ref. 33 | Ref. 14 | Frequency |
|---|---|---|---|---|---|---|---|---|---|---|---|
| Physical | Pipe age | √ | √ | √ | √ | √ | √ | √ | √ | √ | 9 |
| pipe shape | √ | 1 | |||||||||
| pipe size | √ | √ | √ | √ | √ | √ | √ | √ | √ | 9 | |
| sewer depth | √ | √ | √ | √ | √ | √ | √ | √ | 8 | ||
| sewer length | √ | √ | √ | √ | √ | 5 | |||||
| sewer material | √ | √ | √ | √ | √ | √ | √ | √ | √ | 9 | |
| sewer slope | √ | √ | √ | √ | √ | √ | 6 | ||||
| sewer type | √ | √ | √ | 3 | |||||||
| joint type and material | √ | √ | 2 | ||||||||
| Sewer Connections | √ | 1 | |||||||||
|
|
|||||||||||
| Environmental | groundwater level | √ | √ | √ | 3 | ||||||
| infiltration/exfiltration | √ | √ | √ | 3 | |||||||
| presence of trees/ Root | √ | √ | 2 | ||||||||
| interference | |||||||||||
| soil/backfill type | √ | √ | √ | √ | √ | 5 | |||||
| traffic and surface | √ | √ | √ | 4 | |||||||
| loadings | √ | √ | √ | √ | 3 | ||||||
| bedding | √ | √ | √ | 2 | |||||||
| Frost Factor | √ | 1 | |||||||||
| Other Utilities | √ | 1 | |||||||||
| sediment level | √ | 1 | |||||||||
| Sewage characteristics | √ | √ | √ | √ | 4 | ||||||
|
|
|||||||||||
| Operational | installation method | √ | 1 | ||||||||
| standard of workmanship | √ | √ | 2 | ||||||||
| Maintenance methods | √ | √ | 2 | ||||||||
Sewer-Main Deterioration Rate Factors
2.2. Condition assessment of infrastructure assets
The first model in the proposed Integrated Infrastructure Management System is dedicated for assessment of the condition for each infrastructure type. Figure 1 illustrates the methodology that is used to determine the condition rate. A hierarchical fuzzy expert system (HFES) is developed to estimate the risk of water main failure. A Mamdani’s fuzzy rules system is used as implication operation in the fuzzy model. The hierarchical fuzzy model consists of three main models (water main example) which correspond to the three main factors: Physical, Environmental and Operational models. The results of these three models are crisp values which are used as inputs to calculate the deterioration rate of asset. Figure 2 depicts the data processing flow in the physical risk model for the water main network. The data processing flow of other factors’ models are identical to the physical factor model with exception of sub-factors, associated membership functions (linguistic variables), and knowledge rules are different. The rules are established depend on the experts’ workshops. These crisp numbers are fed to the overall deterioration model and processed as explained above.
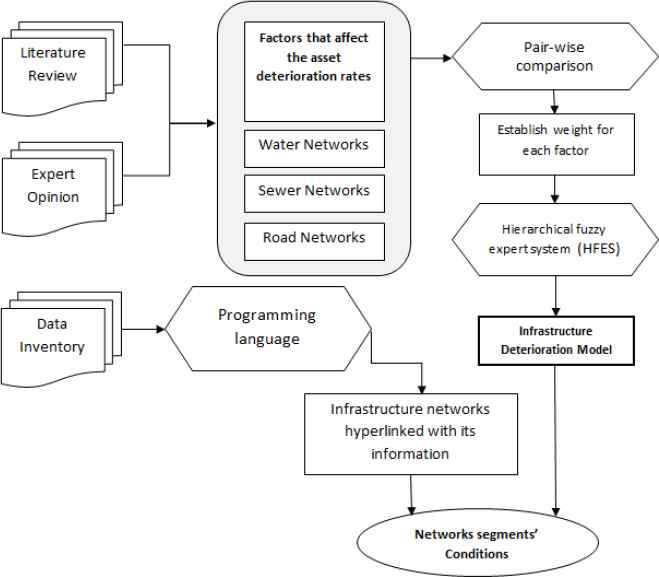
Condition Assessment Methodology
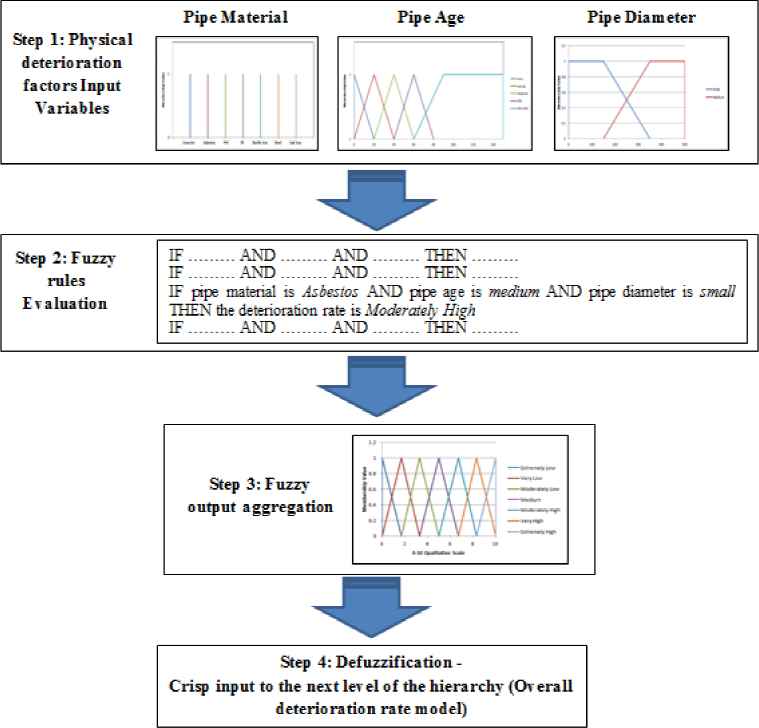
Water Network Physical Deterioration Fuzzy Model
2.3. Risk index model
The Second model in the proposed system is dedicated to develop a risk index for each infrastructure type. Figure 3 shows the methodology used to determine the risk index rate. Using a risk-based approach helps to identify the importance of different assets in supporting the delivery of services (Asset Criticality). It also provides the ability to take into consideration the likelihood of asset failure and the associated consequences in terms of impacts on customers. The Fuzzy-Monte Carlo simulation “FMCS” model is developed to assess the risk index for each infrastructure asset.
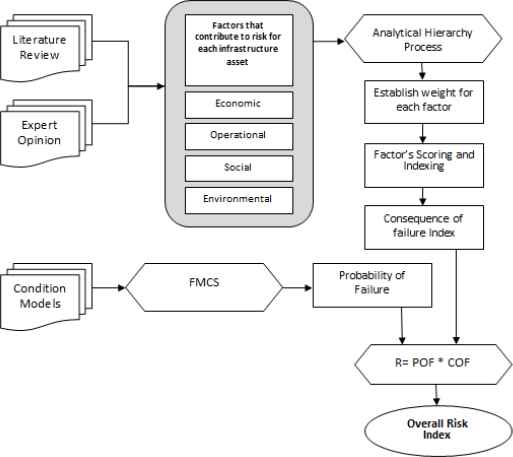
Risk Assessment Methodology
The simulation based approach for risk analysis of a problem is developed using Walls and Smith37 procedure which consists of four steps: (i) identifying the structure of the problem (ii) quantifying uncertainty in different parameters of the model (iii) performing a simulation (iv) analyzing the results and making decision. Monte Carlo simulation is a common simulation approach that is performed in construction management. In Monte Carlo simulation, all the input uncertainties are modeled based on probability theory and random sampling of inputs is performed to find the output results38. However, since the sources of information about various parameters of a project differ, we may have probabilistic uncertainty for some of the input variables and fuzzy uncertainty for others. Therefore, a simulation method is required that is capable of handling both types of fuzzy and probabilistic inputs. Fuzzy Monte Carlo Simulation (FMCS) is proposed as a solution to this problem in this research. FMCS is a generalized form of Monte Carlo simulation that provides the capability of using both fuzzy logic and probability theory for quantifying the input uncertainties of a Monte Carlo simulation model.
2.4. Modeling life cycle cost
The concept of life cycle cost can be applied to the whole project or part of the project. To enable comparison between different alternatives and pick up the most feasible and economic solution they should have a tool to achieve that. Modeling of life cycle cost is a tool used for comparing and analyzing of alternatives as shown in third model39. The deterministic method discounted rate is used to compare all cost in the present value. It assumes all the cost components of the project to be well defined with a single value. It based on the economic analysis of time value of money. To find the total Life Cycle Cost (LCC) of a project, sum the present values of each kind of cost and subtract the present values of any positive cash flows such as a resale value40. Equation 1 is used to calculate present value of the total life cycle cost (LCC)41:
- Cp:
The capital cost;
- Ct:
sum of the Operation cost, Maintenance and repair, Replacement / Rehabilitation and the Salvage value;
- d:
the discounted rate;
- n:
The asset service life.
The deterministic method assumes that all the cost is identified by year and with certainty, where there is no probability in the identified values. Limitation of deterministic method that it doesn’t address: Statistical
Significance, or Variability. Also it is subject to manipulation, and there is a lacks of credibility39.
2.5. Multi-objectives Genetic Algorithms
A final model optimized decision for each lifecycle option of the integrated rehabilitation scenario is achieved through the integration of risk management scoring, condition assessment, performance management (LOS), life cycle cost (LCC) and economic loss of remaining service life. While there are several optimization options available, optimized decision making is computationally intensive.
All optimization problems have several elements in common. They all have: (i) decision variables, the variables that decision makers can choose, either directly or indirectly, which affect the value of the objective function, (ii) objective function, whose value is to be optimized (minimize or maximize) and (iii) constraints, a set of constraints that allow the unknowns to take on certain values but exclude others. Integrated infrastructure management has multiple objective functions. Optimizing integrated infrastructure rehabilitation requires the simultaneous optimization of more than one objective function such as:
- •
Minimize the overall risk
- •
Maximize level of service (LOS)
- •
Maximize the overall assets conditions
- •
Minimize life cycle cost (LCC)
In practice, problems with multiple objectives are reformulated as single-objective problems by either forming a weighted combination of the different objectives or replacing some of the objectives with constraints. Optimization using Genetic Algorithms (GAs) allows searching for decision variables that maximize the objective function while satisfying certain constraints.
The purpose of this module is to equip the asset manager with a consistent methodology for decision-making during the integrated rehabilitation planning cycle. Within a planning cycle, the asset manager must make one of three decisions for each asset in the road right of way: What are the intervention (replacement, rehabilitate, etc.)? When is the best time to do them? Which another Assets to make intervention? Figure 4 summarize the decision making approach using the multi objectives optimization tool. The decision making model has the following variables:
- (i)
The scenarios of intervention to use (7 scenarios)
- (a)
S1: make an action for the road segment only
- (b)
S2: make an action for the water segment only
- (c)
S3: make an action for the sewer segment only
- (d)
S4: make an action for the Road & Water segments
- (e)
S5: make an action for the Road & Sewer segments
- (f)
S6: make an action for the Sewer & Water segments
- (g)
S7: make an action for the Road, Sewer & Water segments
- (a)
- (ii)
The intervention year (t)
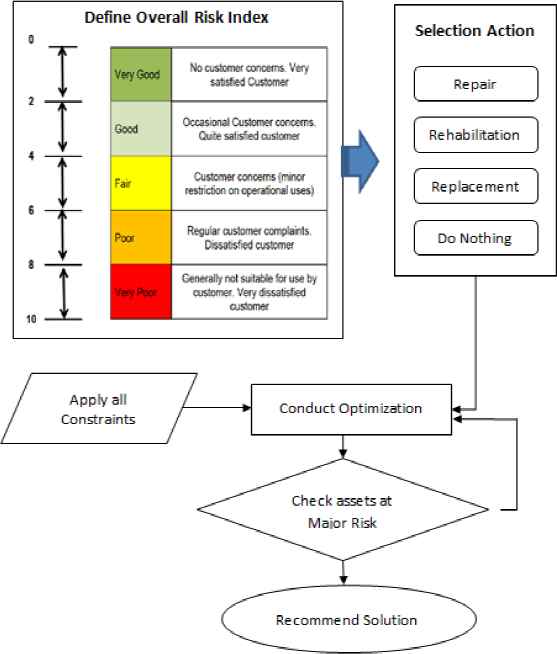
Decision Making Methodology
The decision making model has the following objectives:
- (i)
Minimum Risk
Where;- ∆Risk:
is the change of the risk score for the asset
- Rs:
total number of road network segment
- Ws:
total number of water network segment
- Ss:
total number of sewer network segment
- Ii (road risk):
risk score for road segment
- Ij (water risk):
risk score for water segment
- Ik (sewer risk):
risk score for sewer segment
- (ii)
Maximum Level of Service
Where;- ILOS (Network):
is the overall Level of Service Index for the all networks
- Rs:
total number of road network segment
- Ws:
total number of water network segment
- Ss:
total number of sewer network segment
- Ii (road LOS):
Level of service Index for road segment i
- Ij (water LOS):
Level of service Index for water segment j
- Ik (sewer LOS):
Level of service Index for sewer segment k
- (iii)
Maximum Condition
Where;- C(Network):
is the overall Condition for the all networks
- Rs:
total number of road network segment
- Ws:
total number of water network segment
- Ss:
total number of sewer network segment
- Ci (road):
Condition for road segment i
- Cj (water):
Condition for water segment j
- Ck (sewer):
Condition for sewer segment k
- (iv)
Minimum Life Cycle Cost
Where;- LCC(Network):
is the overall Life Cycle Cost for the all networks
- Rs:
total number of road network segment
- Ws:
total number of water network segment
- Ss:
total number of sewer network segment
- NPVi (road):
Condition for road segment
- NPVj (water):
Condition for water segment
- NPVk (sewer):
Condition for sewer segment
- OC:
operational and maintenance Cost
- DC:
Direct Cost
- IC:
Indirect cost (social and environmental values)
- RV:
Residual value
- Mij:
is the operation and maintenance cost for asset j per year
- Lij:
is the asset segment length
- t:
is the analysis period (Years)
- r:
is the interest rate
- RCj:
is the replacement cost for asset j
- S&Vj:
is the social and environmental costs for asset j
- nj:
estimated useful life for asset j
- Ajt:
estimated Age for asset j at the analysis year t
- RCj:
is the replacement cost for asset j
The optimization constrains established to ensure that annual cost results from the model are within the annual budget determined by the decision makers. Also, constrains ensure that the condition, performance and risk for all infrastructures’ segments are meet the minimum requirements of decision makers. The optimization constrains are the following:
- (i)
Annual budget limitations
- (ii)
Minimum performance limitation
- (iii)
Minimum condition limitation
- (iv)
Maximum risk limitation
The hierarchical fuzzy based methodology used to contain the expert judgment of the deterioration rate models and converting it to manageable numerical formulas to ease the decision making. Also, the Fuzzy Monte Carlo Simulation (FMCS) is presented to merge the expert judgment using the fuzzy expert system with the probabilistic perspective from the Monte Carlo theory for modeling the probability of failure (POF). Finally, a multi-objective optimization genetic algorithms is used to perform a decision making due to the large number, multi-dimensional variations, objectives and constraints.
3. Case Study
In order to demonstrate that the proposed methodology can function effectively in handling the optimization problem, a numerical experiment is conducted based on the networks of Zahraa El-Maady – Cairo, Egypt. Road, water and sewer networks data was provided by Zahraa El-Maady Company. Each network has been divided to number of segments that have same conditions to ease the study of network. Table 5 lists the total length of those networks and number of segments at each network. The condition assessment model relies on attributes relating to the road, water main, sewer main and its surroundings to provide a measure for infrastructure deterioration rate on physical, environmental, and operational considerations. These attributes are used to develop this condition assessment model are stored in the database tables (e.g. road size, diameter, depth, type, etc.). Storing all required attributes in a central data repository facilitate model development and implementation. A condition rating for road, sewers, and water assets was developed using data collected from the case study. The software runs on the fuzzy expert model to determine the condition rate for each segment at the asset’s network. Table 6 gives an example for a segment at the water main network; the attributes, the weights for each attribute and condition rate. The Condition rate results are determined using the Hierarchical fuzzy expert system model. Table 7 depicts the overall network’s condition and its distributions for the road networks, water main and sewer main networks in kilometer.
| Number of segments | Total Length (m) | |
|---|---|---|
| Road Network | 508 | 65,263 |
| Water Network | 363 | 62,392 |
| Sewer Network | 270 | 41,146 |
Selected Network Characteristics
| Insignificant [1–2] | Minor [3–4] | Moderate [5–6] | Major [7–8] | Catastrophic [9–10] | ||
|---|---|---|---|---|---|---|
| Road Segments | No. of segment. Length |
70 5,156 |
243 33,023 |
160 20,427 |
30 5,808 |
5 848 |
| Water Main | No. of segment. Length | 156 25,518 |
67 12,416 |
127 21,588 |
11 2,808 |
2 62 |
| Sewer Main | No. of segment. Length | 3 494 |
30 4,526 |
155 22,713 |
77 12,426 |
5 988 |
Consequence of Failure Results
| Condition | Road Networks | Water Networks | Sewer Networks |
|---|---|---|---|
| Excellent | 265 Km | 14,974 Km | 7,406 Km |
| Very Good | 11,460 Km | 28,076 Km | 16,870 Km |
| Good | 12,245 Km | 10,606 Km | 9,052 Km |
| Fair | 20,402 Km | 8,110 Km | 6,172 Km |
| Poor | 4,877 Km | 623 Km | 1,234 Km |
| Very Poor | 9,623 Km | 0 Km | 411 Km |
| Failed | 6,391 Km | 0 Km | 0 Km |
Summary of the Networks Conditions
The main objective of infrastructure risk model is to develop a network based Risk Model that can be used in day-to-day decision making and capital improvement program prioritization for infrastructure. Identifying which Asset (road, water or sewer) that have the greatest impact on the studying area will help to optimize maintenance activities and to replace and rehabilitate the selected assets at optimum times in a cost-effective manner. The first step is to determine the overall risk rating for the asset’s network is to calculate the consequence of failure (COF) for each segment at this network. The proposed prototype uses the Analytical Hierarchy Process (AHP) to determine the COF. The classifications of asset according to their criticalities are listed in Table 8. Results are summarized based on number of pipe segments and based on length. A small number of segments were considered critical with respect to overall criticality.
| Factor | Attribute | Weight | Result |
|---|---|---|---|
| Physical | 3.01 | ||
| Pipe Material | PVC | 16.66% | |
| Pipe Age | 20 year | 22.05% | |
| Pipe Diameter | 200 mm | 10.29% | |
| Environmental | 7.98 | ||
| Soil Type | Highly deteriorative | 4.40% | |
| Environmental Conditions & Climate | Lightly aggressive | 2.60% | |
| Average Daily Traffic | Very Heavy | 2.00% | |
| Pipe Lining and Coating | Not used | 6.00% | |
| Water Table Level | Seasonally presented | 5.00% | |
| Operational | 7.31 | ||
| Water Pressure | High | 6.20% | |
| O&M Practices | Poor | 13.95% | |
| Breakage Rate | Average | 10.85% | |
| Condition rate | 43 | ||
Condition Assessment Model Results for a Water Main Segment
Calculating the probability of failure for an asset is attributed to a lot of uncertain factors. Those uncertainties are probabilistic at occurring. The effect of uncertainty on the asset’s failure is retrieved from experts in this research. Therefore, the integrated Fuzzy-Monte Carlo Simulation module was developed to deal with those uncertainties. The factors that effect on the asset’s probability of failure (POF) are divided to 2 categories: the first category is the status factors (e.g. Condition, age, material, etc), whereas, second category is the conditional factors-uncertain factors- (e.g. ADT, Climate, Pressure, etc). The model shows that after 100,000 trial of running the Fuzzy/Monte Carlo Simulation model. The mean value for the segment POF is 36.5% with standard deviation 3.96%.
It is noticeable from the sensitivity analysis that the weak effect of the Pressure factor on the POF compared to the other to inputs (ADT and Climate).
The developed LOS index performance measure module provides a structured framework to apply a consistent LOS approach to road, water, and sewer assets. A network map was developed using the data collected from the case study. The proposed prototype visualizes the areas with performance concerns to prioritize O&M and capital construction funding. Each LOS parameter has various variables/attributes in which they are not similar in their effect on customer stratification. After the segments’ analysis for the city networks based on the LOS it is found that most assets within the city were in good to very good level.
This case example considers the intervention for the infrastructure networks (Road, Water and Sewer) for Zahraa El-Maadi city. The network consists of 508 segments where each has a 7 of possible scenarios for rehabilitation interventions. Each scenario is conducted in a certain year at the study period. 508 segments are considered in the example with the 7 scenarios and 20 years as study period. As such, an estimated 7508 × 20508 possible combinations exist and are required to be examined, which is too complex to be solved mathematically. The presented optimization model is used to search this large space of available constrained alternatives to provide feasible solutions. Table 9 shows the results obtained from the optimization model; the results in this table give an average integrated risk Index of 5.45. As shown in Figure 5 the largest portion of projects, over 86%, were recommended under integration option as follows: road/water/sewer 38%, Road/sewer 24% and Road/water 24% which maximize gains for the invested money. Figure 6 presents network map that illustrates the results of intervention for each segment. The segment needs an intervention using one of those scenarios have a color code express that scenario
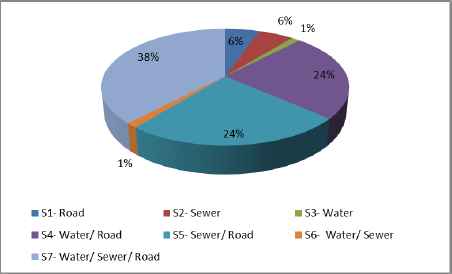
Percentage Distribution of Intervention Option Results
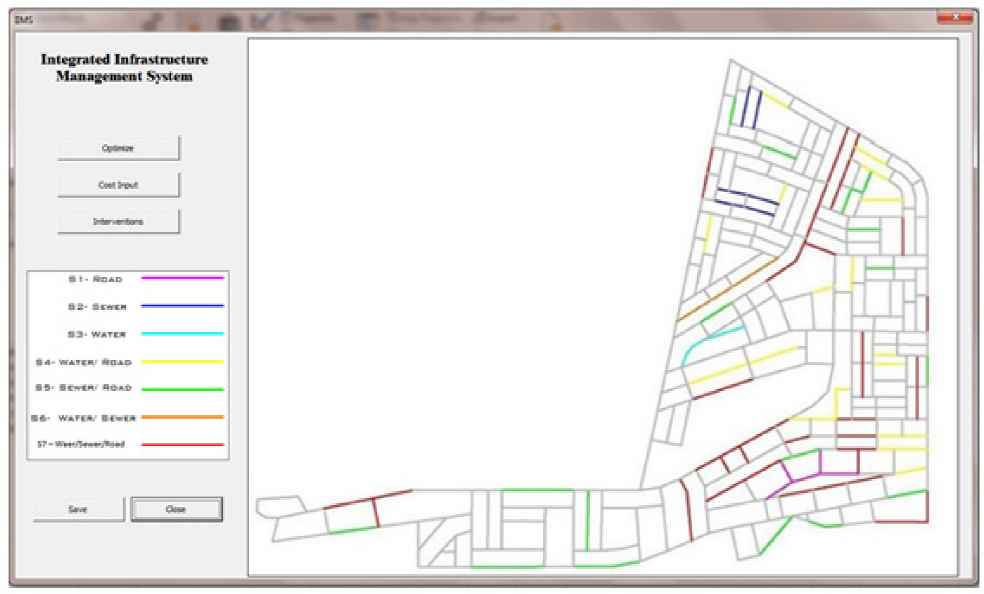
Integrated Infrastructure Management System Results
| Year | Projects cost (EGP) | Number of Segments for Each Scenario | ||||||||
|---|---|---|---|---|---|---|---|---|---|---|
|
|
||||||||||
| S1 | S2 | S3 | S4 | S5 | S6 | S7 | ||||
| 1 | 50,029,848 | 3 | 2 | 1 | 14 | 9 | 1 | 21 | ||
| 2 | 1,372,546 | 0 | 0 | 0 | 0 | 0 | 0 | 1 | ||
| 3 | 1,079,863 | 0 | 0 | 0 | 1 | 0 | 0 | 1 | ||
| 4 | 362,337 | 0 | 0 | 0 | 1 | 0 | 0 | 0 | ||
| 5 | 2,852,800 | 0 | 0 | 0 | 0 | 0 | 0 | 2 | ||
| 6 | 1,394,101 | 0 | 0 | 0 | 1 | 0 | 0 | 0 | ||
| 7 | 1,049,387 | 0 | 0 | 0 | 1 | 0 | 0 | 1 | ||
| 8 | 3,868,448 | 0 | 0 | 0 | 0 | 1 | 0 | 1 | ||
| 11 | 1,301,531 | 0 | 1 | 0 | 0 | 0 | 0 | 0 | ||
| 12 | 1,490,659 | 0 | 0 | 0 | 0 | 1 | 0 | 0 | ||
| 13 | 2,252,274 | 0 | 0 | 0 | 0 | 1 | 0 | 1 | ||
| 14 | 1,342,545 | 0 | 1 | 0 | 0 | 1 | 0 | 0 | ||
| 15 | 1,144,666 | 0 | 0 | 0 | 0 | 1 | 0 | 0 | ||
| 18 | 1,128,017 | 0 | 0 | 0 | 0 | 1 | 0 | 0 | ||
| 19 | 3,274,416 | 1 | 0 | 0 | 1 | 2 | 0 | 0 | ||
| 20 | 1,035,937 | 0 | 0 | 0 | 0 | 1 | 0 | 0 | ||
|
|
||||||||||
| Total | 74,979,375 | 4 | 4 | 1 | 18 | 18 | 1 | 28 | ||
Optimization Results
4. Conclusions
This research presented methodology for integrated infrastructure management system of road network, water distribution network and wastewater distribution network. The research methodology was based on developing condition assessment model, risk Assessment model and evaluation of performance measure. Prioritization using optimization was developed to perform the integrated rehabilitation plan. A Fuzzy-based technique was used to model the deterioration of infrastructure assets and predicting the condition. It suits the situations when data are scarce and cause-effect knowledge is imprecise. Observations and criteria are often expressed in linguistic terms. In order to develop the deterioration model, hierarchical fuzzy expert system (HFES) technique is used and verified to process the input data, which is the effect of deterioration factors to estimate the condition for each infrastructure. The Risk Assessment model that was developed to predict and assess the probability of failure and consequence of failure of an integrated road segment, water-main, and sewer-main asset. Eighteen factors within four main parameters (economic, environmental, operational, and social impacts) are used to represent the consequence of failure assessment process. The relative weight of each factor within each consequence of failure parameters was calculated using an AHP process. The economic parameters have the highest impact on assets consequence of failure with a relative weight of (39%) followed by operational, environmental, and social parameters with a relative weight of (25%, 19% & 17%) respectively for water-main networks. Similarly, the relation weights were estimated for sewer main networks and road networks. Detailed results show that pipe/ road size factors have the highest effect on overall Consequence of Failure index. In order to assigning the probability of failure for each infrastructure, Fuzzy Monte Carlo Simulation (FMCS) has been used to model the probability of failure (POF) and developing the risk index distribution for each asset. The risk model factors vary from statues, subjective and probabilistic factors. Whereas, Fuzzy Monte Carlo Simulation (FMCS) is used to handle both random and fuzzy uncertainties in risk assessment model.
Optimization model was developed using genetic algorithms to determine the integrated rehabilitation plan. This model utilizes the available replacement/ rehabilitation alternatives, setting priorities for integrated rehabilitation, implementing optimization of renewal cost and defining the best replacement interval. The optimization model objective was to minimize the overall risk index and NPV subject to condition, LOS, and budget constraints. A case study was presented for Zahraa El-Maadi, Cairo, Egypt to illustrate the use of the Integrated Infrastructure Management System. The proposed methodology requires City staff to work together to develop a shared database of asset inventories, condition, performance and financial information to support decision-making throughout the organization and community, resulting in efficient and effective management of infrastructure services.
References
Cite this article
TY  - JOUR
AU  - Mohamed Marzouk
AU  - Ahmed Osama
PY  - 2017
DA  - 2017/03/02
TI  - Fuzzy-Based Methodology for Integrated Infrastructure Asset Management
JO  - International Journal of Computational Intelligence Systems
SP  - 745
EP  - 759
VL  - 10
IS  - 1
SN  - 1875-6883
UR  - https://doi.org/10.2991/ijcis.2017.10.1.50
DO  - 10.2991/ijcis.2017.10.1.50
ID  - Marzouk2017
ER  -