
Decision Support for Intelligent Energy Management in Buildings Using the Thermal Comfort Model
- DOI
- 10.2991/ijcis.2017.10.1.59How to use a DOI?
- Keywords
- Decision Support System; Intelligent Energy Management; Thermal Comfort Validator; Energy Reduction; Buildings; Web Applications
- Abstract
The main objective of this paper is to present a transparent Decision Support System (DSS) for the energy managers of buildings, which can assist them in setting indoor temperature set point, based on the feedback received by the occupants. Within the proposed DSS, the Thermal Comfort Validator (TCV) tool is introduced, a fully responsive and cross-platform web-app which exploits the Predicted Mean Vote comfort theory by considering real-time feedback of the occupants. The TCV facilitates the detection of the range of accepted temperature inside a building, by correlating “real” with “predicted” thermal comfort, to overcome the limits of the standardized approaches. The proposed system can reveal an important potential for achieving energy savings by means of dynamic event driven data collection and processing, while ensuring high levels of comfort.
- Copyright
- © 2017, the Authors. Published by Atlantis Press.
- Open Access
- This is an open access article under the CC BY-NC license (http://creativecommons.org/licences/by-nc/4.0/).
1. Introduction
The European Union (EU) has set long-term objectives for the building sector by 2030 and 2050, such as decrease of the CO2 emission by 88%-91% in 2050, compared to 1990 levels 1–3. A wide set of National Building Codes and European Directives (EPBD, EED and RED) has been adopted by the EU across individual Member States (MS) to actively promote energy savings, namely the Energy Performance of Buildings Directive (EPBD), Energy Efficiency Directive (EED and Renewable Energy Directive (RED). The EPBD Recast (Directive 2010/31/EU) made MS face new tough challenges like new and retrofitted nearly Zero Energy Buildings (nZEB) by 2020 (2018 in the case of public buildings) and, for the first time, the application of a cost-optimal methodology for setting minimum requirements 4. The challenge for the new recast of both the Energy Performance Directive and the Energy Efficiency Directive is to give Member States their freedom to facilitate and realize energy transition in a way that fits with the wide diversity of national developments 5.
In this regard, many building energy management systems of significant capabilities have been developed to optimize energy use which, among others, is achieved though the efficient management of the heating and cooling systems. However, given that energy savings and thermal comfort are not always compatible, it is commonly stated that the indoor conditions shaped are not the ideal ones from the occupants’ perspective. This is particularly true for the case of municipal buildings that are widely used by the public and thermal comfort parameters during operation are defined by technical standards 12. Although numerous studies available in the international literature focus on the assessment of thermal comfort in different types of buildings 13–19, their results are case-dependent and lead to relative time-independent suggestions which might not always be appropriate. Towards this direction, set-point management should be dynamically applied in buildings, aiming both at:
- •
Creating acceptable comfort levels for occupants by grasping their thermal sensations feeling
- •
Achieving energy consumption reduction, leading to energy and cost savings.
Indeed, the temperature of a building cannot be arbitrarily set to any value that would imply the least consumption of energy as this would consequently affect thermal comfort in a considerable way 6–8, which however needs to remain within accepted levels specified by relevant standards 9. Thermal comfort and energy consumption can be considered contrasting cost functions and an optimisation process is needed to reach an acceptable compromise. Current comfort standards, such as EN ISO 773010, EN 1525111, and ASHRAE Standard 5512 determine design values for operative temperatures and comfort equations, such as the Predicted Mean Vote (PMV) index and the adaptive thermal comfort model11. Yet, the “predicted” thermal comfort level estimated by the standards might differ from the “real” one of the building users, leading to inadequate set point temperatures and therefore poor performance. Thus, a system which effectively captures the “real” sensation of the users and correlates it with the “predicted” one to detect a range of accepted set point temperatures becomes promising and overcomes the limits of the standardized approaches. Such an integrated decision support methodology and respective system is not present in the international scientific literature 20–22.
In this context, we introduce the Thermal Comfort Validator (TCV), a Decision Support System (DSS) which exploits both thermal comfort theory and feedback received from the building users in order to calibrate the theoretically optimal set point temperature based on their real sensation. More specifically, the tool incorporates a simplified questionnaire to capture in real-time the mean thermal comfort level of the building occupants and then correlates the results (e.g. hot-neutral-cold) with these calculated by the standards using the monitored indoor conditions. Finally, the tool uses the formula estimated earlier to decide which should be the set point temperature of the building for the running or a future hour using the monitored and the forecasted indoor conditions, respectively. Since the original set point temperature may excess, the proposed system is possible to lead to significant energy savings, while ensuring high levels of comfort.
The proposed DSS is mainly based on the context of a project financed by the European Commission, titled “OPTIMising the energy USe in cities with smart decision support systems (OPTIMUS)”. The overall vision of the OPTIMUS project is the design, development and implementation of a Decision Support System (DSS) addressed to local authorities, so as to optimize the energy use in their premises and achieve significant reduction of CO2 emissions.
The rest of the paper is structured as follows: Section 2 is devoted to present of the thermal comfort model that is examined within the proposed DSS. The system for the set-point management in buildings and the related web-based tool are described in Section 3. Section 4 presents results from the pilot appraisal of the adopted approach. Finally, in the last section the key issues that have arisen in this paper are summarized.
2. Materials and Methods
Three main metrics are examined and exploited within the proposed DSS for the set-point management in buildings. A short description of each one is provided in the following paragraphs.
2.1. Predicted Mean Vote (PMV) Index based on Standards
Standardized thermal comfort is calculated using the PMV index. PMV is a 7-point thermal sensation scale that ranks zero at a neutral thermal feeling and -3, 3 when the user feels cold or hot, respectively. Intermediate values reflect intermediate stages of thermal comfort (Fig. 1).
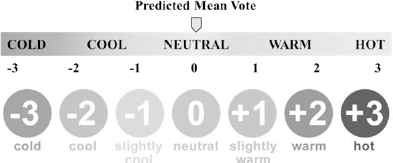
PMV index - 7-point thermal sensation scale
The PMV index can be theoretically calculated by using six variables related to indoor conditions and occupants’ profiles, namely air temperature, mean radiant temperature, relative air velocity, relative humidity, clothing insulation, metabolic rate.
This index is calculated according to EN ISO 7730:2005 10 using predictions for the indoor conditions of the building.
2.2. Observed Mean Vote (OMV)
The Observed Mean Vote (OMV) is calculated by the PMV equations, using monitored, and not predicted, values of temperature and humidity, as measured by the building sensors in real-time.
2.3. Actual Mean Vote (AMV) through Thermal Comfort Validator (TCV)
The Actual Mean Vote (AMV) represents actual thermal comfort. The value of the index is not calculated, but is derived directly by the Thermal Comfort Validator (TCV, http://validator.optimus-smartcity.eu), a web application, where occupants are encouraged to submit structured feedback on their thermal sensation. This feedback is then analysed and evaluated. The AMV is the direct outcome of the TCV during the days of the week under examination.
The TCV web application is a cross-platform tool that can be used from multiple devices, such as PCs, tablets and mobile phones. It is not dependent on systems and equipment installed in the buildings and, as a result, it does not need any modifications or further customization. TCV was developed using PHP, MySQL and JavaScript open-source programming languages. The web app uses the WordPress content management system (CMS) for the user accreditation system and assures the responsiveness in all devices. Moreover, the following tools have been used for the development and the successful implementation of the online questionnaire: jQuery & jQuery UI, Google WebFonts, IcoMoon Font Library, jQuery File Upload, blueimp Gallery, and FSQM Module. A MySQL database serves as the local storage of the TCV that hosts user input.
TCV follows a user-centric design that encourages end users to provide input to the platform through a friendly, intriguing interface. The User Interface (UI) is simplistic, providing only the required elements to capture user input without distracting them from their actual work or role in their environment. The simplicity of the design of the TCV reduces the required time to fill in the questionnaire, allowing for more users to send information more times per day, minimizing the time penalty for them. More elaborate input requirements could probably improve the quality of the measurements, but the number of submissions could drop dramatically if users need to spend more than a few seconds to provide feedback to the system. The overall design also uses HTML 5 – CSS 3 techniques to remain responsive and it can be used from multiple devices like PCs, tablets and mobile phones (cross-platform).
A brief description for each category of UI in TCV is presented below (Fig. 2):
- •
General Information: The user introduces the date and time of the submission, the address of the building and the type of the building. The user also has the possibility to register their email address in order to have a copy of their submission, as well as, to be in contact with the system administrator to gather more information regarding the Validator.
- •
Temperature: The user has to rate his/her thermal sensation (cold, cool, slightly cool, neutral, slightly warm, warm, hot) and the perception of the temperature (clearly acceptable, just acceptable, just unacceptable, clearly unacceptable). Moreover, the user introduces in the system his/her preference to a higher or a lower temperature of the room.
- •
Air velocity: The user has to specify their preference regarding optimal air velocity.
- •
Lighting: In the 4th category the user has to specify the desirable indoor lighting conditions.
- •
Clothing: The users specify in the 5th category the type (shorts or short skirt, jeans or other long pants or long skirt, jumper and/or jacket, vest or singlet top, short sleeved shirt, long sleeved shirt, shoes and/or socks, etc.) and the colour (light or dark) of their clothes. The user’s clothing (material, skin coverage and colour) strongly affects the way they perceive the actual temperature. For instance, users wearing long and thick clothes will feel warmer than users wearing thin shorts at a given temperature. Respectively, dark clothes absorb more radiation than light ones, leading to different perceptive depending on the type of clothes worn 25.
- •
Activity: In the last category, the user specifies his/her activity during the last half hour. The current physical activities of the user can also affect the perceiving of the environmental conditions by the user, and should also be taken into account.
After the submission, the user can share the TCV WebApp to social media like Facebook, Twitter and Google+.
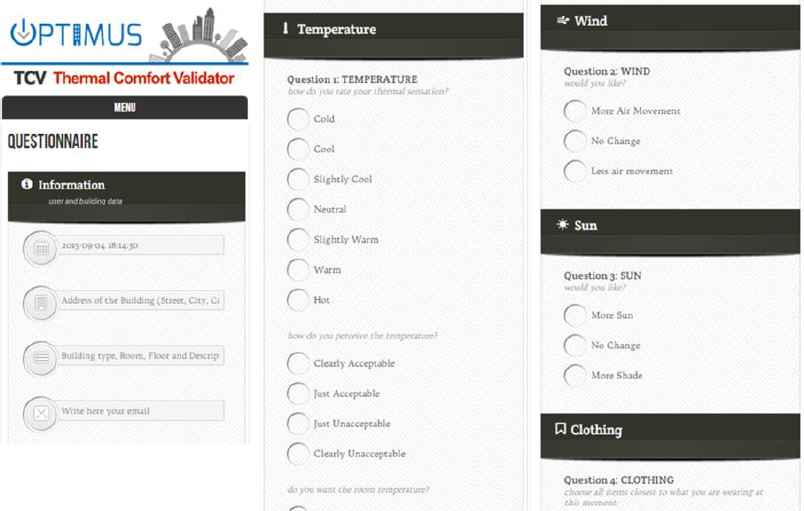
TCV Web App
3. Proposed Decision Support System
3.1. Main steps
More specifically, the proposed system for the set-point management consists of the following series of steps:
Step 1 - PMV Calculation: Predicted values of indoor conditions are used in the PMV equation to calculate the PMV value for a week ahead. Calculations refer to hourly time-slots, while the value of air temperature is provided by an Indoor Temperature Prediction Model 24. In practice, PMV values represent which will be the theoretical comfort level of the building users if the forecasts come true, and therefore indirectly suggest the set point temperature which must be used to achieve a neutral sensation. However, given that the suggestions might need to be calibrated based on the real sensation of the users, PMV values can be latter used (Step 7) to re-estimate the original set-point temperature for the forthcoming week.
Step 2 - AMV retrieval by TCV Web App: AMV is the direct outcome of the TCV during the days of the week under examination (running day and six days before) and represents the real thermal sensation of the building users. The feedback by the occupants is registered via the TCV web application and retrieved in real-time per hour. Users contribute by completing a questionnaire, whether they feel cold, cool, slightly cool, neutral, slightly warm, warm or hot. This input is translated into AMV values of -3, -2, -1, 0, 1, 2 and 3, respectively. After collecting individual feedback by the TCV application, a question concerning the exact time when the user felt uncomfortable is arisen. The TCV application captures the time of access by the user, but this does not provide any information on the time interval when the user felt discomfort. Thus, an assumption that can be made is that the AMV value of the questionnaire refers to the comfort level of the exact time it was completed, expanded before and after by a certain time interval. This assumption is based on the consideration of the time needed until the user decides to share thermal sensation, as well as the system’s inertia to reflect a change. Therefore, the feedback taken by each questionnaire can be considered to have duration and effect resembling the general scheme presented in Fig. 3. As a result, the main feedback is expanded hourly, before and after the exact time of submission, reduced by 50%, until it reaches 0.
Step 3 - AMV Filtering: The average value of TCV inputs is calculated per hourly time slot. However, further filtering is applied to the AMV values, in order to exclude input provided during non-operating hours of the building. Moreover, the existence of less than 3 registrations indicates inadequate input and is therefore discarded. After the filtering process, the hourly AMV values are finalized.
Step 4 - OMV Calculation: During the week under examination, OMV is calculated based on the respective equation 10 and by using monitored temperature and humidity values. The values of the clothing insulation and metabolic rate are estimated based on the relevant standard 10. In this regard, OMV values represent which was the theoretical comfort level of the building users at the examined period and indirectly suggest the set point temperature which should have been used to achieve a neutral sensation
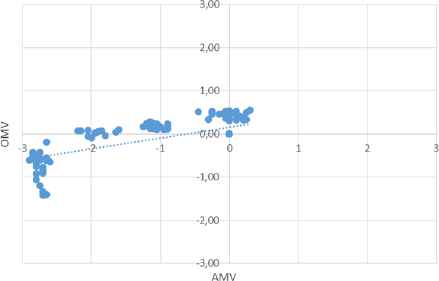
Step 5 - Correlation calculation between AMV-OMV: Filtered AMV values are correlated with those of OMV using linear regression, as noted below and visualized in figure:
, whereStep 6 - Definition of OMV value that corresponds to AMV=0: Given the difference identified between actual and observed thermal sensation, it becomes clear that in order the users to experience neutral (0) comfort feeling, indoor temperature has to be adjusted so that AMV equals zero.
Step 7 - Definition of the temperature value that corresponds to this OMV (or PMV): For the OMV value specified in the previous step, the reverse OMV equation is solved, in order to find the temperature that results to this specific value of OMV, given that the rest of the values are considered equal to the average weekly values. This is achieved by estimating which temperature leads to an OMV of value equal to a. The temperature calculated is the main outcome of the action plan: it constitutes a suggestion for the optimal set-point temperature at the running hour. Respectively, in case OMV is replaced by PMV (Step 1), the set point temperature estimated by the reverse PMV equation will constitute a suggestion for the forthcoming week. Thus, depending on the choice made, TCV tool can be used either in real-time to optimize thermal comfort and energy use, or as a tool for programing the indoor condition parameters of the building for the upcoming week. In both cases the energy manager is highly benefited and assisted in a straightforward way.
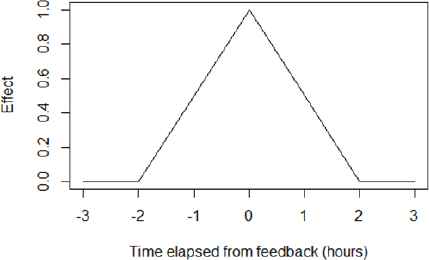
Generalized feedback duration and effect

Correlating OMV with AMV. Values calculated using indoor monitored data of the Sant Cugat Town Hall (01-01-2016 to 06-10-2016)
3.2. Web-based tool
The proposed system was implemented as PHP service classes and integrated in a Symfony application. It is fed with dynamic data of indoor temperature and humidity from sensors installed in the sectors of the pilot buildings, and with the users’ feedback concerning the thermal sensation via the TCV questionnaire.
The service, which calculates the suggestions of the proposed methodology, is invoked asynchronously at nights and saves the results in suitable tables of a database. At run-time the controller is called and it gathers the results concerning the week under examination from the database (Fig. 5).

Web-based Tool
Finally, the Twig template is rendered by the controller of Symfony with all the needed information. In the view file we use the Twig templating language, HTML, CSS and Javascript, in order to show on screen the final results of the action plan, as well as the results of the inference rule and the users’ feedback for all the sections of the pilot building.
A GitHub repository has been created to maintain the source code of the DSS (https://github.com/epu-ntua/optimusdss).
4. Real Life Application
In order to evaluate the proposed system in a real life application, the suggested approach was implemented to the town hall of Sant Cugat, located in north of Barcelona in Catalonia, Spain. The Town Hall of Sant Cugat is a new building, which was built in 2007 and therefore has a long life expectancy. The building is covering an area of 8.593 m2 and is divided into 6 storeys (main hall, 3 floors and 2 basements). It is typically open from 7:30 to 21:30, while normal working hours for the offices are 8:00 to 15:00. The building is occupied by approximately 350 employees on an average day and also near 400 temporary visitors.
4.1. Building infrastructures and climate data
The town hall is supplied by high voltage electricity, which is converted to low voltage by a special installation and both heating and cooling is performed by electrical heat pumps. The heated or cooled water produced by the heat pump is distributed throughout the floors via pipes to 28 different AHUs (Air Handling Unit) available in the building. The outdoor air first flows through 2 enthalpy recuperators on the roof and then is distributed via ducts to each AHU. The total installed thermal power is 850 kW, while the total installed electrical power is 550 kW. This leads to an average annual electricity consumption of 1.222 MWh, which is transformed into 538 tons of CO2 emissions and an energy cost of 193.000 €.
Each floor is divided into tree thermal zones, meaning that for each zone both monitoring and controlling of the indoor temperature is possible. The thermal zones are defined based on the orientation and the design of the building, as seen in Fig. 6. Zones A, B and C have an orientation of West, East and North respectively. Additionally, outdoor temperature and relative humidity is monitored using appropriate equipment.
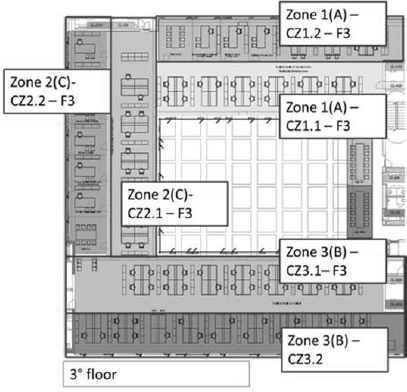
Plan of the third floor of Sant Cugat Town Hall with the building partitioning referred to the thermal zones
Sant Cugat has a Subtropical-Mediterranean climate (Csa) 23 with mild winters and hot summers. Its average annual temperature is 15°C: 20 °C during the day and 11 °C at night. In the coldest month - January, the temperature ranges from 5 to 14 °C within the day, while in the warmest month – August, from 22.5 °C to 26 °C. In this respect, the set point of the Town-Hall is set as a first tentative to 23°C during the heating season (15th October-15th April) and to 25 °C during the cooling season. Given the outdoor temperature of the area and the set point values, visualized in Figure 7 on monthly basis, the building is facing a total of 1970 heating degree days and 590 cooling degree days.
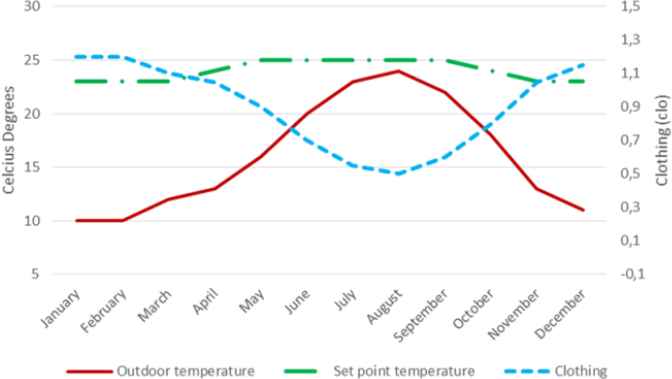
Climate parameters for the Town Hall of Sant Cugat
As seen, since clothing is a prerequisite for calculating PMV, a minimum value of 0.5 clo (trousers and shirt) and a maximum value of 1.2 clo (light business suit) was assumed, taking into consideration the thermal insulation for typical combinations of garments 10.
It was then linearly correlated with the mean monthly temperatures in order to extract an approximation of clothing for each month using the following formula.
The air velocity equal to 0.15 m/s (barely noticeable) and the activity rate equal to 1.2 met (standing) throughout the year. The indoor temperature and relative humidity are collected by the monitoring system of each thermal zone. More specifically, 30 sensors have been installed in the town hall in order to measure simultaneously temperature, CO2 level and humidity. Moreover, 14 humidifiers were installed to regulate the relative humidity inside the building and improve the indoor comfort.
4.2. Implementation of the TCV
Since the beginning of its operation, TCV has collected more than 1,600 feedbacks. The results are presented below and indicate that, in general, the building users are quite satisfied with the set point temperature chosen. Moreover, the energy manager reports that after launch, the staff receives more suggestions than complaints and that’s a key point towards optimizing the operation of the building and the thermal comfort of the users.
| Cold | 11% |
| Cool | 13% |
| Slightly Cool | 6% |
| Neutral | 31% |
| Slightly Warm | 21% |
| Warm | 10% |
| Hot | 8% |
Feedback from the TCV web application
4.3. Application of the DSS
The evaluation of the DSS is performed for 6 different thermal zones of the Sant Cugat Town Hall, two of each direction (A, B & C) at floors 1 and 3 of the building. This is done in order to assess its effect in diversified parts of the building and extract trustworthy conclusions. The testing period expands from 01-01-2016 to 06-10-2016 including in total 41 weeks (6,688 hours), 15 of which refer to heating and 26 to cooling season.
By following the steps presented in Section 3.1, the PMV score of each thermal zone is first calculated on hourly basis using the predicted indoor conditions for the upcoming week. Then, the user feedback is collected and filtered. Finally the OMV is calculated using monitored/assumed values and then correlated with filtered AMV using a linear regression model. The model is estimated separately for each week examined, as the final set-point suggestions are required on a weekly basis. Through the model the OMV value that corresponds to AMV=0 is defined and the optimal indoor (set-point) temperature is defined.
At this point we note that, since the predictions made at week n are close to the monitored values of week n+1, PMV and OMV are practically the same when referring at the same period. Thus, for reasons of simplicity, in this study we identify the optimal set point temperature using only the OMV values – real-time use of the system. However, the set point temperature of week n+1 can be alternatively estimated using the PMV values calculated at week n – programming indoor temperature parameters for the upcoming week.
A characteristic example of the implementation of the DSS is presented in Figure 8. The graph corresponds to the east-directed thermal zone of the first floor of the building during the period (31-01-2016 to 06-02-2016) and visualizes the real indoor temperature monitored, the set point temperature suggested, as well as the OMV/AMV values estimated for the operating hours of the Town-Hall. As seen, although in general the set point used achieves an adequate level of thermal comfort (OMV), the sensation is noticeably declined during the weekends and the opening or closing hours. In this regard, the TCV users send a relative feedback of discomfort (AMV) informing the system that the set point should be increased.

Implementation of the proposed DSS for the 6th week of year 2016 for an east-directed thermal zone of the Sant Cugat Town Hall
Through the linear equation connecting OMV with AMV, the “optimal” indoor temperature from the user perspective is estimated according to formulas 1-3 and used to adjust the set point (Fig. 9).
Correlating OMV with AMV values for the 6th week of year 2016 for an east-directed thermal zone of the Sant Cugat Town Hall. Here, OMV=0.51+0.4*AMV
The effect of the proposed DSS is summarized in Table 2 where the percentage of operational hours for every PMV value are presented before and after considering the TCV input. For example, in the north-directed thermal zone of the first floor of the building, 9.1% of the operational hours the mean user feels slightly cool. As seen, before the implementation of the DSS, less than half of the hours (48%) are considered to be neutral, while in 47% of the cases the mean users feels slightly warm or warmer. The results are very interesting given that the users of the north-directed thermal zones are more likely to face colder weather sensation while the occupants of the top floor are more vulnerable in hot weather. In this respect, the set point is relatively adjusted by the TCV per thermal zone leading to significant improvements. Not only does in the 71% of the operational hours the adjusted set point achieves a PMV value of “Neutral”, but also eliminates extreme scores, such as the “Warm” and “Hot” sensation that were previously recorded. Finally, the updated set points lead to a uniform thermal sensation within the building, regardless the location of the thermal zone (floor & direction).
| Zone | Cold | Cool | Slightly Cool | Neutral | Slightly Warm | Warm | Hot |
|---|---|---|---|---|---|---|---|
| Original set point | |||||||
| C 1st floor | 0.0 | 0.0 | 9.1 | 59.8 | 28.2 | 2.3 | 0.6 |
| C 3rd floor | 0.0 | 0.0 | 10.5 | 55.8 | 30.6 | 2.7 | 0.4 |
| B 1st floor | 0.0 | 0.0 | 1.5 | 52.8 | 44.6 | 1.0 | 0.1 |
| B 3rd floor | 0.0 | 0.0 | 1.5 | 45.7 | 51.9 | 0.8 | 0.1 |
| A 1st floor | 0.0 | 0.0 | 1.7 | 38.5 | 57.4 | 2.2 | 0.2 |
| A 3rd floor | 0.0 | 0.0 | 1.2 | 37.3 | 59.5 | 1.8 | 0.2 |
| Adjusted set point after considering the user feedback through TCV | |||||||
| C 1st floor | 0.0 | 0.0 | 0.0 | 69.0 | 31.0 | 0.0 | 0.0 |
| C 3rd floor | 0.0 | 0.0 | 0.0 | 68.7 | 31.3 | 0.0 | 0.0 |
| B 1st floor | 0.0 | 0.0 | 0.0 | 74.2 | 25.8 | 0.0 | 0.0 |
| B 3rd floor | 0.0 | 0.0 | 0.0 | 67.2 | 32.8 | 0.0 | 0.0 |
| A 1st floor | 0.0 | 0.0 | 0.0 | 77.8 | 22.2 | 0.0 | 0.0 |
| A 3rd floor | 0.0 | 0.0 | 0.0 | 67.9 | 32.1 | 0.0 | 0.0 |
Thermal comfort levels achieved before and after the implementation of the proposed methodological approach. Percentage of operational hours for every PMV value.
5. Conclusions
An intelligent system was proposed in this paper, aiming at the set-point management based on the feedback received by the occupants. It involved the development of the TCV, a fully responsive and cross-platform web-app that can be automatically adapted to any screen resolution regardless of the operational system and device type. After accessing the app, end users have to register a series of data related to their thermal sensation. The validation of the proposed DSS so far has provided evidence that it can reveal an important potential for achieving energy savings by means of dynamic event driven data collection and processing, while ensuring high levels of comfort.
An additional functionality of the DSS is that it can reveal possible need for maintenance. Thermal comfort standards are developed to ensure that the majority of the building occupants are within the comfort levels, regardless their age, gender and mobility etc. Therefore, if it is observed that users systematically feel discomfort, even when the OMV is within acceptable levels, then this could suggest the existence of one of the following problems:
- •
Failure of the monitoring system – sensors.
- •
Need for maintenance of the HVAC system.
- •
Thermal losses via the distribution system or the building envelope.
The above reasons should be customized according to the profile and existing systems of the building under examination. If a large number of unacceptable feedbacks is reported, the system may propose a maintenance check.
Acknowledgment
This work has been performed within the project “OPTIMising the energy USe in cities with smart decision support system (OPTIMUS) - http://www.optimus-smartcity.eu”, which has received funding from the European Union Seventh Framework Programme (FP7/2007-2013) under grant agreement n° 608703. The authors wish to thank Victor Martinez (Director, Sant Cugat), whose contribution, helpful remarks and fruitful observations were invaluable for the development of this work. The content of the paper is the sole responsibility of its authors and does not necessary reflect the views of the EC.
References
Cite this article
TY  - JOUR
AU  - Vangelis Marinakis
AU  - Haris Doukas
AU  - Evangelos Spiliotis
AU  - Ilias Papastamatiou
PY  - 2017
DA  - 2017/03/24
TI  - Decision Support for Intelligent Energy Management in Buildings Using the Thermal Comfort Model
JO  - International Journal of Computational Intelligence Systems
SP  - 882
EP  - 893
VL  - 10
IS  - 1
SN  - 1875-6883
UR  - https://doi.org/10.2991/ijcis.2017.10.1.59
DO  - 10.2991/ijcis.2017.10.1.59
ID  - Marinakis2017
ER  -