
Failure Mode and Effect Analysis using Soft Set Theory and COPRAS Method
- DOI
- 10.2991/ijcis.2017.10.1.67How to use a DOI?
- Keywords
- Failure mode and effect analysis; Soft sets; COPRAS method; Risk assessment
- Abstract
Failure mode and effect analysis (FMEA) is a risk management technique frequently applied to enhance the system performance and safety. In recent years, many researchers have shown an intense interest in improving FMEA due to inherent weaknesses associated with the classical risk priority number (RPN) method. In this study, we develop a new risk ranking model for FMEA based on soft set theory and COPRAS method, which can deal with the limitations and enhance the performance of the conventional FMEA. First, trapezoidal fuzzy soft set is adopted to manage FMEA team members’ linguistic assessments on failure modes. Then, a modified COPRAS method is utilized for determining the ranking order of the failure modes recognized in FMEA. Especially, we treat the risk factors as interdependent and employ the Choquet integral to obtain the aggregate risk of failures in the new FMEA approach. Finally, a practical FMEA problem is analyzed via the proposed approach to demonstrate its applicability and effectiveness. The result shows that the FMEA model developed in this study outperforms the traditional RPN method and provides a more reasonable risk assessment of failure modes.
- Copyright
- © 2017, the Authors. Published by Atlantis Press.
- Open Access
- This is an open access article under the CC BY-NC license (http://creativecommons.org/licences/by-nc/4.0/).
1. Introduction
Failure mode and effect analysis (FMEA) is a proactive risk management technique commonly used to identify and eradicate potential failures, problems and errors from a system, design, process or service before they reach customers 1. The FMEA methodology was created and implemented first in the US aerospace industry in early 1960s for assessing the influence of system and equipment failures on safety of personnel or equipment and mission success 2. As an inductive risk assessment approach, it aims to discover and prioritize potential failure modes along with the focused system and identify the most critical ones for risk mitigation. The application steps of FMEA generally include: analyze the given process, product or service, list of all potential failure modes, evaluate their frequency, severity and detection, prioritize the identified failure modes, and develop corrective actions to eliminate or reduce the critical failure modes 1, 3. Nowadays, with its simplicity and visibility characteristics, FMEA has been widely applied in various areas, such as the aerospace, automotive, nuclear, and healthcare industries 4–7.
In the traditional FMEA, the listed failure modes are normally ranked according to the risk priority number (RPN), which is a product of the risk factors occurrence (O), severity (S) and detection (D) for a failure mode. Here, O and S are the frequency and seriousness (effects) of the failure mode, and D is the probability of not detecting the failure mode. Generally, the three risk factors are estimated in line with numeric ratings from 1 to 10 3, 8, 9. The bigger the RPN value of a failure mode, the more priority degree it should be given. Thus, the failure modes can be ordered with respect to their RPNs and then suitable corrective strategies should be taken on the key failures preferentially. However, the traditional RPN method has some inherent limitations as criticized by many researchers, and the important ones are restated as follow: First, the RPN method assumes that the ratings of failure modes are crisp numerical values, but this is not possible in many real world circumstances 3, 10, 11. Second, in the conventional FMEA, the relative weights of risk factors are set equal. However, in the practical risk analysis process the importance weights of risk factors may be inequality or inconsistence 3, 10–12. Third, different combinations of risk factors’ scores may yield exactly the same RPN value, but the risk implications of these failure modes may be not completely equivalent 3, 10–13. Fourth, the mathematical form adopted for the calculation of the RPN index is debatable and short of scientific foundation 10, 11, 13, 14. For example, the risk factors O, S, and D are assessed by discrete ordinal scales of measure, but the operation of multiplication is pointless on ordinal scales according to the measurement theory. Fifth, the dependency between risk factors is not taken into account in the traditional FMEA. In the real risk assessment problem, various types of relationships may exist among risk factors, while the traditional FMEA assumes that all risk factors are independent.
Effective risk and failure analysis demands robust analytical methods or mathematical tools that are applicable to FMEA and able to analyze vague and uncertain data. Hence, to overcome the disadvantages around the traditional FMEA, its improvements boom in recent years and were accomplished by incorporating risk factor weights, uncertain theory, more factors, and so on, into the risk analysis 15–18. In this paper, we contribute a novel risk priority approach based on soft set theory and COPRAS method to enhance the assessment capability of FMEA. To manage such situations where FMEA team members are hesitant in expressing their assessments over failure modes, the trapezoidal fuzzy soft set, a vital concept of soft set, is applied to deal with FMEA experts’ diverse risk assessments. In view of the multi-criteria nature of the FMEA problem, the multi-criteria decision making (MCDM) method of complex proportional assessment (COPRAS) 19–20 is modified for the priority ranking of the failure modes identified by the FMEA team. Moreover, the non-additive Choquet integral is utilized to integrate the risk assessment values of failure modes considering the interactive relationships between risk factors. The proposed FMEA model addresses some important weaknesses of the classical RPN method and provides a more reasonable representation of the real world. Finally, we used a numerical example regarding crankcase explosion in marine diesel engines to demonstrate the proposed approach.
The organization of this paper is given as follows: In Section 2, we give a literature review of the extant risk evaluation approaches in the FMEA literature. In Section 3, we briefly review some basic definitions of soft sets and introduce Choquet integral. In Section 4, a risk priority model using soft set theory and COPRAS method is developed for prioritizing failure modes in FMEA. The application of the new FMEA approach on crankcase explosion failure analysis is provided in Section 5 to illustrate its feasibility and applicability. Finally, concluding remarks and further research proposals are presented in Section 6.
2. Literature Review
Over the last two decades, various risk priority methods have been proposed to improve the effectiveness of the traditional FMEA. Critical review has summarized the limitations of the RPN method and the risk evaluation approaches employed in the FMEA process 8. Based on previous studies, we categorize the methodologies used to compensate for the weakness associated with the traditional FMEA as follows: (1) MCDM methodologies, (2) mathematical programming models, (3) intelligent approaches, and (4) integrated approaches.
2.1. MCDM methodologies
The most popular MCDM methods applied to FMEA are grey relational analysis (GRA), technique for order performance by similarity to ideal solution (TOPSIS) and analytic hierarchy process (AHP). For example, Liu et al. 11 proposed a new FMEA model by combining interval 2-tuple linguistic variables and the GRA to capture FMEA team members’ diversity assessments and evaluate the risk of failure modes. Song et al. 16 developed a FMEA framework based on rough set theory and the group TOPSIS approach in order to determine a more rational rank of failure modes. Braglia 21 proposed a reliability and failure mode analysis approach by integrating four different factors: O, S, D and expected cost, and utilized the AHP technique to rank the risk for failure modes. In addition, other MCDM methods involving decision making trial and evaluation laboratory (DEMATEL) 22, VIKOR (Serbian name: VIsekriterijumska optimizacija i KOm-promisno Resenje) 23 and MULTIMOORA (Multi-Objective Optimization by Ratio analysis plus the full MULTIplicative form) 24 were used by different authors to overcome the traditional FMEA’s drawbacks.
2.2. Mathematical programming models
Some researchers used linear programming models to solve the problems that have arisen from the traditional FMEA. Wang et al. 25 used fuzzy risk priority numbers (FRPNs) based on fuzzy weighted geometric mean (FWGM) for risk evaluation of failure modes in FMEA, which are computed by using alpha-level sets and linear programming models. Instead of the linear programming approach, Gargama and Chaturvedi 12 adopted a benchmark adjustment search algorithm to determine alpha level sets of the FWGM. Additionally, the data envelopment analysis (DEA) method has been used by many researchers to conduct failure and risk analysis. For example, Netto et al. 26 developed a mathematical model based on the DEA for risk ranking in subsea flexible pipes, whereby subjective judgmental weights were provided as input and objective weights constituted the output of the model. In order to enhance FMEA assessment capabilities, Chang and Sun 27, as well as Chin et al. 9, proposed an FMEA approach which utilizes the DEA for the determination of the risk priorities of failure modes.
2.3. Intelligent approaches
There are some studies where intelligent approaches such as adaptive resonance theory (ART), cognitive map, and rule base system have been employed to evaluate the risk of failure modes in FMEA. For instance, Tay et al. 15 presented a clustering-based FMEA model using fuzzy ART for similarity analysis and clustering of failure modes, and applied it to the edible bird nest industry to demonstrate its usefulness. Salmeron and Gutierrez 28 integrated fuzzy grey cognitive map (FGCM) into FMEA for exploiting the knowledge and experience of experts on the description and modelling of the complex systems’ failure modes. Pillay and Wang 3 suggested a FMEA model which utilized the fuzzy rule base to rank the potential failure modes identified based on experts’ knowledge. Bowles and Peláez 29 described a fuzzy inference technique for risk assessment in FMEA, in which the relations between the risk factors O, S, D and the risk of failure modes were characterized by a fuzzy rule-based expert system. In addition, based on rule base systems, Kumru and Kumru 30 applied a fuzzy FMEA to improve the purchasing process of a public hospital and Jong et al. 31 used a fuzzy FMEA methodology to the production process of edible bird nest.
2.4. Integrated approaches
In order to combine the desired benefits of different methods, some integrated approaches to FMEA have been suggested in recent years. For example, Liu et al. 32 proposed a new FMEA framework by combining VIKOR, DEMATEL and AHP for evaluation, prioritization and improvement of failure modes. Wang, Liu and Quan 6 integrated the COPRAS and analytic network process (ANP) methods to rank the risk of failure modes and presented a case in hospital service setting to illustrate the proposed risk ranking approach. Liu et al. 33 developed a FMEA model for ranking the risk of failure modes based on fuzzy evidential reasoning (FER) and belief rule-based (BRB) methodology. Furthermore, a number of other integrated approaches have been proposed to overcome the limitations of the traditional FMEA, including combining fuzzy VIKOR with combination weighting 10, TOPSIS method with rough set theory 16, and grey relational projection method with D numbers 34.
From the literature review above, it is clear that different kinds of risk priority methods have been proposed to improve the performance of the traditional FMEA. These approaches compensate certain weaknesses associated with the traditional RPN-based FMEA. However, while a wide range of theories such as fuzzy sets, rough sets and intuitionistic fuzzy sets, have been used for dealing with the vagueness and uncertainty of risk assessments, each of these theories has its inherent difficulties in parametrization. In contrast, the soft set theory can produce a series of approximate descriptions of a complicated object being perceived from a parameterized point of view. On the other hand, FMEA can be regarded as a complex MCDM problem in that it requires considering a large number of failure modes in a multiple evaluation framework. Although many decision making problems have been successfully solved by using the COPRAS method, its application to FMEA is few and it provides a useful solution to address the limitations of the traditional FMEA. 6, 17 Therefore, in this study, we contribute to the literature by developing a new FMEA method based on trapezoidal fuzzy soft sets and COPRAS method to determine the risk priority orders of failure modes. The authors are aware that such integration of soft set theory and COPRAS method for FMEA is unique. Particularly, the Choquet integral is employed to compute the aggregate risk of failure modes, which can not only take the dependency of risk factors into account but also avoid the compensation between risk factor values.
3. Preliminaries
3.1. Trapezoidal fuzzy soft sets
Soft set theory is a newly emerging mathematical tool proposed by Molodtsov 35 to manage uncertain and complicated problems. By combing the concept of trapezoidal fuzzy numbers and soft set, Xiao et al. 36 introduced a generalized fuzzy soft set called trapezoidal fuzzy soft set to deal with vague linguistic assessments.
Definition 1.
Let
Clearly, a trapezoidal fuzzy soft set is a mapping from parameters to
For convenience,
For storing trapezoidal fuzzy soft sets in computer, the trapezoidal fuzzy soft set
Definition 2.
Let
- (1)
- (2)
- (3)
- (4)
Definition 3.
Let
Definition 4.
Let
To unify the TFSWA and the TFSOWA operators, the trapezoidal fuzzy soft hybrid averaging (TFSHA) operator is defined as below.
Definition 5.
Let
3.2. Choquet integral
Sugeno 37 proposed the concept of fuzzy measure as a powerful tool for modeling the interaction phenomena among combinations.
Definition 6.
Assume that X = {x1, x2,…,xn} is a universe of discourse and P(X) is the power set of X. The set function g : P(X) → [0,1] is a fuzzy measure on X which is non-additive and has the following properties:
- (1)
g(∅) = 0, g(X) = 1;
- (2)
If A, B ∈ P(X) and A ⊆ B, then g(A) ≤ g(B).
λ-fuzzy measure is a special kind of fuzzy measure defined on P(X) which satisfies the additional property:
- (3)
If A, B ∈ P(X) and A⋂B = ∅, then g(A⋃B) = g(A) + g(B) + λg(A)g(B) for −1 < λ < ∞.
Based on the above properties, λ > 0 means that g(A⋃B) > g(A) + g(B) and the set {A, B} has multiplicative effect; λ < 0 implies the substitutive effect of the set {A, B}; λ = 0 indicates that λ-fuzzy measure is additive and there is no interaction between A and B.
If A is a finite set,
Choquet integral is a tool introduced by Grabisch 38 for measuring the expected utility of an uncertain event, which allows considering the importance of a criterion and interactions between criteria during the evaluation process.
Definition 7.
Let f be a measurable function defined on the fuzzy measure space and suppose that f(x1) ≥ f(x2) ≥ ⋯ ≥ f(xn), then the Choquet integral of function f with respect to g can be defined as: 39
3.3. The COPRAS method
The COPRAS technique, initiated by Zavadskas et al. 19, is a compromising method to deal with real MCDM problems 20. Over the past few years, it has been successfully applied to a vast range of decision making problems 40–42.
Assumed that the performance ratings of m alternatives with respect to n criteria are represented as a decision matrix X = [xij]m×n, where xij is the rating of the ith alternative on the jth criterion. Then, the procedure of the COPRAS method is carried out in the following steps 43, 44:
Step 1 Obtain the normalized decision matrix R = [rij]m×n by
Step 2 Calculate the weighted normalized decision matrix
where wj is the weight of the jth criterion andStep 3 Calculate the sum of weighted normalized values for beneficial and cost criteria using the formulas
where k is the number of criteria to be maximized and n-k is the number of criteria to be minimized.Step 4 Determine the relative significances of the alternatives as follows:
Step 5 Calculate the utility degree for each alternative by comparing the priorities of all the alternatives with the most efficient one, i.e.
where Qmax is the maximum relative significance value.
4. The Proposed Model for FMEA
In this section, we introduce a new risk priority model for FMEA based on soft set theory and COPRAS method. The flowchart of the proposed FMEA algorithm is illustrated in Fig. 1.
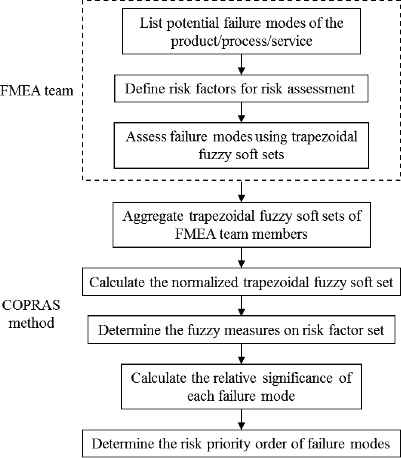
Flowchart of the proposed FMEA model
Suppose that a multidisciplinary FMEA team including l team members TMk (k = 1,2,…, l) has to assess m failure modes FMi (i = 1,2,…, m) based on n risk factors RFj (j = 1,2,…, n). Thus, we can denote the failure mode set by U = {FM1, FM2,…, FMm} and the risk factor set by R = {RF1, RF2,…, RFn}. Each team member TMk is given a weight vk > 0 (k = 1, 2,…, l) satisfying
In what follows, the detail steps of the proposed FMEA approach are summarized.
Step 1 Assess failure modes using trapezoidal fuzzy soft sets
The membership function of a trapezoidal fuzzy number is piecewise linear and trapezoidal, which can cope with the vagueness of assessment information elicited from the FMEA team members via converting them into numerical variables objectively 36. Because of the characteristics of soft sets, the trapezoidal fuzzy soft set is employed in this study to deal with the failure analysis problem within imprecise and vague contexts. For example, the linguistic terms for rating failure modes can be represented by trapezoidal fuzzy numbers as shown in Table 1.
Step 2 Aggregate the trapezoidal fuzzy soft sets of FMEA team members
Let
Based on the TFSHA operator, all individual trapezoidal fuzzy soft sets are aggregated into a collective trapezoidal fuzzy soft set by
whereTherefore, a FMEA problem can be concisely represented by the trapezoidal fuzzy soft set
Step 3 Calculate the normalized trapezoidal fuzzy soft set
According the calculations of trapezoidal numbers in trapezoidal fuzzy soft sets, the normalized trapezoidal fuzzy soft set
whereStep 4 Determine the fuzzy measures on risk factor set
In this step, the concept of fuzzy measures is applied to model the interaction relationships between risk factors. The FMEA team members assign by numerical values ranging from 0 to 1 to reflect their judgements of important degrees of risk factors according to actual situations. These important degrees can be considered as fuzzy densities. Next, based on the collection data of the important degrees, the parameter λ of risk factors can be derived by solving the following polynomial:
Then, according to Equation (6), the fuzzy measures of risk factor set are obtained.
Step 5 Calculate the relative significance of each failure mode
By using the Choquet integral and based on the normalized trapezoidal fuzzy soft set
where (·) indicates a permutation onStep 6 Obtain the risk ranking of all failure modes
The greater the
Besides, to visually assess failure risk, the utility degree Nj can be determined by
where
| Linguistic terms | Trapezoidal fuzzy numbers |
|---|---|
| Absolute Low (AL) | (0, 0, 0, 0) |
| Extremely Low (EL) | (0, 1, 1, 2) |
| Very Low (VL) | (1, 2, 2, 3) |
| Low (L) | (2, 3, 3, 4) |
| Medium Low (ML) | (3, 4, 4, 5) |
| Medium (M) | (3, 4, 6, 7) |
| Medium High (MH) | (5, 6, 6, 7) |
| High (H) | (6, 7, 7, 8) |
| Very High (VH) | (7, 8, 8, 9) |
| Extremely High (EH) | (8, 9, 9, 10) |
| Absolute High (AH) | (9, 10, 10, 10) |
Linguistic variable for rating failure modes
5. Illustrative example
This section presents a concrete example to demonstrate the applicability and feasibility of the proposed new FMEA approach for risk prioritization of failure modes under uncertainty.
5.1. Implementation
This example analyzing the main engine crankcase explosion failure onboard ship is adopted from Ref. 46. Crankcase explosion in marine diesel engines is a frequent failure onboard merchant ship, which might lead to damaging to the ship structure and crew members onboard. Even though great efforts have been maintained to increase the security of diesel engines, crankcase explosion is still the cause of several and even fatal incidents in marine engine operations. Thus, a variety of preventive measures should be taken so as to minimize the incidence of crankcase explosion. In the following, the proposed FMEA is applied to identify the most critical crankcase explosion failure modes for remedial activities. Via brainstorming and based on functional requirements, twelve potential failure modes associated with the crankcase explosion were determined. The FMEA worksheet completed by professional marine engineers is expressed in Table 2.
| Component | Failure mode | Failure effect | Failure cause | O | S | D | RPN |
|---|---|---|---|---|---|---|---|
| Oil mist detector | Inoperable | Oil mist in the crankcase cannot be detected | Wrong calibration of oil mist detector | 2 | 9 | 1 0 |
180 |
| Lack of maintenance | 4 | 9 | 8 | 288 | |||
| Piston | Hole in the piston crown | Transmission of combustion gases into the crankcase | Dripping of fuel valve | 6 | 7 | 8 | 336 |
| Excessive wear on piston flame face | Overheating and excessive pressure into the crank case | Fuel impingement from poor atomization | 7 | 8 | 7 | 392 | |
| Piston ring | Sticking to groove | Excessive clearance, fire blow | Deposits | 6 | 6 | 5 | 180 |
| Stuffing box | Not functioning correctly | Transmission of combustion gas in the combustion chamber into the crankcase | Incorrect spring mounted in piston rod stuffing box | 4 | 1 | 6 | 240 |
| 0 | |||||||
| Wearing out of packing rings | Spark and blow by | Lose of sealing | 6 | 7 | 8 | 336 | |
| Fuel valve | Early opening of fuel valve | Poor atomization and combustion, timing problems, power balance and temperature variations | Service pressure too light | 6 | 7 | 6 | 252 |
| Dripping | Sticking of piston rings in their grooves, fire blow | Oversized injection mechanisms | 7 | 8 | 6 | 336 | |
| Engine performance monitoring system | Not fully functional | Unawareness of abnormal condition in combustion process | Not checking of electronic cards periodically | 2 | 7 | 5 | 70 |
| Main bearing | Failing to lubricate | Friction and excessive heat | Low oil pressure | 3 | 8 | 4 | 96 |
| Crankcase relief valve | Inoperable | Allow air pass into the crankcase | Not appear to perform as designed and not seated correctly | 2 | 7 | 9 | 126 |
FMEA for crankcase explosion in marine diesel engines 40
A FMEA team of five experts from different departments/institutions was established to find out the most important failures to avoid crankcase explosion risk onboard ships. Because it is difficult for the FMEA team members to provide a numerical score for each risk factor of the failure modes, they will evaluate the ratings of failures by employing the linguistic rating term set shown in Table 1 (Step 1). In the risk estimation process, every failure mode is evaluated with respect to the risk factors O, S, and D. The assessments of the twelve failure modes against each risk factor provided by the FMEA team are tabulated in Table 3. The weight vector of the five FMEA team members is determined as v = (0.15, 0.25, 0.20, 0.25, 0.15) because of their different domain expertise and backgrounds. Note that the weights of FMEA team members can be yielded by using direct rating, point allocation, eigenvector method, or Delphi method, etc. together with their domain knowledge 9, 47. If there is no sufficient reason or evidence to show the difference among FMEA team members in their assessment qualities, the experts should be given an equal weight.
| Failure modes | O |
S |
D |
||||||||||||
|---|---|---|---|---|---|---|---|---|---|---|---|---|---|---|---|
| TM1 | TM2 | TM3 | TM4 | TM5 | TM1 | TM2 | TM3 | TM4 | TM5 | TM1 | TM2 | TM3 | TM4 | TM5 | |
| FM1 | VL | EL | VL | L | VL | VH | EH | EH | EH | EH | AH | AH | AH | AH | AH |
| FM2 | ML | ML | ML | ML | ML | EH | AH | EH | VH | EH | VH | VH | VH | VH | VH |
| FM3 | M | MH | MH | MH | MH | H | H | H | VH | H | VH | VH | VH | VH | H |
| FM4 | H | H | H | H | H | VH | VH | VH | VH | VH | H | H | H | H | H |
| FM5 | MH | MH | MH | MH | MH | MH | MH | MH | MH | MH | MH | M | M | M | ML |
| FM6 | L | ML | ML | ML | M | AH | AH | AH | AH | AH | MH | MH | MH | MH | MH |
| FM7 | MH | MH | MH | MH | M | H | H | H | H | MH | H | VH | VH | VH | VH |
| FM8 | MH | MH | MH | MH | MH | H | H | H | H | H | MH | MH | MH | MH | MH |
| FM9 | H | H | H | H | H | H | VH | VH | VH | EH | M | MH | MH | MH | H |
| FM10 | VL | VL | VL | VL | EL | H | H | MH | H | H | M | M | M | M | M |
| FM11 | L | L | L | L | L | VH | VH | VH | VH | VH | ML | ML | M | ML | ML |
| FM12 | VL | VL | VL | VL | VL | H | H | H | H | H | EH | EH | VH | EH | EH |
Linguistic evaluations of failure modes provided by the FMEA team
Then the linguistic evaluations generated by the FMEA team are transformed into trapezoidal fuzzy numbers to form the individual trapezoidal fuzzy soft sets
| U | O | S | D |
|---|---|---|---|
| FM1 | (1, 2, 2, 3) | (7, 8, 8, 9) | (9, 10, 10, 10) |
| FM2 | (3, 4, 4, 5) | (8, 9, 9, 10) | (7, 8, 8, 9) |
| FM3 | (3, 4, 6, 7) | (6, 7, 7, 8) | (7, 8, 8, 9) |
| FM4 | (6, 7, 7, 8) | (7, 8, 8, 9) | (6, 7, 7, 8) |
| FM5 | (5, 6, 6, 7) | (5, 6, 6, 7) | (5, 6, 6, 7) |
| FM6 | (2, 3, 3, 4) | (9, 10, 10, 10) | (5, 6, 6, 7) |
| FM7 | (5, 6, 6, 7) | (6, 7, 7, 8) | (6, 7, 7, 8) |
| FM8 | (5, 6, 6, 7) | (6, 7, 7, 8) | (5, 6, 6, 7) |
| FM9 | (6, 7, 7, 8) | (6, 7, 7, 8) | (3, 4, 6, 7) |
| FM10 | (1, 2, 2, 3) | (6, 7, 7, 8) | (3, 4, 6, 7) |
| FM11 | (2, 3, 3, 4) | (7, 8, 8, 9) | (3, 4, 4, 5) |
| FM12 | (1, 2, 2, 3) | (6, 7, 7, 8) | (8, 9, 9, 10) |
The trapezoidal fuzzy soft set of TM1
| U | O | S | D |
|---|---|---|---|
| FM1 | (0.938, 1.875, 1.875, 2.813) | (7.916, 8.916, 8.916, 9.916) | (9, 10, 10, 10) |
| FM2 | (3, 4, 4, 5) | (7.844, 8.844, 8.844, 9.704) | (7, 8, 8, 9) |
| FM3 | (4.832, 5.832, 6, 7) | (6.14, 7.14, 7.14, 8.14) | (6.916, 7.916, 7.916, 8.916) |
| FM4 | (6, 7, 7, 8) | (7, 8, 8, 9) | (6, 7, 7, 8) |
| FM5 | (5, 6, 6, 7) | (5, 6, 6, 7) | (3.355, 4.355, 5.832, 6.832) |
| FM6 | (2.916, 3.916, 4.271, 5.271) | (9, 10, 10, 10) | (5, 6, 6, 7) |
| FM7 | (4.832, 5.832, 6, 7) | (5.916, 6.916, 6.916, 7.916) | (6.916, 7.916, 7.916, 8.916) |
| FM8 | (5, 6, 6, 7) | (6, 7, 7, 8) | (5, 6, 6, 7) |
| FM9 | (6, 7, 7, 8) | (7.094, 8.094, 8.094, 9.094) | (5.01, 6.01, 6.177, 7.177) |
| FM10 | (0.916, 1.916, 1.916, 2.916) | (5.696, 6.696, 6.696, 7.696) | (3, 4, 6, 7) |
| FM11 | (2, 3, 3, 4) | (7, 8, 8, 9) | (3, 4, 4.607, 5.607) |
| FM12 | (1, 2, 2, 3) | (6, 7, 7, 8) | (7.696, 8.696, 8.696, 9.696) |
The collective trapezoidal fuzzy soft set
| U | O | S | D |
|---|---|---|---|
| FM1 | (0.117, 0.234, 0.234, 0.352) | (0.792, 0.892, 0.892, 0.992) | (0.900, 1.000, 1.000, 1.000) |
| FM2 | (0.375, 0.500, 0.500, 0.625) | (0.784, 0.884, 0.884, 0.970) | (0.700, 0.800, 0.800, 0.900) |
| FM3 | (0.604, 0.729, 0.750, 0.875) | (0.614, 0.714, 0.714, 0.814) | (0.692, 0.792, 0.792, 0.892) |
| FM4 | (0.750, 0.875, 0.875, 1.000) | (0.700, 0.800, 0.800, 0.900) | (0.600, 0.700, 0.700, 0.800) |
| FM5 | (0.625, 0.750, 0.750, 0.875) | (0.500, 0.600, 0.600, 0.700) | (0.335, 0.435, 0.583, 0.683) |
| FM6 | (0.365, 0.490, 0.534, 0.659) | (0.900, 1.000, 1.000, 1.000) | (0.500, 0.600, 0.600, 0.700) |
| FM7 | (0.604, 0.729, 0.750, 0.875) | (0.592, 0.692, 0.692, 0.792) | (0.692, 0.792, 0.792, 0.892) |
| FM8 | (0.625, 0.750, 0.750, 0.875) | (0.600, 0.700, 0.700, 0.800) | (0.500, 0.600, 0.600, 0.700) |
| FM9 | (0.750, 0.875, 0.875, 1.000) | (0.709, 0.809, 0.809, 0.909) | (0.501, 0.601, 0.618, 0.718) |
| FM10 | (0.115, 0.240, 0.240, 0.365) | (0.570, 0.670, 0.670, 0.770) | (0.300, 0.400, 0.600, 0.700) |
| FM11 | (0.250, 0.375, 0.375, 0.500) | (0.700, 0.800, 0.800, 0.900) | (0.300, 0.400, 0.461, 0.561) |
| FM12 | (0.125, 0.250, 0.250, 0.375) | (0.600, 0.700, 0.700, 0.800) | (0.770, 0.870, 0.870, 0.970) |
The normalized trapezoidal fuzzy soft set
In Step 4, the fuzzy measure of each risk factor is obtained through a survey questionnaire accomplished by the FMEA team members. Then, the λ value is derived by solving the polynomial Equation (16). The λ value and the fuzzy measures g(·) are shown in Table 7. The value represents that there is a substitutive effect among the three risk factors O, S and D.
| Fuzzy measures g(·) | λ = -0.452 | |
|---|---|---|
| g({O}) = 0.4 | g({O, S}) = 0.8 | |
| g({S}) = 0.5 | g({O, D}) = 0.6 | g({O, S, D}) = 1 |
| g({D}) = 0.3 | g({S, D}) = 0.7 | |
Fuzzy measures g(·) of each risk factor and risk factor combination
Using the obtained g(·) and the normalized trapezoidal fuzzy soft set
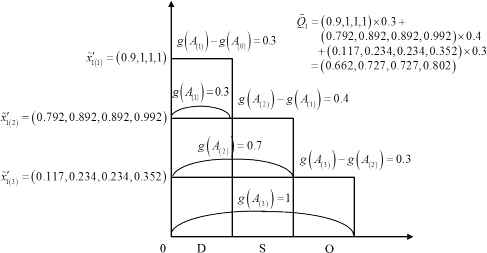
Fuzzy integral calculation for the relative significance of FM1
| Failure modes |
|
|
Ni | Ranking |
|---|---|---|---|---|
| FM1 | (0.622, 0.727, 0.727, 0.802) | 0.717 | 88.51% | 7 |
| FM2 | (0.645, 0.752, 0.752, 0.853) | 0.750 | 92.58% | 4 |
| FM3 | (0.634, 0.742, 0.748, 0.856) | 0.745 | 91.97% | 5 |
| FM4 | (0.700, 0.810, 0.810, 0.920) | 0.810 | 100.00% | 1 |
| FM5 | (0.517, 0.627, 0.657, 0.767) | 0.642 | 79.24% | 9 |
| FM6 | (0.659, 0.767, 0.780, 0.838) | 0.757 | 93.51% | 3 |
| FM7 | (0.625, 0.733, 0.739, 0.847) | 0.736 | 90.86% | 6 |
| FM8 | (0.590, 0.700, 0.700, 0.810) | 0.700 | 86.42% | 8 |
| FM9 | (0.684, 0.794, 0.797, 0.907) | 0.796 | 98.22% | 2 |
| FM10 | (0.379, 0.487, 0.527, 0.634) | 0.507 | 62.55% | 12 |
| FM11 | (0.485, 0.593, 0.605, 0.712) | 0.599 | 73.90% | 11 |
| FM12 | (0.508, 0.616, 0.616, 0.723) | 0.616 | 76.04% | 10 |
Results obtained by the proposed approach
In Step 6, according to the COA method, the trapezoidal fuzzy numbers
5.2. Sensitivity analysis
To illustrate the reflection of the interactions between risk factors in the risk prioritization process, we perform a sensitivity analysis on the parameter λ in this section. The ranking results from the sensitivity analysis are illustrated in Fig. 3.
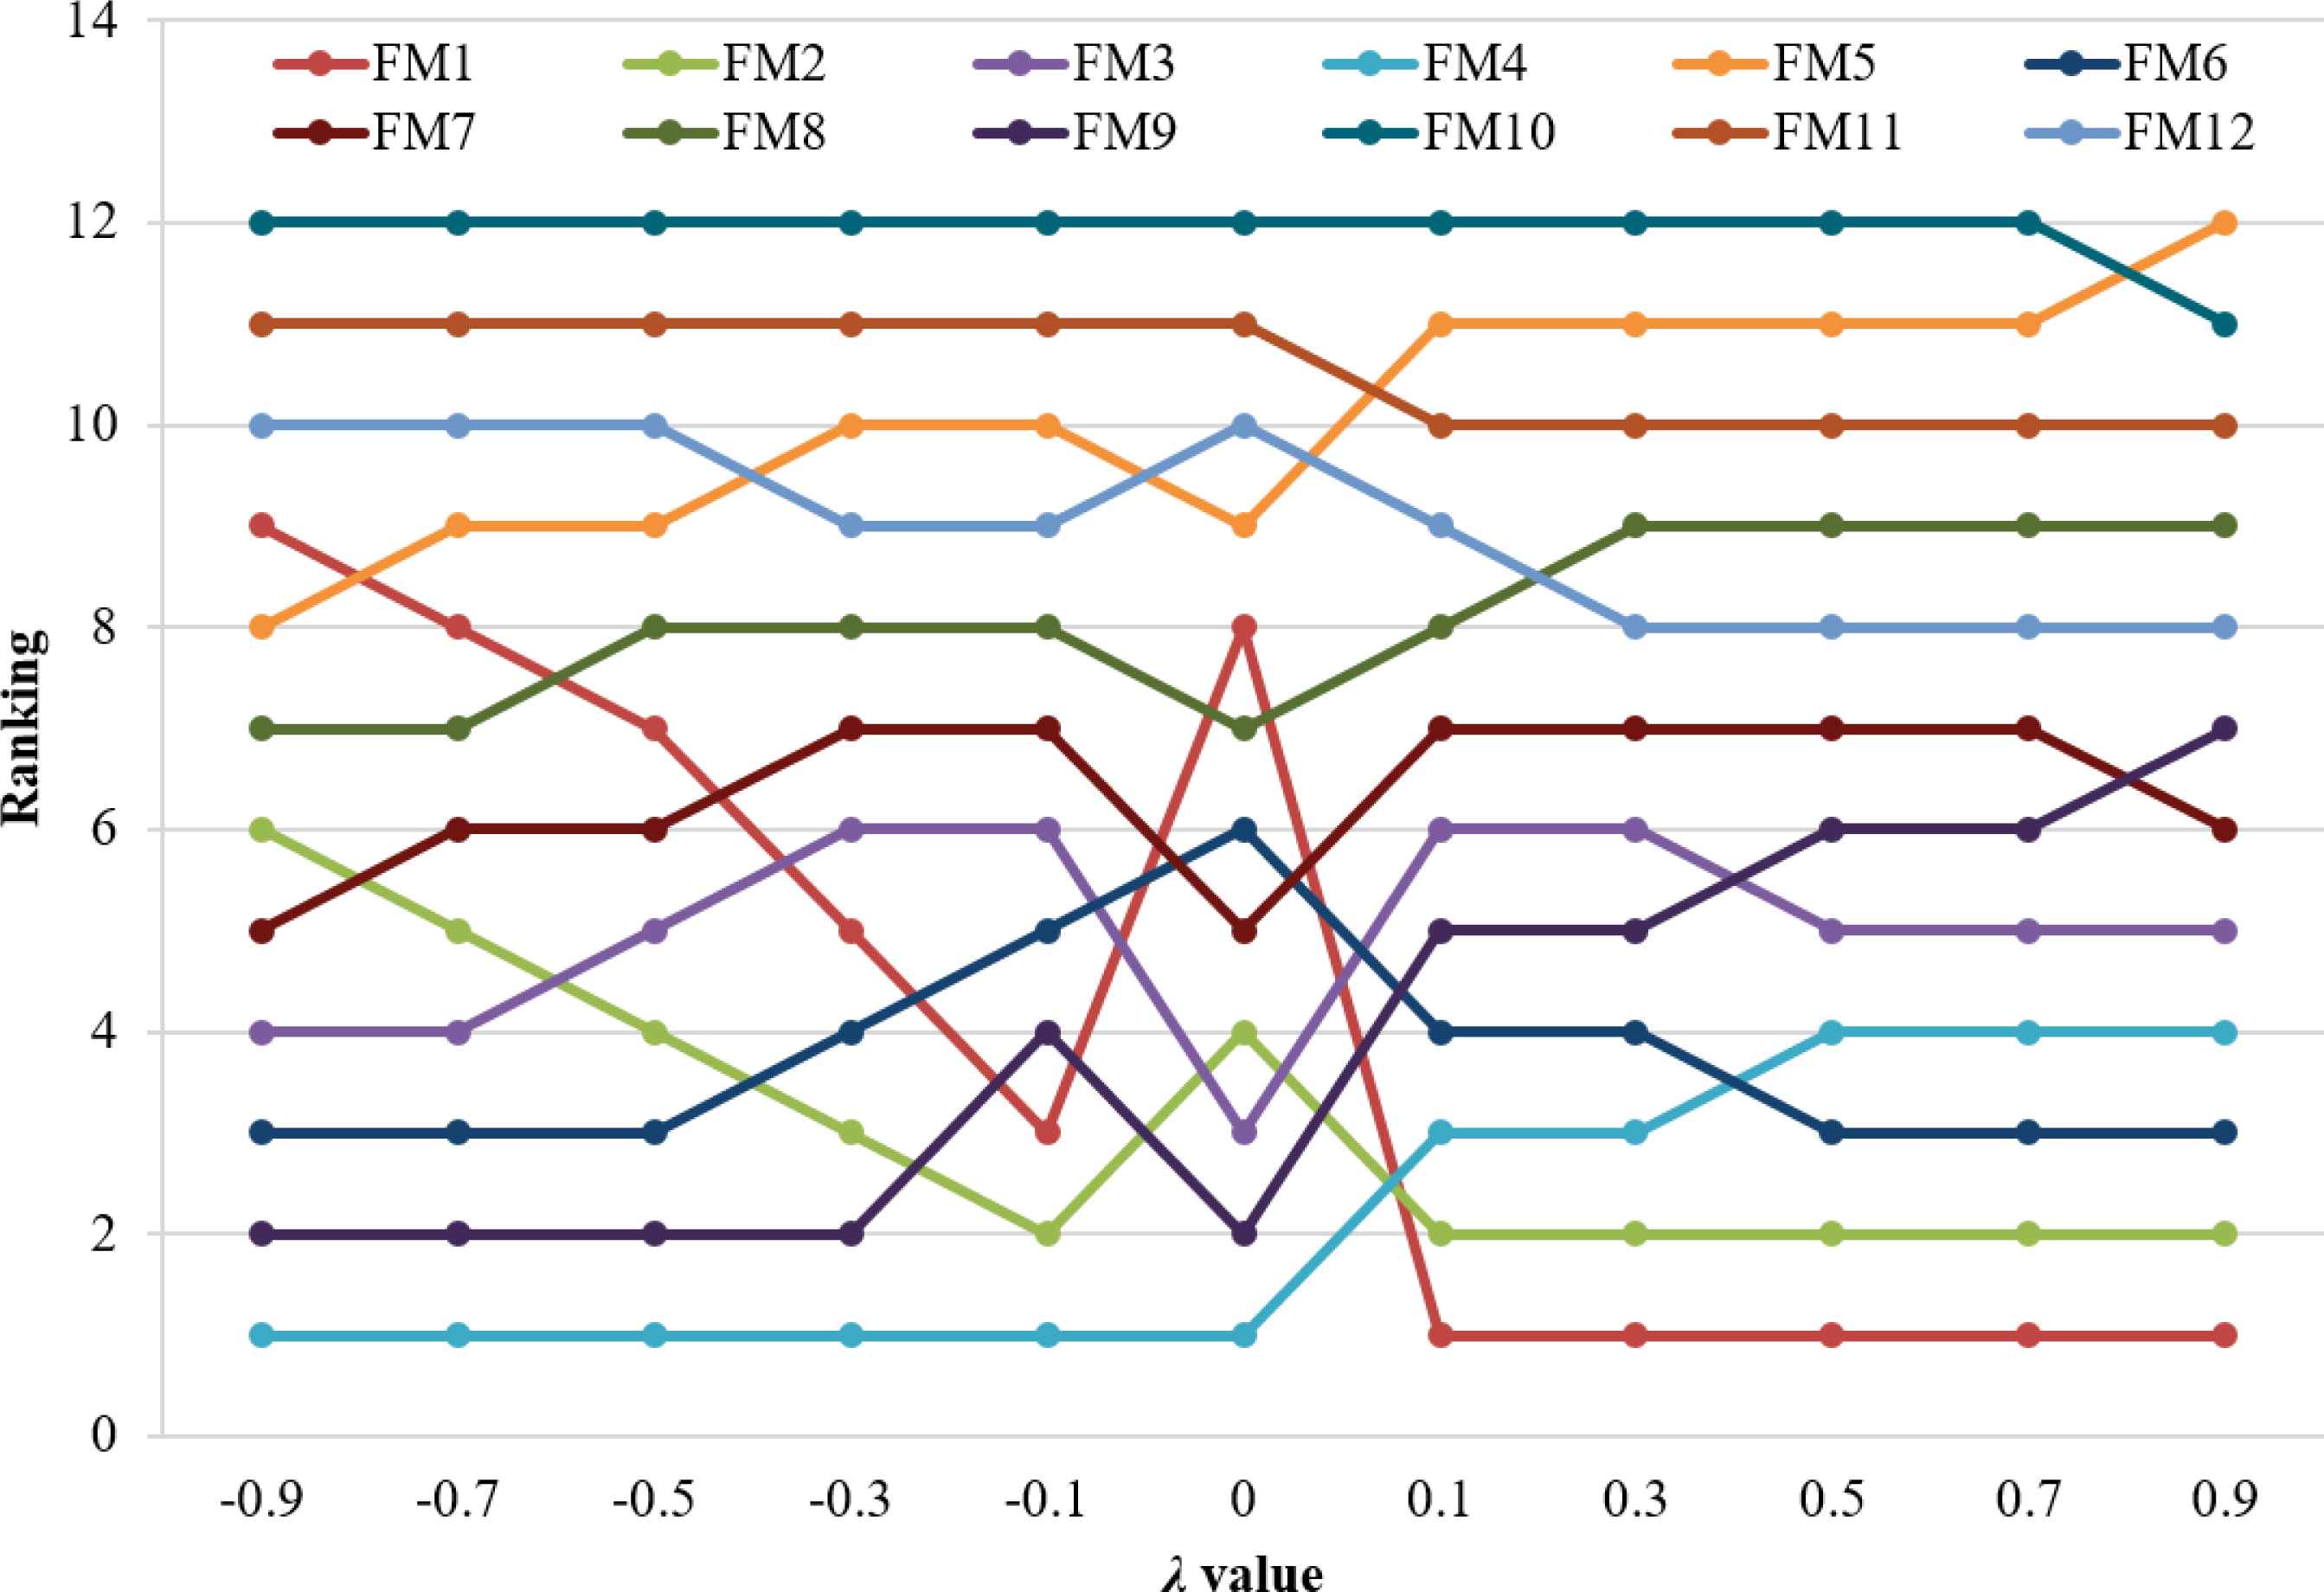
Results of the sensitivity analysis
As depicted in Fig. 3, the final priority orders of the failure modes are indeed influenced by changing the fuzzy measure λ. This means that the risk priorities of these failures are different in terms of the dependence degrees between risk factors. For example, the ranking of FM1 was improved according to increase of λ value. This fact reveals that FM1 has higher level of risk when there exist multiplicative effect between risk factors. Also, the ranking of FM4 was high when the λ value was small, indicating that it scored high risk level when the risk factors have substitutive effect.
On the other hand, the influence of risk factor interaction introduced in the proposed FMEA approach can be evidently seen in the risk rank ordering derived when the parameter λ is 0. It is quite different from the risk rankings based on the interdependence among risk factors. Thus, incorporating the interaction among risk factors in FMEA is of great importance and benefit to the risk estimation of failure modes and the following risk reduction action plans.
5.3. Comparative discussion
For further evaluating the effectiveness of the FMEA approach being proposed, the RPN method, which was used by Cicek and Celik 46, the crisp COPRAS and the fuzzy VIKOR 48 are applied into the example given above. Table 9 displays the risk ranking results of the twelve failure modes as determined by these methods.
| Failure modes | RPN method | Crisp COPRAS | Fuzzy VIKOR | Proposed approach |
|---|---|---|---|---|
| FM1 | 8 | 8 | 5 | 8 |
| FM2 | 5 | 5 | 3 | 4 |
| FM3 | 2 | 3 | 7 | 3 |
| FM4 | 1 | 1 | 2 | 1 |
| FM5 | 8 | 9 | 10 | 9 |
| FM6 | 7 | 6 | 1 | 6 |
| FM7 | 2 | 3 | 8 | 5 |
| FM8 | 6 | 7 | 9 | 7 |
| FM9 | 2 | 2 | 4 | 2 |
| FM10 | 12 | 12 | 12 | 12 |
| FM11 | 11 | 11 | 6 | 11 |
| FM12 | 10 | 10 | 11 | 10 |
Ranking comparison
From Table 9, it can be observed that the top two and the last three ranks of failure modes remain the same by utilizing the proposed approach and the conventional RPN method. This validates the effectiveness of our proposed FMEA. But there still exist some differences between the risk priority rankings obtained by the two methods. These inconsistencies can be explained by the drawbacks of the traditional FMEA. For example, the two failure modes FM1 and FM5 are determined as the same order via the RPN method. However, when the proposed approach is applied, the relative significances of FM1 and FM5 are different, i.e.
Second, the risk ranking result of the proposed model is almost in agreement with the crisp COPRAS method. But the risk of the two failure modes FM3 and FM4 cannot be distinguished according to the crisp COPRAS. Besides, in accordance with the crisp COPRAS, FM7 is taken to be more important than FM2. However, the result obtained using the proposed FMEA shows that FM2 has a higher priority than FM7, which is also collated by the fuzzy VIKOR method. The reason is that for the soft COPRAS, the vagueness of risk assessments and risk factor interdependency are taken into account simultaneously. Therefore, the risk ranking by the proposed model is more reasonable than that using the crisp COPRAS to some extent.
The last comparative analysis was carried out with the fuzzy VIKOR method. It is easy to see from Table 9 that there exist many differences between the two sets of risk ordering of failure modes. Except for FM10, the risk priority orders of other failure modes determined by the proposed FMEA are different from those acquired by the fuzzy VIKOR. Particularly, FM4 is regarded as the most critical failure in the proposed soft COPRAS method. However, FM3 ranks at the second place and FM6 turns out to be the most serious failure mode when the fuzzy VIKOR is applied. The explanations of the inconsistent ranking results are that the ranking mechanisms of the two methods are different and the interdependency of risk factors is not considered in the fuzzy VIKOR method. These lead to the lack of precision in the final risk ranking results when the fuzzy VIKOR is applied.
The comparative analyses above show that the risk ranking result determined by the proposed FMEA approach is more reasonable and credible. Moreover, trapezoidal fuzzy soft sets can handle the vague and ambiguous risk assessment information by using linguistic variables. This make the risk analysis based on soft set theory be more preferable to reflect the reality. More importantly, subtle difference between failure modes can be identified effectively by employed the COPRAS method. Via the proposed FMEA, we can obtain more useful information for assisting risk management decision making. Therefore, we can confirm that the proposed risk priority model based on soft set theory and COPRAS method is very promising to deal with the risk evaluation problem in FMEA.
6. Conclusions
This paper has introduced a new approach to FMEA by integrating soft set theory and COPRAS method which can deal with the flaws and improve the effectiveness of the traditional FMEA. First, trapezoidal fuzzy soft sets are used to describe the fuzzy risk assessments of FMEA team members and reflect their uncertainty and ambiguity. An extended COPRAS method is then employed to derive the ranking orders of failure modes. Furthermore, the interactive relationships among risk factors are incorporated into the criticality analysis based on the Choquet integral. Finally, we applied the proposed FMEA to a case study concerning crankcase explosion in marine diesel engines to demonstrate its applicability and effectiveness. According to the concrete example, it can be concluded that the proposed risk priority model can recognize linguistic terms to handle vague or imprecise risk assessment information effectively, as well as formulate an accurate and reasonable risk priority ranking of the failure modes in FMEA.
The framework proposed in this paper is promising for risk evaluation in FMEA; in the future, it can be applied to many other failure assessment and risk analysis problems to improve the safety and reliability of products, processes, designs and services. In addition, other types of soft sets, such as trapezoidal interval type-2 fuzzy soft sets, intuitionistic fuzzy soft sets, and hesitant fuzzy soft sets, can be introduced into FMEA to deal with the vague assessment information of failure modes. Accordingly, further research can combine other uncertainty theories with the COPRAS method to effectively address the vagueness of input data and failure risk prioritization in FMEA.
Acknowledgements
The authors are very grateful to the editor and anonymous referees for their insightful and valuable comments. This work was partially supported by the National Natural Science Foundation of China (Nos. 71671125 and 71402090), the NSFC Key Program (No. 71432007), and the Program for Professor of Special Appointment (Young Eastern Scholar) at Shanghai Institutions of Higher Learning (No. QD2015019).
Footnotes
References
Cite this article
TY  - JOUR
AU  - Ze-Ling Wang
AU  - Jian-Xin You
AU  - Hu-Chen Liu
AU  - Song-Man Wu
PY  - 2017
DA  - 2017/07/13
TI  - Failure Mode and Effect Analysis using Soft Set Theory and COPRAS Method
JO  - International Journal of Computational Intelligence Systems
SP  - 1002
EP  - 1015
VL  - 10
IS  - 1
SN  - 1875-6883
UR  - https://doi.org/10.2991/ijcis.2017.10.1.67
DO  - 10.2991/ijcis.2017.10.1.67
ID  - Wang2017
ER  -