
Performance Evaluation of Data Migration Policies for a Distributed Storage System with Dynamic Tiering
- DOI
- 10.2991/ijndc.k.191115.001How to use a DOI?
- Keywords
- Distributed storage system; storage tiering; block relocation; performance evaluation
- Abstract
We have proposed a distributed storage system which autonomously migrates data blocks into a suitable storage node by considering their access frequency and read/write ratio. In this paper, we show that revised data migration policies can rapidly distribute input/output (I/O) hot spot over the storage nodes and can improve I/O performance of the entire system. Our simulation results show that the proposed method can reduce I/O execution time around 26% than the previous one at the maximum.
- Copyright
- © 2019 The Authors. Published by Atlantis Press SARL.
- Open Access
- This is an open access article distributed under the CC BY-NC 4.0 license (http://creativecommons.org/licenses/by-nc/4.0/).
1. INTRODUCTION
Recent years, even client nodes can easily have enough storage area owing to the spread of inexpensive storage devices. In many cases, the large amount of an unused storage area is left on storage devices over the network. It is important to utilize such fragmented unused storage area. Hence, we have for our object to build an environment which not only file servers but also client nodes can provide their surplus storage area as public storage. However, such computing environment has essentially heterogeneity. The heterogeneity of the system causes difficulty for properly allocating data blocks onto the storage devices. We consider that system heterogeneity is brought by even a dynamic aspect. It means that both a static aspect (e.g. differences of hardware configuration) and a dynamic aspect (e.g. imbalance of I/O workload) make such heterogeneity. This dynamic heterogeneity is not able to be solved statically. Therefore, data blocks should be located on a suitable storage device according to their access patterns at runtime. For example, frequently accessed data blocks are better to locate on high-performance storage, and it may cause no inconvenience when rarely accessed data blocks are located on low-performance storage. However, such location optimization in accordance with access patterns of data blocks makes the burden too heavy for system administrators.
We have proposed a distributed storage system which migrates a data block autonomously to a suitable storage device [1]. In our storage system, each storage node which provides public storage area monitors other storage nodes and migrates a data block to more proper storage node if necessary.
In our system, because data migration is performed over the network, the cost of migration is unignorable. The inefficient migration should be avoided to the utmost in order to prevent to disturb activity of the other network nodes or to consume extra processing power for the migration. Our investigation clarifies that the migration effect is excessively limited because of avoiding overconcentration to a specific storage node. It might degrade I/O performance, especially in a large system. In our previous work [2], we proposed an improved method of data migration aims to enhance migration efficiency in a large distributed storage system. However, our subsequent investigations show that aggressive data migration prevents performance improvement in certain cases. Accordingly, we propose a further improved method to refrain from data migration causes an excessive degradation of I/O performance.
The rest of this paper is organized as follows. First, we present related work in Section 2. Section 3 describes a summary of the autonomous distributed storage system which has been proposed in our previous works. Section 4 provides details of revised migration policies to improve migration efficiency. In Section 5, we show the results of experiments and the considerations. Finally, we conclude this paper in Section 6.
2. RELATED WORK
Easy Tier [3] and Fully Automated Storage Tiering [4] are commercial storage tiering systems implemented for storage server products. They support up to three storage tiers which are statically classified by device technology. Btier [5] is a block device with automatic migration for Linux kernel. In Btier, though the arbitrary numbers of storage tiers can be made, most systems use only two tiers, such as an Solid State Drive (SSD) tier and an Hard Disk Drive (HDD) tier, to save administrators’ effort. In those practical systems, they mainly focus that which data should be migrated to which storage tier.
Hystor [6] and On-The-Fly Automated Storage Tiering [7] provide automated data migration function. They perform data migration between statically defined two storage tiers, SSD and HDD. Cost Effective Storage [8] also proposed storage with dynamic tiering. It focuses on configuring a system with the optimal number of devices per storage tier to achieve performance goals at minimum cost. Lipetz et al. [9] proposed an automated tiering using three storage tiers, SSD, performance-oriented HDD, and inexpensive HDD. They are designed for a stand-alone storage server, and data migration is concluded only inside the server. In those systems, because there is no need to consider the influence on the network and the other network nodes, the impact of overhead for data migration is less than a distributed storage system.
3. AUTONOMOUS DISTRIBUTED STORAGE SYSTEM
3.1. Classification of Network Nodes
We assume that all the network nodes are under the control of one administration group.
In our storage system, network nodes are classified as the following two types, the storage node, and the client node. Figure 1 shows a classification of network nodes in the assumed environment. We refer the network node which has a public storage area as the storage node, and the node which remotely mounts that storage area as the client node. Some storage nodes which access to remote storage also act as client nodes.
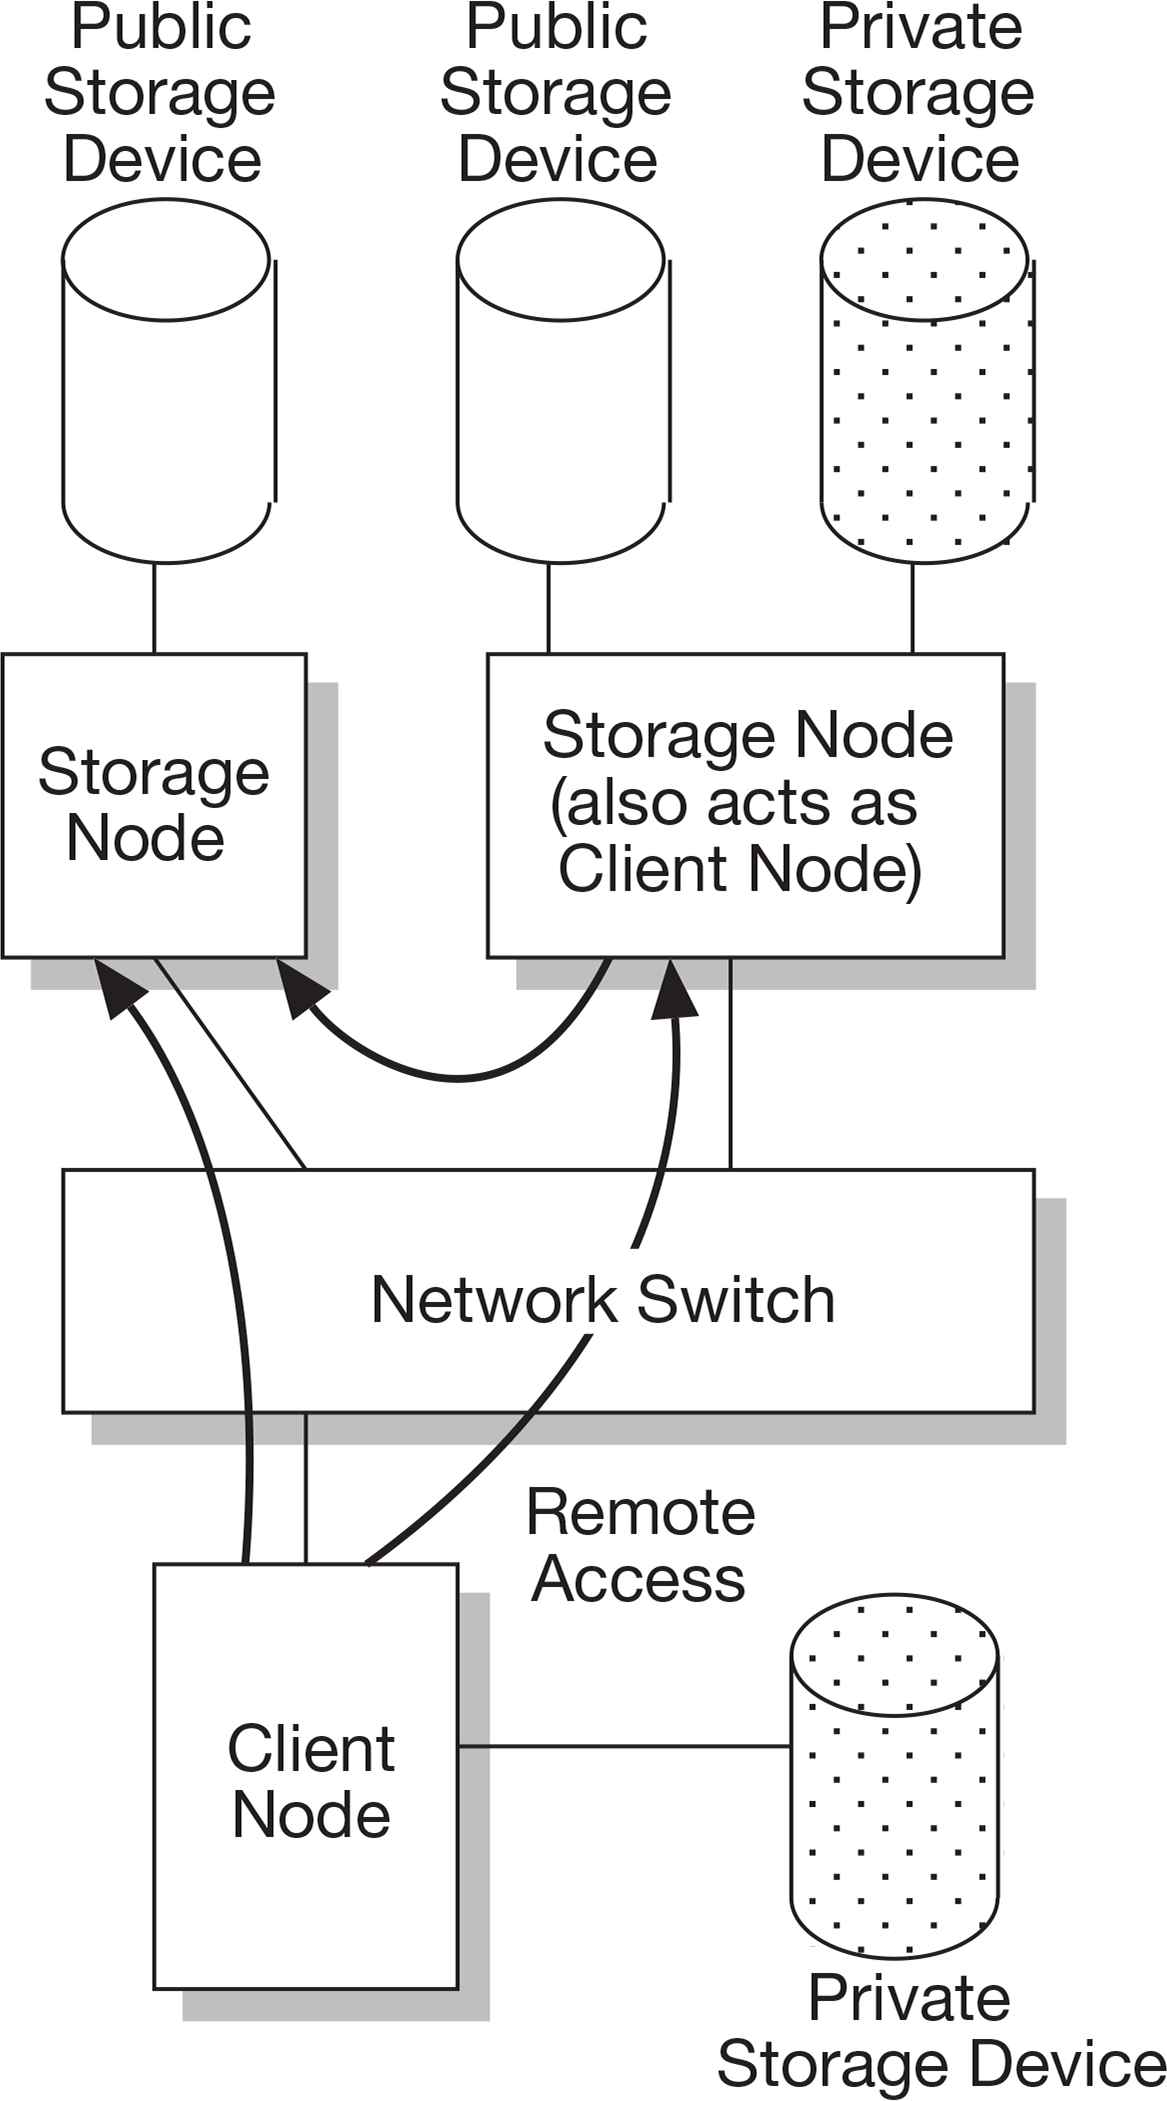
A classification of network nodes.
Each storage node periodically exchanges its current status by using a small data structure named storage information [10]. Figure 2 shows the structure of storage information segment [11]. In Figure 2, the third field represents the available storage space in megabytes. The two throughput fields represent the effective throughput and are expressed in megabytes per second. The storage information has total of 16 bytes length.
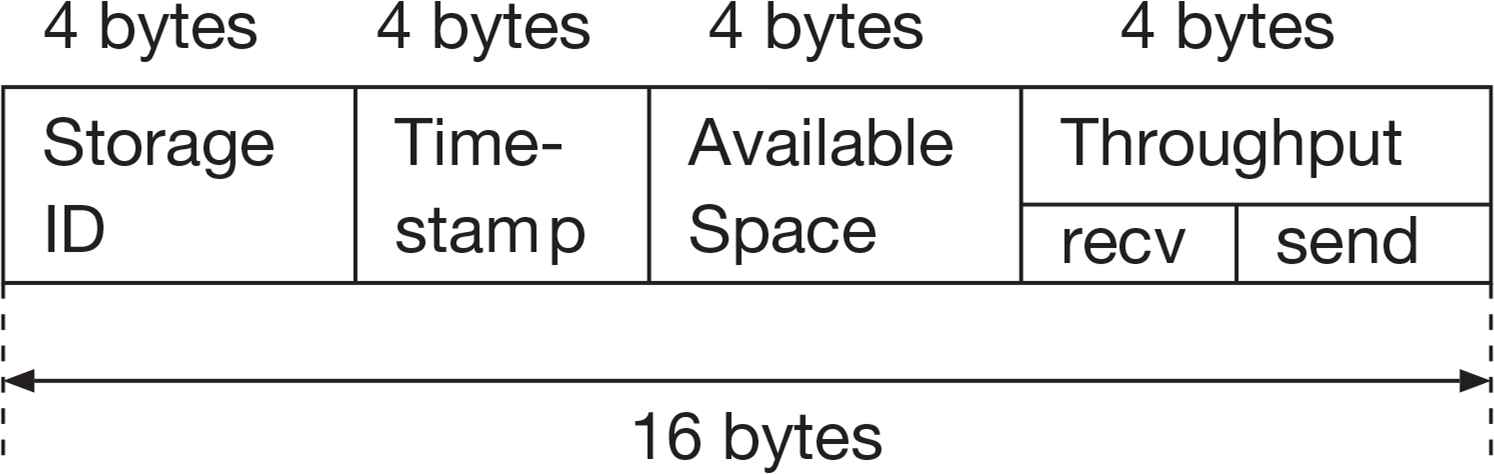
Structure of storage information segment.
We also showed a scheme to reduce network traffic for exchanging the storage information in the Storage Area Network environment which is using the Internet Small Computer System Interface (iSCSI) [12] protocol. Our observations [11] indicated that short packets about 100 bytes length are frequently transmitted in the iSCSI environment. It is because the iSCSI protocol is based on the SCSI protocol designed for a non-packet environment. In other words, there is a large gap between the data size using for iSCSI protocol and transmittable data size in the IP network. Accordingly, we proposed a scheme that plural segments of the storage information are appended to an Ethernet jumbo frame [13] including iSCSI packet up to the size of the Maximum Transfer Unit. Our previous investigations [10] show that sufficient capacity in such an Ethernet frame can be used for transmitting the storage information. Thus because of reducing the number of dedicated frames for the propagation of the storage information, we can share the status of storage nodes with low network overhead.
3.2. Storage Tiering
To locate data blocks into the proper storage node, storage nodes are first ranked according to their effective performance [14]. The effective performance of a storage node is calculated by unifying its reading and writing performance according to reading and writing ratio of accessing by a client node and is also reflected the influence of the performance drop caused by access concentration. Next, the ranked storage nodes are stratified as storage tiers. The storage nodes which have a near level of performance of the migration source node are recognized as belonging in the same storage tier.
Figure 3 shows an example of ranking five storage nodes. In this figure, initiator storage denotes the node which intends to initiate a data block migration. In Figure 3a, the vertical and the horizontal axes are writing and reading performance of the storage nodes, respectively. The foot of a perpendicular from a plot of a storage node to a line of ranking direction shows the unified performance of the storage. In the case of the frequency of the reading and the writing operation to a data block is identical, the slope of ranking direction is set to 1. If you prefer to migrate a data block which has read intensive access pattern, the slope of ranking direction should be set as lower than 1. The unified performance of a storage node will be plotted on the straight line like Figure 3b, and it is used for ranking the storage nodes.
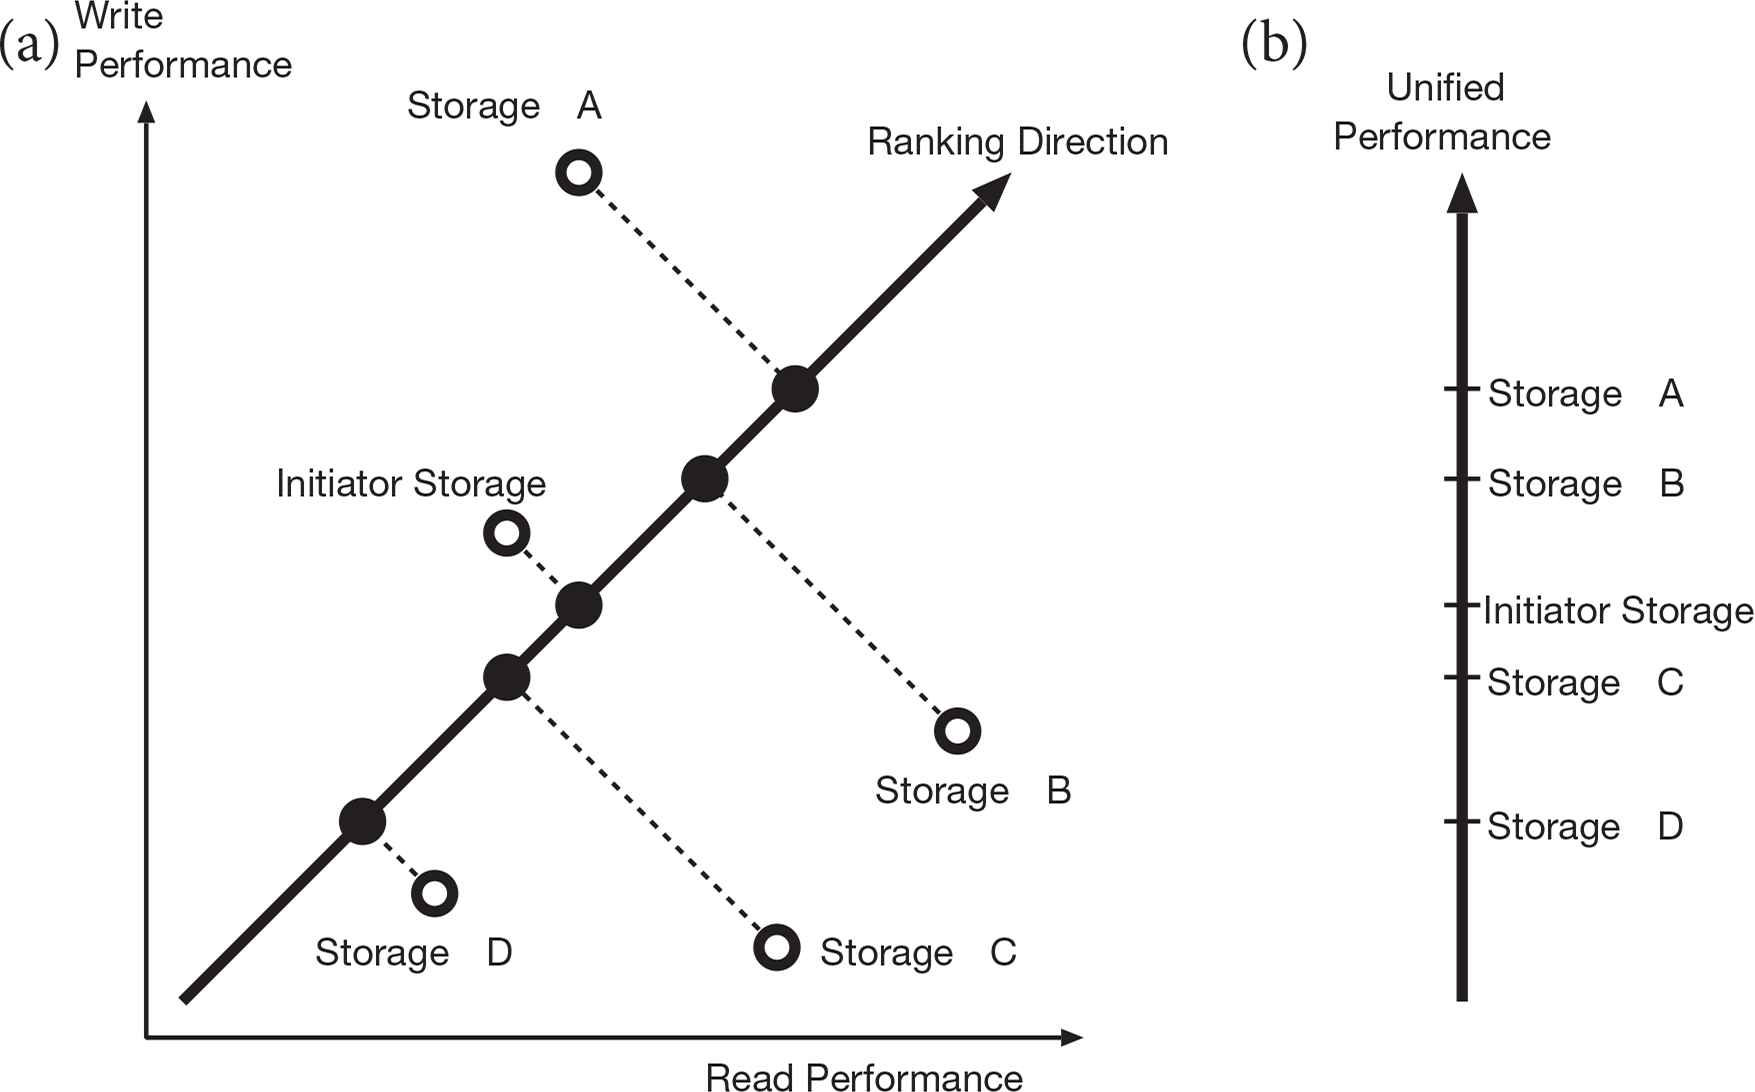
An example of ranking storage nodes. (a) Storage property in read and write performance. (b) Storage rank in linear scale.
After ranking the storage nodes, the migration source node makes storage tiers. The migration source node regards the storage node having the performance exceeding a threshold Th as belonging to the upper storage tier. Similarly, the storage node having the performance less than a threshold Tl is regarded as belonging to the lower storage tier. The threshold values, Th and Tl, are led by using statically defined tiering parameter p(0 ≤ p ≤ 1). The parameter p is set by a system administrator to prevent ineffectual data migration to a nearly same performance destination node considering migration overhead in the target system. Th and Tl are defined by Equations (1) and (2).
The migration source node set the lowermost node in the upper storage tier as the migration destination in order to moderate overconcentration of the data migration to a few storage nodes.
When the amount of storage used is nearing its maximum capacity of the storage node, it will initiate data migration to keep certain free space. The uppermost node in the lower storage tier is set as the migration destination in order to mitigate sudden performance drop.
4. IMPROVEMENT OF MIGRATION EFFICIENCY
As stated in the previous section, the data block migration is performed in a conservative manner. This policy helps to prevent that frequently accessed data blocks concentrate to a specific storage node. However, it might defer a spreading speed of data blocks to be migrated. For example, in the environment which has a large number of storage nodes, there might be a lot of destination candidate nodes in the upper or lower storage tier. When a migration source node has an extremely frequently accessed data block, the block should be migrated to as higher performance node as it can. If the performance improvement by a data migration is limited by the tiering parameter p, the performance gain expected by a migration might be insufficient. This may cause a series of data block migration and increase network traffic.
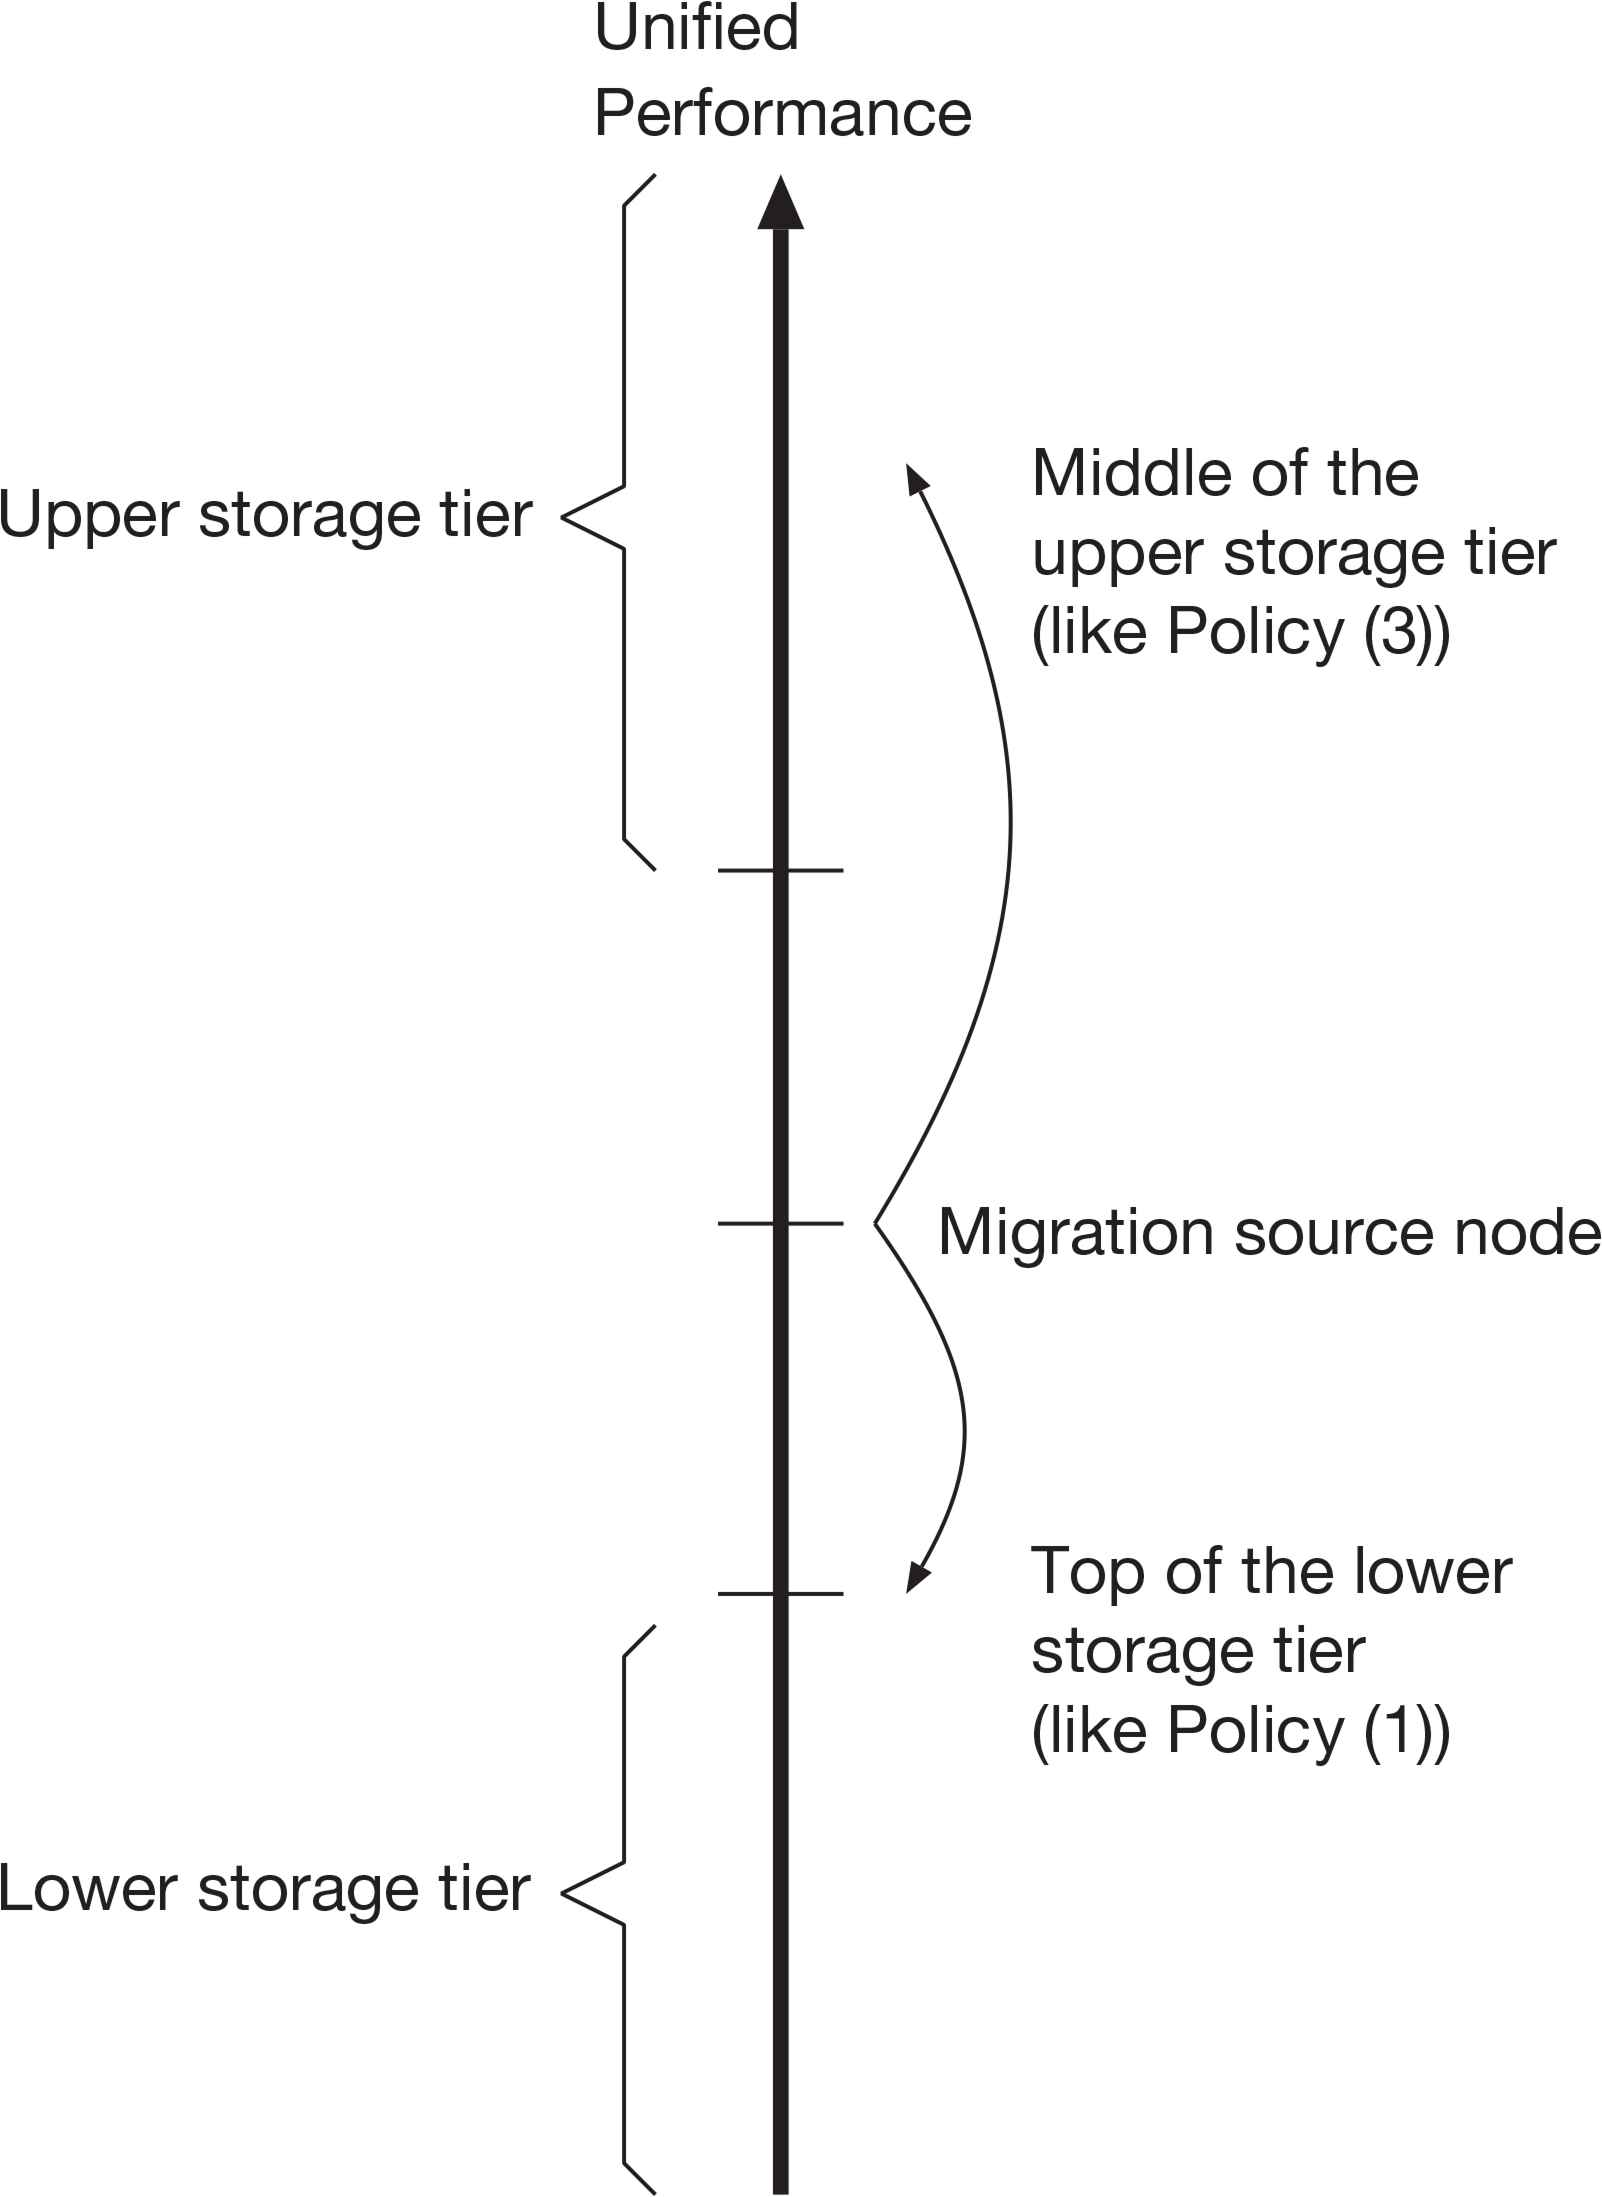
We revise a part of migration strategy to enhance an effect of the data block migration. Figure 4 shows three policies for migrating a data block to the upper storage tier.
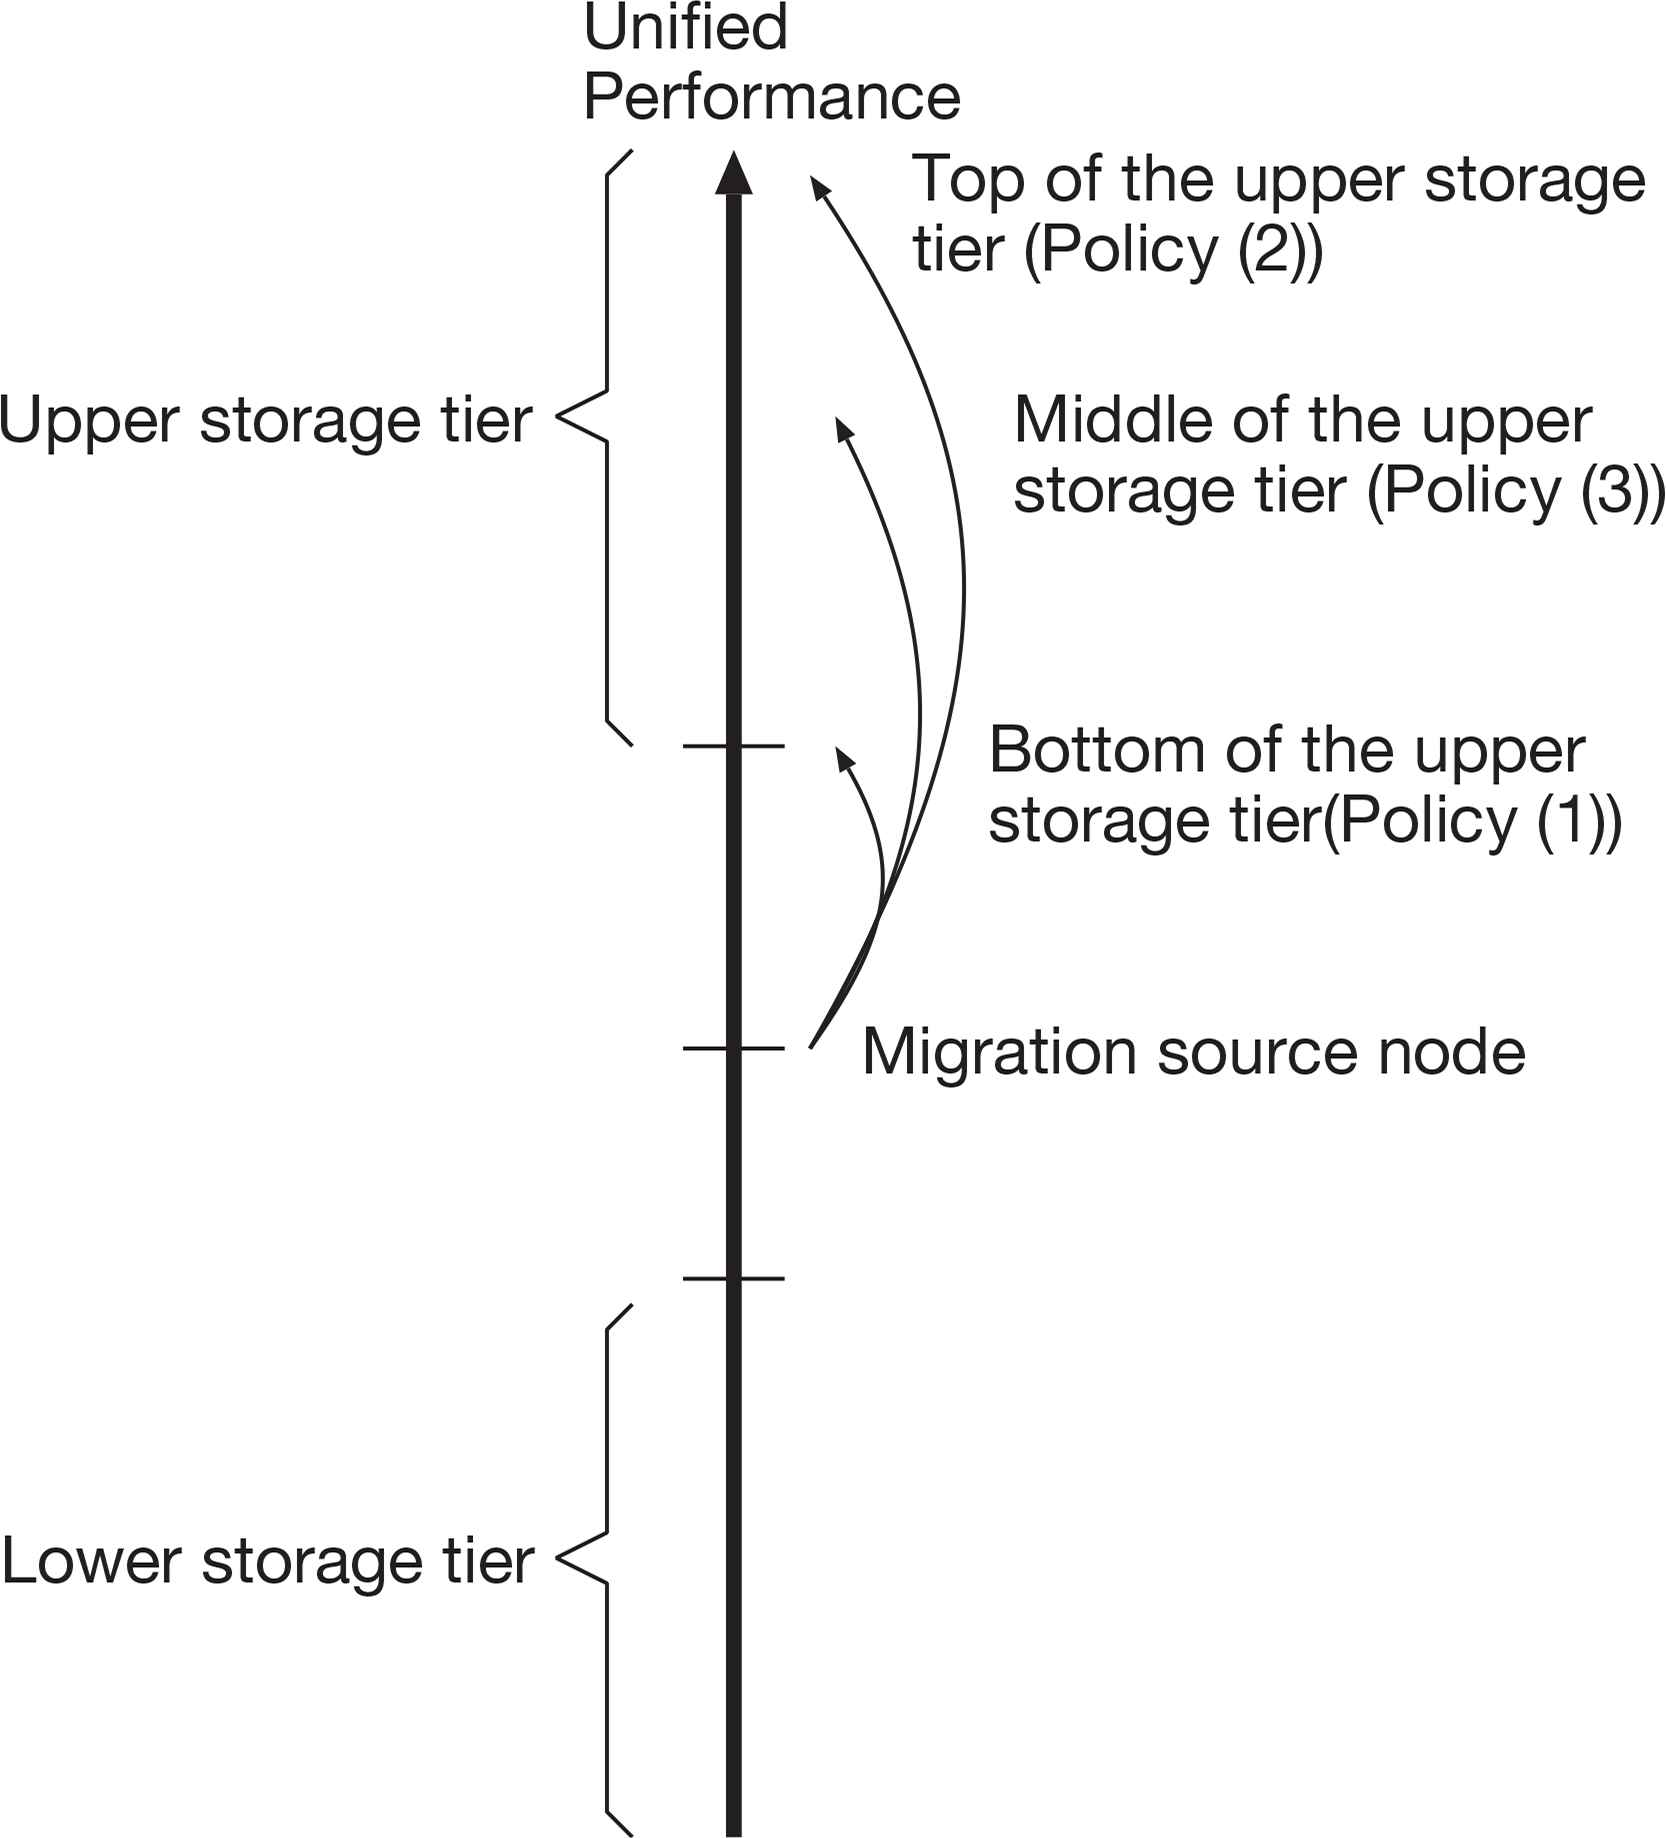
Three migration policies to the upper storage tier.
4.1. Policy (1): Original Migration Policy
Policy (1) is the original one presented by our previous work [14]. The lowermost storage node in the upper storage tier or the topmost storage node in the lower storage tier will be selected as the destination by this policy. A destination of data migration will be able to be highly dispersed in this policy. However, when a storage node migrates a data block to the upper storage node, the estimated performance gain is limited by the threshold Th. Especially, when there is a number of storage nodes in the upper tier, it may lose an opportunity of much improvement in performance.
4.2. Policy (2): Most Aggressive Migration Policy
Policy (2) is the most aggressive data migration. If a storage node migrates a data block to the upper storage tier, the migration source node chooses the top storage node in the upper storage tier as the destination. In data migration to the upper storage tier, although the estimated improvement of performance reaches the maximum, the I/O workload may be concentrated on the specific storage node. If a storage node migrates a data block to the lower storage tier, the migration source node chooses the bottom storage node in the lower storage tier as the destination. Though performance degradation will be significant, this migration expects to minimize an impact for priority I/O requests issued from another client node.
4.3. Policy (3): Moderate Aggressive Migration Policy
Policy (3) is a moderate one. The migration source node chooses the middle storage node in the upper or lower storage tier as the destination. In data migration to the upper storage tier, this policy expects to obtain a higher performance gain by one migration than the Policy (1) though the gain will not reach the gain by the Policy (2). Moreover, in data migration to the lower storage tier, the migrated data block might disturb priority I/O requests at the destination node. The Policy (2) and (3) hereinafter are referred to as enhanced migration policies.
In the Policy (1), as stated as Equations (1) and (2), the threshold values Th and Tl are defined as the relative from the performance of the migration source node. If the absolute performance value of the migration source node is low, both of the two threshold values become nearly equal to the performance of the source node. Therefore, the effect of performance improvement by data block migration may be limitative. When the unified performance value of the migration source node is situated at low, the performance improvement using the enhanced migration policies is expected to be large.
4.4. Policy (4): Combined Migration Policy
Policy (4) is a mixture of the Policy (1) and the Policy (3). It is aimed to restrain a sudden performance drop at the time of migrating data to the lower storage tier. A data block might have been placed into a high-performance storage node due to a previous migration for improving I/O performance. In this policy, the aggressiveness for migration to the lower storage tier differs from migration to the upper storage tier. A migration to the lower storage tier will be performed more modestly than a migration to the upper storage tier. This aims to prevent excessive-performance drop accompanying making storage space.
Figure 5 shows an example of the destination candidates for data migration by the Policy (4). Data migration to the upper storage tier is executed the same as the Policy (3), but a migration to the lower tier follows the manner of the Policy (1) in order to slacken the performance degradation. The Policy (4) hereinafter is referred to as combined migration policy.
Migration destination by policy (4).
The combined migration policy will mitigate performance drop caused by the enhanced migration policies at a time of data migration to the lower storage tier.
4.5. Procedure to Choose a Migration Destination
The followings are the procedure details to choose a migration destination node. First, the migration source node sorts all the other storage nodes in descending order by the unified performance. Next, the migration source node picks an appropriate storage node as the destination from the upper or lower storage tier. In the case of data migration to the upper storage tier by the Policy (3), if the top n storage nodes have superior performance than the migration source node, the (n/2)th node will be chosen as the destination node.
5. EVALUATION
5.1. Simulation Environment
We evaluated the execution times of the four policies described in the previous section.
The evaluations were made on a simulator coded in C language. The static parameters used for the simulation are shown in Table 1. The number of storage nodes is set smaller than the number of client nodes to make a concentration of I/O operations.
| Nc | Total number of client nodes | 135, 180, 225 |
| Ns | Total number of storage nodes | 60, 120, 180 |
| p | Tiering parameter | 0.1, 0.2, 0.3, 0.4 |
| Nio | Number of I/Os per a client node | 20,000 |
| Ln | Network latency | 4 (μs) |
| Td | Destination selection time | 4 (μs) |
| Tm | Merging time | 0.4 (μs) |
| Tw | Upper limit of waiting time | 200 (μs) |
| Sf | Lower limit of unused storage ratio | 30% |
Simulation parameters
Because previous work [14] shows that relative better performance is obtained in the tiering parameter p = 0.2 or 0.3, we defined the parameter p as a range of 0.1–0.4.
The parameter Nio is the total number of I/O operations per a client node. Each client node performs I/O operations in accordance with statically defined read/write ratio.
The parameter Ln is latency for switching a packet on an Ethernet switch. It was measured on Corega CG-SSW08GTR network switch which has wire-speed forwarding capability. In this evaluation, we use an ideal configuration that network latency among all nodes is uniform in order to focus upon observing the behavior of the proposed method.
Two timing parameters, Td and Tm, have been defined by the results of preparatory experiments same as the previous work [14]. The destination selection time Td is constant regardless of the number of storage nodes because each node manages other nodes by using an array structure and picks a destination directly from the array. The parameter Tm is the time of merging the storage information to an iSCSI packet.
The parameter Tw is used for a threshold to decide whether to initiate data block migration to the upper storage tier. When the estimated waiting time which is calculated with the waiting queue length and averaged read/write latency exceeds Tw, the migration to the upper storage tier will be initiated.
The parameter Sf is used for a threshold to decide whether to initiate data block migration to the lower storage tier. When the size of free storage space is below Sf of the total storage space, the migration to the lower storage tier will be initiated. This threshold is the same as the value used for our previous simulation [14]. We decided that the definition of Sf is reasonable from the result of large investigation in the real environment reported by Douceur and Bolosky [15]. It reported that the mean space usage of 10,568 file systems of 4801 Windows PC in a commercial environment is only 53%.
Table 2 shows six types of typical storage devices used for the simulation. In this table, three device type each of HDD and SSD are listed from consumer- to enterprise-grade products. These devices are chosen from various type of HDD and SSD to emphasize system heterogeneity.
| Device type | Major specifications | Vendor and model name |
|---|---|---|
| D1 | SATA2 | Seagate |
| 7200 rpm HDD | ST3400620NS | |
| D2 | SATA3 | Seagate |
| 7200 rpm HDD | ST6000NM0235 | |
| D3 | SAS3 | Seagate |
| 15,000 rpm HDD | ST900MP0146 | |
| D4 | PCIe 3.0 × 4 | Intel |
| MLC SSD | SSD 750 | |
| D5 | SATA3 | Intel |
| TLC SSD | SSD D3-S4610 | |
| D6 | SATA2 | Intel |
| MLC SSD | X25-M |
Assumed storage devices
We prepared storage templates from the device type listed in Table 2. The configurations of the storage templates are shown in Table 3. The latency values are calculated with performance information collected from their data sheet published by the manufacturer. The initial capacity shows the size of public storage shared for client nodes. We also configured another storage template from each device type by adding 10% variations to the parameters. In such manners, 12 storage templates are made from six device type. The storage nodes are instantiated evenly from the storage templates. For example, in the case of the total number of storage nodes is 60, five instances per a storage template are created.
| Storage templates | Device type | Read latency (μs) | Write latency (μs) | Initial capacity (MB) |
|---|---|---|---|---|
| S1 | D1 | 110 | 110 | 2000 |
| S2 | D1 | 121 | 121 | 2200 |
| S3 | D2 | 36 | 36 | 4000 |
| S4 | D2 | 39 | 39 | 4400 |
| S5 | D3 | 25 | 25 | 2000 |
| S6 | D3 | 27 | 27 | 2200 |
| S7 | D4 | 3 | 4 | 500 |
| S8 | D4 | 4 | 5 | 550 |
| S9 | D5 | 11 | 20 | 1000 |
| S10 | D5 | 12 | 22 | 1100 |
| S11 | D6 | 29 | 116 | 2000 |
| S12 | D6 | 32 | 127 | 2200 |
Configurations of storage templates
Table 4 shows parameter configurations of nine types of templates for the client node. Each client template is set to issue an I/O request at intervals of 2, 4, and 8 μs. Reading and writing ratio of the I/O requests from each client template is shown in the I/O ratio column in Table 4. In this simulation, the frequency of reading and writing is set to nearly equal. In a similar manner as the storage node, the client nodes are created from these templates.
| Client templates | I/O interval (μs) | I/O ratio (R:W) |
|---|---|---|
| C1 | 2 | 55:45 |
| C2 | 4 | 55:45 |
| C3 | 8 | 55:45 |
| C4 | 2 | 50:50 |
| C5 | 4 | 50:50 |
| C6 | 8 | 50:50 |
| C7 | 2 | 45:55 |
| C8 | 4 | 45:55 |
| C9 | 8 | 45:55 |
Configurations of client templates
The unit size of data migration is set as ten megabytes. The latency time of one data migration is set as 200 ms. It is the average time measured in the 1000BASE-T network.
Initially, all the client nodes access data blocks located on one of the storage nodes created from the storage template S1.
5.2. Results and Considerations
We measured the average execution time Ta to complete Nio times I/O requests by each client node. It is calculated by using Equation (3).
Figures 6–8 show results of the simulation. Each result is labeled as the concatenation of the number of client nodes and the migration policy. For example, the result labeled ‘‘C180P2’’ denotes the result which is measured under the condition of 180 client nodes and the Policy (2) migration policy.
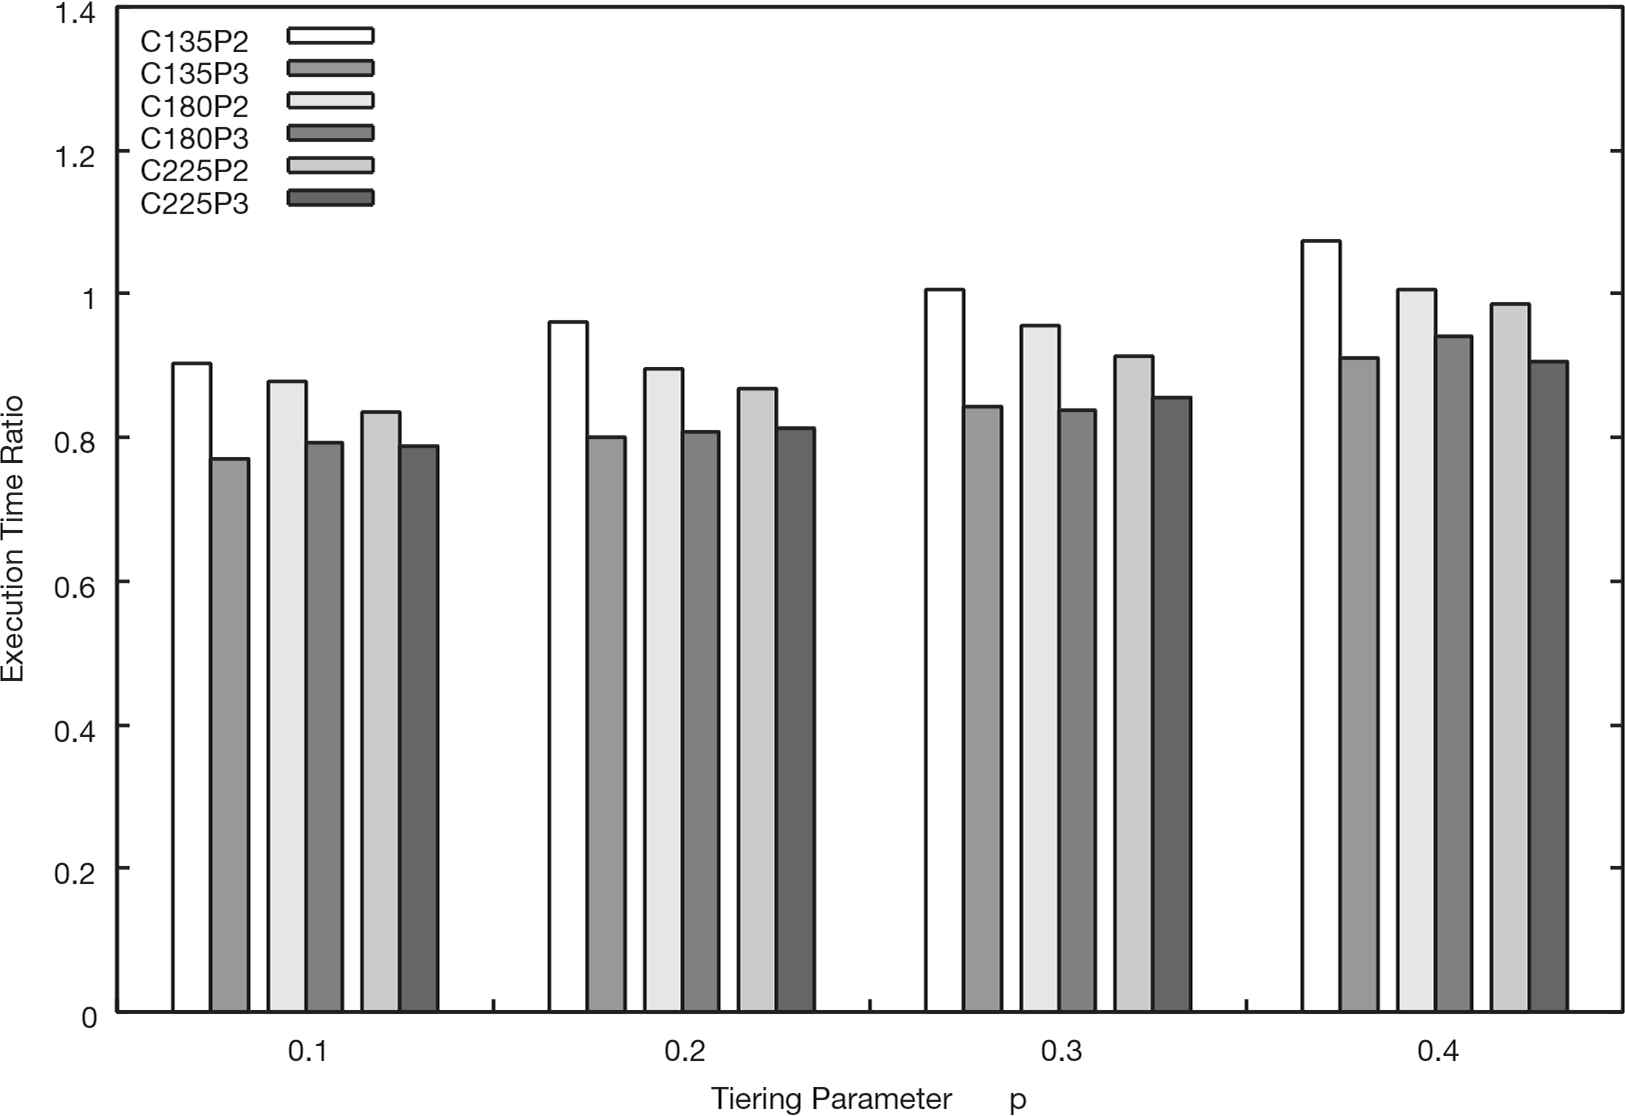
Execution time ratio of the Policy (2) and (3) to the Policy (1) (Ns = 60).
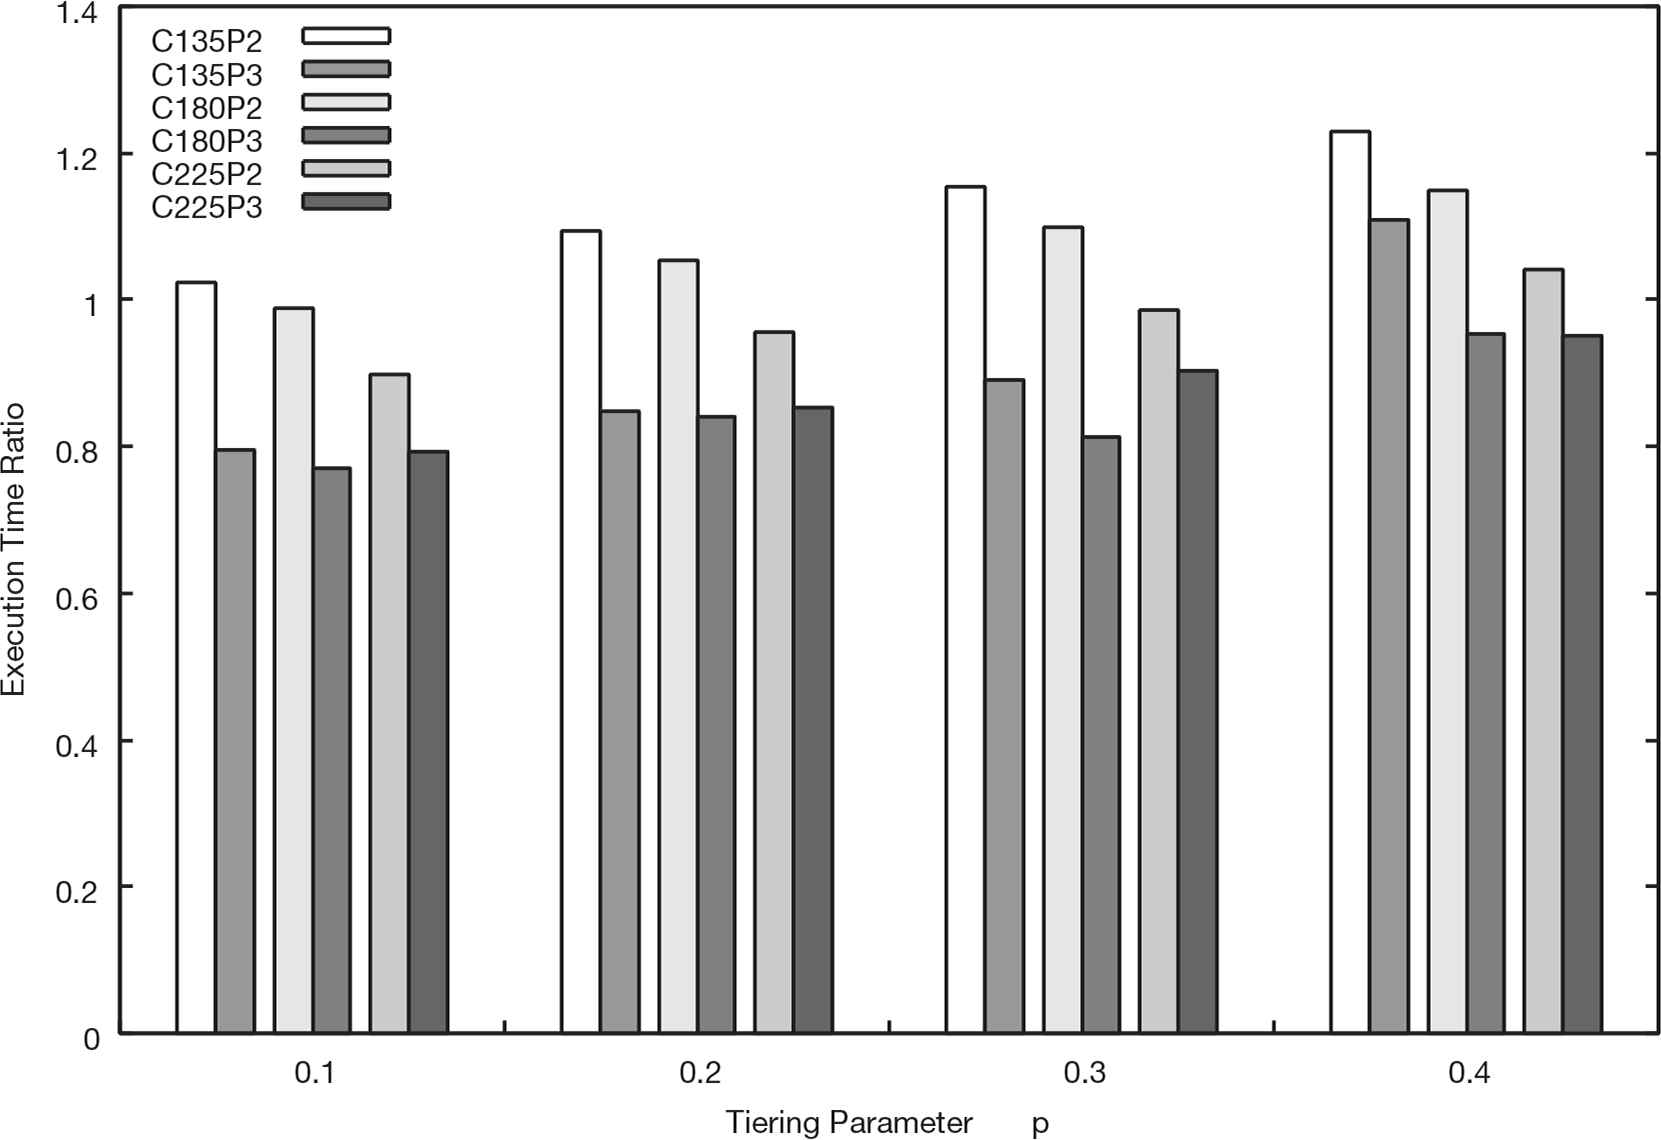
Execution time ratio of the Policy (2) and (3) to the Policy (1) (Ns = 120).
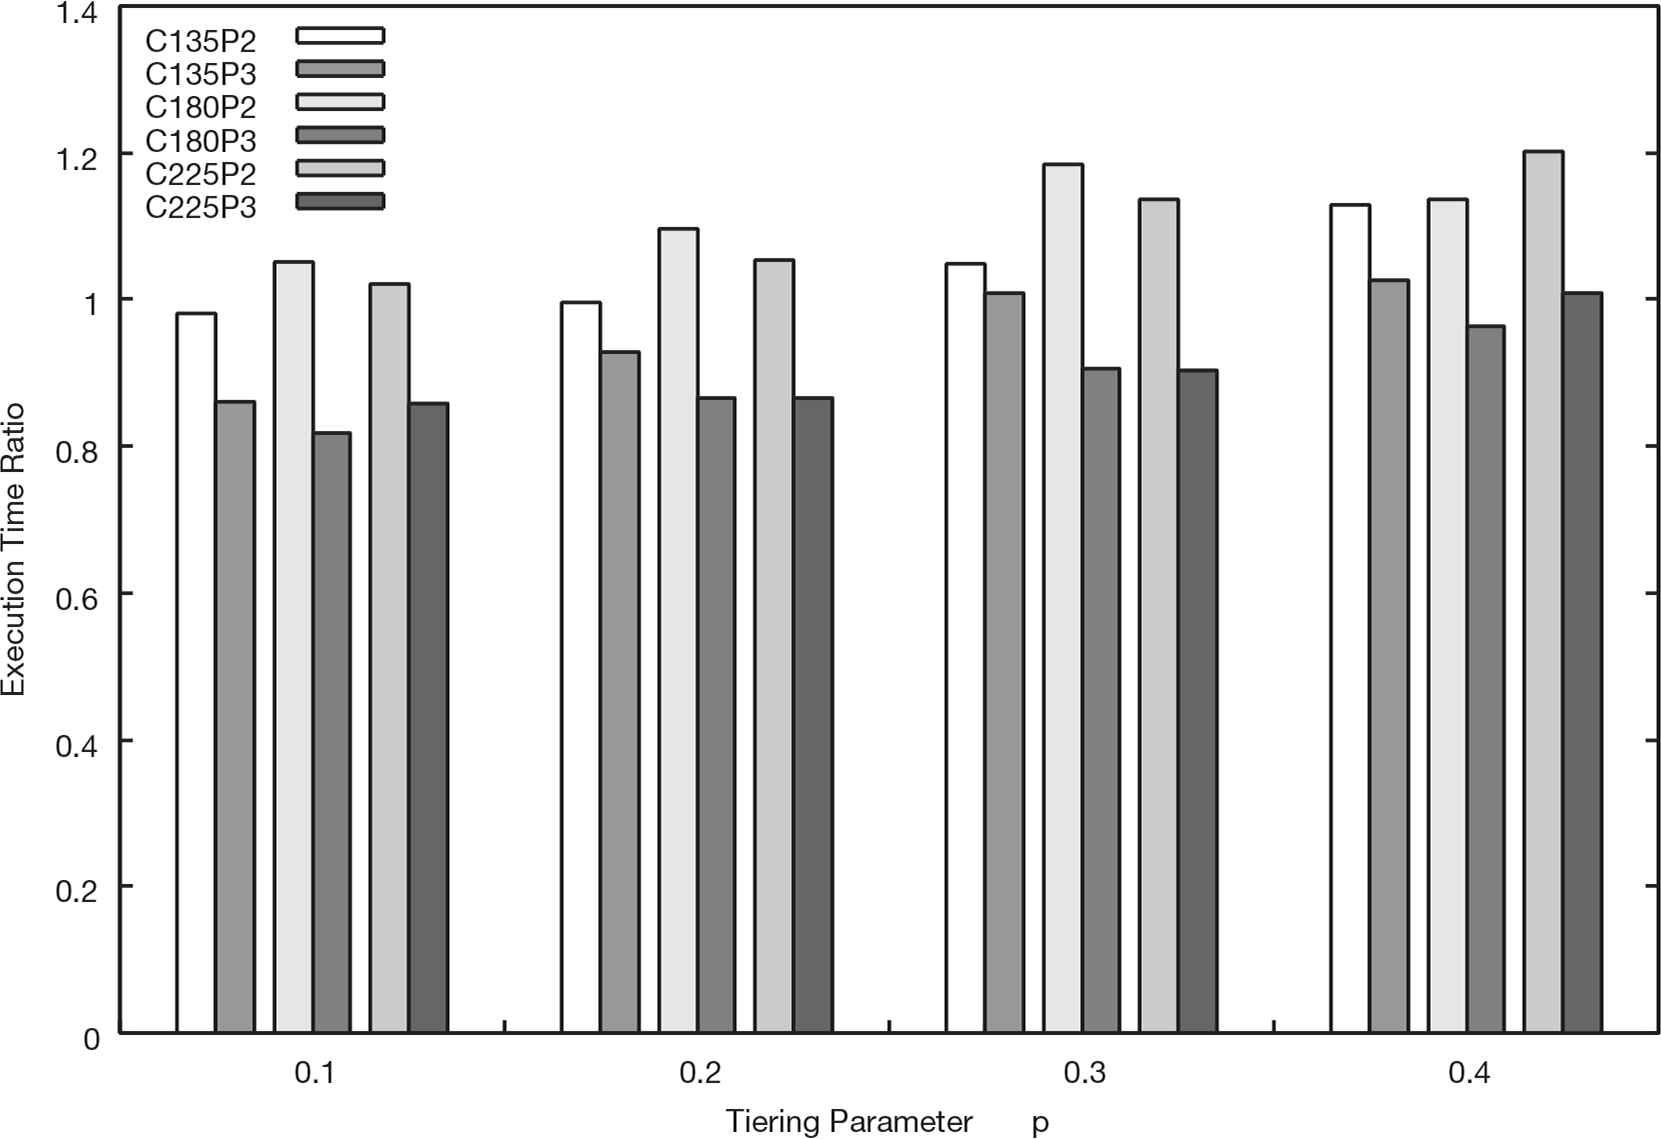
Execution time ratio of the Policy (2) and (3) to the Policy (1) (Ns = 180).
In these figures, the execution time ratio Rn,1 for the Policy (n) is calculated by using Equation (4).
5.2.1. Performance Comparison between Original Migration Policy and Enhanced Migration Policies
As seen in Figure 6, the Policy (3) reduces the execution time from the Policy (1) in all conditions. Especially, in the condition p = 0.1, the Policy (3) reduces around 20% execution time. In this condition, because the tiering parameter p is relatively small, advantages of data migration to the upper storage tier by the Policy (1) is limited. In contrast to the Policy (1), in the Policy (3), a migration source node can migrate data blocks beyond the cap of performance gain defined by the parameter p. Hence, the Policy (3) contributes to improve the system I/O performance even if the parameter p is set lower than the best value.
On the other hand, the Policy (2) shows smaller improvements than the Policy (3). Particularly, the result under the condition combined Nc = 135 and p = 0.4 shows 7.3% worse than the Policy (1). In the condition of larger p, an opportunity of data migration is fewer than the condition of smaller p because of a small number of candidates of migration destination. Addition to such a limited number of data migration, a concentration of migration to a specific storage node had a more harmful effect upon the execution time rather than a good effect taken from an effectual migration in the Policy (2).
In Figure 7, the execution time by the Policy (2) in the condition of Nc = 135 are longer than the Policy (1). In the Policy (2), because a lot of storage nodes migrate data to the top node of the upper storage tier, a bad influence by the I/O concentration becomes unignorable when the number of storage nodes in the system is large. Figure 7 shows that the effect of performance improvement by aggressive data migration is insufficient to the performance decline caused by a concentration of the destination of data migration. Nevertheless, the Policy (3) achieves 23% performance gain at maximum because the performance improvement by the migration and the prevention of I/O concentration are designed to be compatible.
Figure 8 shows that the performance improvements by the enhanced migration policies are overall declined. Especially, in the condition of p = 0.4, the reduction of the execution time is <5% even the Policy (3). When there are a sufficient number of storage nodes in the system, enlargement of the parameter p, like p = 0.4, helps speeding up distributing I/O workloads because the performance gain by one migration becomes large even in the Policy (1). Hence, the performance difference between the Policy (1) and the Policy (3) becomes small in such conditions.
In Figures 7 and 8, some of the execution time ratios exceed one in the Policy (2). Because there is relatively little demand for data migration from a small number of client nodes, the problem of concentrate data blocks onto a specific storage node may have been marked more than the performance gain obtained by a few migrations. On the other hand, the execution time ratio of the Policy (3) almost below the ratio one. This shows that the Policy (3) can achieve consistent performance improvement in most cases not only in a large system.
5.2.2. Performance Comparison between Enhanced Migration Policies
In all cases, the execution time using the Policy (3) is shorter than the execution time using the Policy (2). The maximum reduction ratio of the execution time reached 26% in the conditions of Nc =180, Ns = 120, and p = 0.3 combination. Because the performance improvement by the Policy (3) is always superior than the Policy (2), we can use only the Policy (3) as the enhancement over the original migration policy.
5.2.3. Performance Improvement by Combined Migration Policy
We also evaluated the effectiveness of the combined migration policy. In this section, we compare the execution time in the Policy (3) and the Policy (4) by using Equation (5).
Table 5 shows the execution time ratio R4,3 calculated by Equation (5). In Table 5, the first column lists the number of client nodes, and the second column represents the number of storage nodes.
| Nc | Ns | Tiering parameter p | |||
|---|---|---|---|---|---|
| 0.1 | 0.2 | 0.3 | 0.4 | ||
| 135 | 60 | 1.000 | 1.000 | 1.000 | 1.000 |
| 120 | 1.000 | 1.000 | 1.000 | 1.000 | |
| 180 | 1.000 | 1.000 | 1.000 | 1.000 | |
| 180 | 60 | 0.999 | 1.000 | 1.000 | 0.998 |
| 120 | 0.995 | 0.998 | 0.998 | 0.998 | |
| 180 | 0.996 | 0.998 | 0.998 | 0.998 | |
| 225 | 60 | 0.975 | 0.996 | 0.996 | 0.997 |
| 120 | 0.997 | 0.999 | 0.997 | 0.997 | |
| 180 | 0.998 | 0.998 | 0.997 | 0.998 | |
Execution time ratio of Policy (4) to Policy (3)
In the condition of Nc = 135, we cannot find a difference between the execution time in the two policies. The maximum reduction ratio of the execution time is 2.5% and observed in the conditions of Nc = 225, Ns = 60, and p = 0.1 combination. These conditions represent the environment of that many client nodes access the small number of storage nodes. And also, because the parameter p is set at small, frequently accessed data blocks spread into the upper storage tier slowly. In such a situation, a storage node which has become few storage capacities begins data migration to the lower storage tier. The combined migration policy can restrain I/O performance drop for accessing the migrated data blocks.
6. CONCLUSION
In this paper, we proposed two enhanced migration policies and one combined migration policy as an improvement of data migration in a distributed storage system with dynamic tiering function. We also evaluated the effect of these policies by simulation.
The policy which aims to maximize the migration efficiency degraded system I/O performance under a certain combination of conditions. We confirmed that the migration policy which balances an avoidance of data concentration and improvement of migration efficiency almost consistently improved the performance. Moreover, combining two migration policies can achieve further improvement in I/O performance when many migrations to the lower storage tier occur.
As future work, we will develop a scheme which can be applied for an actual network which has not uniform network latency, such as a network with cascaded switches. We will also build an experimental system for more detailed evaluation.
CONFLICTS OF INTEREST
The authors declare they have no conflicts of interest.
ACKNOWLEDGMENTS
This work was supported by
REFERENCES
Cite this article
TY  - JOUR
AU  - Atsushi Nunome
AU  - Hiroaki Hirata
PY  - 2019
DA  - 2019/11/29
TI  - Performance Evaluation of Data Migration Policies for a Distributed Storage System with Dynamic Tiering
JO  - International Journal of Networked and Distributed Computing
SP  - 1
EP  - 8
VL  - 8
IS  - 1
SN  - 2211-7946
UR  - https://doi.org/10.2991/ijndc.k.191115.001
DO  - 10.2991/ijndc.k.191115.001
ID  - Nunome2019
ER  -