
Analysis of Features Dataset for DDoS Detection by using ASVM Method on Software Defined Networking
- DOI
- 10.2991/ijndc.k.200325.001How to use a DOI?
- Keywords
- cross-validation; distributed denial of service; performance evaluation; software defined networking; support vector machine
- Abstract
The impact of Distributed Denial of Service (DDoS) attack is one of the major concerns for Software Defined Networking (SDN) environments. Support Vector Machine (SVM) has been used in a DDoS attack detection mechanism on SDN. The advantages of SVM algorithms in DDoS attack detections are high accuracy and low false positive rate. However, SVM algorithm takes too long for training and testing time. A large number of literatures have been tried to get better results in a SVM-based DDoS attack detection. They proposed various kinds of SVM-based detection methods. Their results were measuring and evaluating by using various evaluation metrics. As a result, a SVM-based detection performance depends on the nature of traffic datasets. In this paper, our focus is to analyze the extracted features from the SDN traffics dataset resulting on a reduction of bias data from the dataset. SDN traffics features dataset were validated by using 10-fold cross-validation method. The effectiveness of our created dataset was validated by comparing with other dataset, e.g. Knowledge Discovery and Data Mining Tools Competition (KDDCUP) 99 dataset. In conclusion, our proposed dataset can be used effectively for SVM on SDN.
- Copyright
- © 2020 The Authors. Published by Atlantis Press SARL.
- Open Access
- This is an open access article distributed under the CC BY-NC 4.0 license (http://creativecommons.org/licenses/by-nc/4.0/).
1. INTRODUCTION
With the continuous development of networking environment, nowadays, there are many innovative technologies in computer network researches and industries. Most businesses use various mobile devices, cloud services and virtualization techniques in network environments [1]. Their usage is becoming the strongest evolution. The network programmability will be critical for business growth. Most of the today’s network types are traditional networks. The traditional network management methods are device-by-device and system by using manual configurations [2]. All devices are controlled and managed by human. If a new network device is added to the network, the device must be first configured. As a result, the network is not flexible and cannot be easily scale.
With the growth of traditional networks, the devices that need to be controlled are increasing, making it difficult to control a huge network infrastructure. Moreover, there are many private and public cloud service providers [3]. They need the agility to provide varieties of applications, different infrastructures and numerous resources. To overcome these limitations of traditional networks, a new network management technology must be introduced. Software Defined Networking (SDN) can solve these limitations and issues [4]. SDN becomes a popular technique in academic researches and industries. SDN enables the organizations’ networks to be managed dynamically and scalable in capacity. SDN allows enterprises to keep up with the chaining nature of their businesses that is more responsive to their users, customers and market opportunities. Although SDN overcomes the limitations and issues of a traditional networking, there exists some challenges including reliability, scalability, security and interoperability. One of the big challenges of SDN is security issues. There are different kinds of attacks on a SDN infrastructure. They are Distributed Denial of Service (DDoS), worm propagation and port scan attacks [5]. Among these attacks, a DDoS attack is the most common and popular attacks in SDN.
Most previous DDoS detection researches have been used traditional DDoS datasets, Center for Applied Internet Data Analysis (CAIDA) and Defense Advanced Research Projects Agency (DARPA). They are sometimes error prone. These datasets used the traffics collected from laboratory network environments. These are varied in terms of tools and emulated environments. Some researcher used these datasets by normalization during the data preprocessing stage. When the normalization process has been done at the early stage, the classification performance becomes slower. Moreover, all features in the traditional dataset are generalized traffics features. Therefore, specific features are very important for the improvement of the classification accuracy.
From the previous research, we generated the UDP attack traffics, Synchronize (SYN) attacks traffics and normal traffics from our testbed [6]. We have extracted the five specific features of SDN traffics and stored as the feature dataset. ASVM method is used as the classification method. However, the bias data can be an issue. In this paper, a cross-validation method is used to solve the bias issue. The result of this method has minimum biased or minimum optimistic result than other methods.
In this paper, we use SDNTrafficsDS dataset from our proposed method [7]. We validate this dataset by using 10-fold cross-validation method to create an effective dataset. We will train with SDNTrafficsDS dataset and test with Knowledge Discovery and Data Mining Tools Competition (KDDCUP) dataset [8]. We evaluate our created dataset by comparing with KDDCUP dataset. The remaining paper is organized as follows. In Section 2, literatures surveys are presented. In Section 3, the theory background of our research works, SDN, DDoS, cross-validation method and Support Vector Machine (SVM) algorithm are presented. In Section 4, the validation of dataset by using cross-validation method is discussed. In Section 5, the discussion is provided while the conclusion is given along with the future works.
2. RELATED WORKS
The classification algorithm, SVM is gradually used in a DDoS detection and mitigation on SDN environments. Many researchers have proposed the effective ways to detect malicious attacks on SDN environment. DDoS attack can be detected by using a SVM algorithm on SDN at an earlier stage [9]. The authors have described one of the SDN security issue of the controller. Their experiments have been carried out with 2000 DARPA intrusion datasets and 1998 DARPA datasets. According to their results, a SVM has a high accuracy but it has less false-positive rate. DDoS attack traffics patterns on a SDN network are varied. Therefore, some DDoS attack detection system by using SVM use entropy to measure the attack distribution [10]. The authors have proposed the DDoS attack detection model on SDN by using a SVM algorithm. They detected the DDoS attack with a trained SVM model. According to their experiments, they have shown that their method can detect a DDoS attack with a high efficiency and can mitigate real-time attacks.
Software defined networking is regarded as a novel networking architecture for detecting a DoS attack [11]. The authors have proposed the intelligent approach for a DoS attack detecting in SDN. They have proposed a two-stage intelligent approach. They have taken the advantage of the SDN method to detect DoS flooding attacks based on a packet rate calculation at the first step and followed by a SVM classification at the second step. When the packet rate exceeds a predefined threshold, the system will inspect the packet, and the SVM algorithm will classify the previously collected packets. The parameters of the SVM algorithm can optimize the classification result [12]. The authors have published DDoS detection in SDN switches using SVM classifier. They have proved that the superiority of a SVM is based on a traffics flow for the DDoS detection in SDN switches. Thus, the parameter optimization for a SVM classification based on the traffics flow is then proposed. Their system has detected DDoS attacks using SVM optimized parameter C and g with cross-validation genetic algorithm (CV-GA).When a SDN and a SVM algorithm are fused in a DDoS detection, an innovative detecting system can be generated [13]. The authors have combined a SDN and a SVM technologies which can lead to an innovative system of a malware detection. They have used a SVM as a core system for a detection malware. The traffics features are extracted from the SDN controller.
On the DDoS detection on SDN researches, some researchers use a neural network algorithm, but it is not practical enough to be applied. Therefore, SVM is more useful for an effective dataset [14]. The authors have used a SDN environment provided by mininet and a floodlight controller. They extracted six tuple characteristics of the OpenFlow switches and created the traffics dataset. They have classified the DDoS attack by using a SVM algorithm. Their experimental results showed that the average accuracy rate of their proposed system is 95.24% with a small amount of collected flows. Some researchers have been compared the machine learning algorithm in detection of DDoS attacks [15]. The authors have proposed the model to detect the DDoS attacks in the controller at an earlier stage. Their system has used a Naïve Bayes classifier, a SVM and a neural network. They have used a real-time dataset that is generated from Transmission Control Protocol (TCP) traffic between Lawrence Berkley Laboratory and the rest of the real world. Their classification results have shown that the effectiveness of the solution has been evaluated on different topologies. Some researchers have proposed the detection framework model by using SVM [16]. The authors propose Framework for Detection and Mitigation of DDoS attack (FADM) framework. It is efficient and light weight framework. It can detect and mitigate DDoS attacks on SDN. At first, they have collected the network traffics information from the sFlow agents and the SDN controller. And then, they have measured the network feature by using the entropy-based method. FADM used a Python based SDN controller (POX). Therefore, they have evaluated by the average CPU utilization of the controller. Their experimental results have shown that their proposed framework, FADM can detect effectively and shortly.
Support vector machine can be used as an efficient DDoS detection technique in Vehicular networks platform [17]. The authors have proposed the platform that contains the trigger mechanism of OpenFlow protocols for a response and involves the flow feature extraction strategies based on the different dimensional information. By analyzing the simulation of their results, they have verified that their detection mechanism effectively reduces the time of starting an attack detection and a classification recognition. It has a lower false alarm rate. SVM algorithm can also be used in a detection of a DDoS attack on big data analytics [18]. The authors have proposed a real-time solution for detecting DDoS attacks in a SDN environment and compared the effectiveness of the proposed methods. They have measure the false alarm and detection rate of SVM, threshold-based MapReduce, and fuzzy deterministic clustering. Their experimental results have shown that a good detection ratio of the proposed methods. Although there are varieties of DDoS attack detection researches, the volume and impact of a DDoS attack still exists. Therefore, the need to detect and mitigate this attack in a SDN environment still exists.
3. BACKGROUND THEORY
In this section, we will briefly explain SDN, DDoS attack and SVM algorithm.
3.1. Software Defined Networking
Most traditional network switch and router designs are closed systems. Therefore, people cannot effort to implement their own devices using their own protocols. Most individual devices are more expensive and time consuming in implementation [19]. To solve the network problem, they have used a SDN infrastructure. SDN is the network architecture that the network control is logically centralized and physically distributed from forwarding devices [20]. The major advantages of SDN are network scalability and traffics flow optimization. SDN architecture consists of three layers including the infrastructure layer also known as Data Plane, the control layer also known as Control Plane and the application layer also known as Management Plane. SDN’s architecture is shown in Figure 1.

Architecture of Software Defined Networking (SDN).
The lowest layer, Data Plane is composed of OpenFlow enabled switches. All switches do not need to perform other services. When the packets arrive at each switch, it looks for the match of the incoming packet and the flow tables. If the match is found, the packet is forwarded to the destination address. Otherwise, the packet in message is sent to the control plane via a sound bound protocol. The standard south bound protocol is the OpenFlow protocol. This protocol is founded by Open Network Foundation [21]. The control plane is the middle layer of the architecture. When the packet arrives at the control plane, the decision must be made on the packet. The decision includes dropping or sending back a packet out message. If the packet sends back to the corresponding switches, then the flow table for each switch must also be updated. The control plane provides the information for the above layer, the management plane, and gives the service for the lowest layer of the architecture. Therefore, it is needed to maintain the centralized view of the network and allows the management plane to manage all networks. The management plane is the uppermost layer of the architecture. This plane can provide the security and management of the whole network. This plane consists of many applications that run on the control plane and communicate with the northbound protocol. There is no standard northbound protocol in the SDN architecture.
3.2. Distributed Denial of Service Attack
Distributed denial of service attack is one of the most common methods used by the attackers and involves launching a large amount of network packets to certain victims or servers to breakdown the system [22]. The typical DDoS attack system consists of three parts, the attacker, the zombie system and the victim. This attack system is shown in Figure 2. First, the attacker checks the victim system vulnerabilities and sets up the attack mechanism. This mechanism has been installed at the victim system. The attacker can send the commands to the zombies system via a secure channel to activate a DDoS attack on the victim machine. When the zombies have been modified the packets, the attack complexity will be increased. It is difficult to race the attack source. The attacker can send the attack command to the attack system and carry out a DDoS attack which is known as the botnet. The main feature of botnets is that botnet can update the software from the attacker.

Architecture of Distributed Denial of Service (DDoS) attack.
According to the internet security’s 2018 summer report, the volume of DDoS attacks reached 1.35 Tbps. The attackers have not used any botnet in this attack [23]. This attack size is greater than the Mirai botnet attack size in 2016. Normally, a DDoS attack can be distinguished into three basic groups including protocol attacks, volume-based attacks, and application attacks [24]. Under protocol attacks, the victim’s resources are exhausted via the network protocol. These kinds of attacks are a SYN flooding, Smurf and Ping of Death attack. Under volume-based attacks, the victim network bandwidth are exhausted with heavy traffics. These kinds of attacks are internet control message protocol flooding attack and User Datagram Protocol (UDP) flooding attack. In this paper, we have analyzed the volume-based attack. Under application attacks, the victim’s application on its server can be crashed by the exploitation of an application layer protocol. These kinds of attacks are Slowloris attack and Hypertext Transfer Protocol flooding.
3.3. Support Vector Machine Algorithm
Support vector machine algorithm is the supervised machine learning method that classifies different classes by generating the hyperplanes on different classes. Drawing hyperplanes that separate the different class labels [25]. The nature of SVM can solve a regression and classification problems. The most important thing in SVM is constructing an optimal hyperplane. There are four main advantages of SVM [26]. The first advantage is that SVM has a regularization parameter. This can avoid an over-fitting problem of datasets. The second advantage is that SVM uses the kernel trick. Thus, the expert knowledge can be built into the kernel. The third advantage is that SVM is defined by a convex optimization problem for which there are efficient methods. The fourth advantage is that SVM is an approximation to a bound on the test error rate. On the other hand, SVM has some disadvantages. They are that the theory only really covers the determination of the parameters for a given value of the regularization and choice of the kernel. SVM is originally used for two classes’ classification. The sample two classifications are shown in Figure 3.

Linear Support Vector Machine (SVM) classification.
In Figure 3, there are two classes including black cycles and white cycles. There is a straight line separating the two classes. The data points on the hyper planes are called the support vectors. This straight line is considered as w.x + b = 0, where w is the weight vector and b is the bias scalar. This plane of the class, black cycle is considered as w.x + b = 1, and another hyperplane of second class, white cycle is considered as w.x + b = –1. In this paper, SDNTrafficDS dataset is linearly separable. Therefore, the two hyperplanes can be seen in parallel and their distance between them should be as far as possible. The distance between the two hyperplanes is recognized in Equation (1).
In practices, the values of the data are not binary. It will be multi-class classification. In a multiclass classification of SVM, we also need to consider the classifier judgement, one-against-one and one-against-some [27]. These two classifiers are needed to consider in the testing phase. In one-against-one classifier, its pattern is considered as n (n − 1)/2. In this classifier, there are two sample classes. The first sample is trained as a positive class and another one is trained as a negative. In one-against-some classifier, the first class is trained with remaining (n − 1) classes. First sample class is considered as positive and another class is considered as negative. In this paper, we used one-against-some classifier. In multi-class SVM, it is also needed to use a kernel function [28]. Kernel function maps the dataset into a higher dimension space in order to make it possible to separate the classes. Most useful kernel functions are Linear Kernel, Radial Basis Function kernel, sigmoid kernel and polynomial kernel. In this system, we used Linear Kernel function.
4. VALIDATION OF DATASET BY CROSS-VALIDATION TECHNIQUE
Cross-validation is a statistical method used to estimate the skill of machine learning models [29]. It is commonly used in machine learning to compare and select a model for a given predictive modeling problem. It is a resampling procedure used for evaluating a machine learning model on a limited data sample.
4.1. K-fold Cross-validation Technique
K-fold cross-validation has a single parameter called k that refers to the number of groups that a given data sample is to be split into k pieces [30]. This procedure is also called k-fold cross-validation. When a specific value for k is chosen, it is folded as kth. For example, the value of k is 10, it is becoming 10-fold cross-validation. Cross-validation is simple to understand and also is popular method. The result of this method has less biased or less optimistic estimate of the model skill than other methods, a simple train/test split. The procedure of K-fold cross validation is shown in Figure 4.
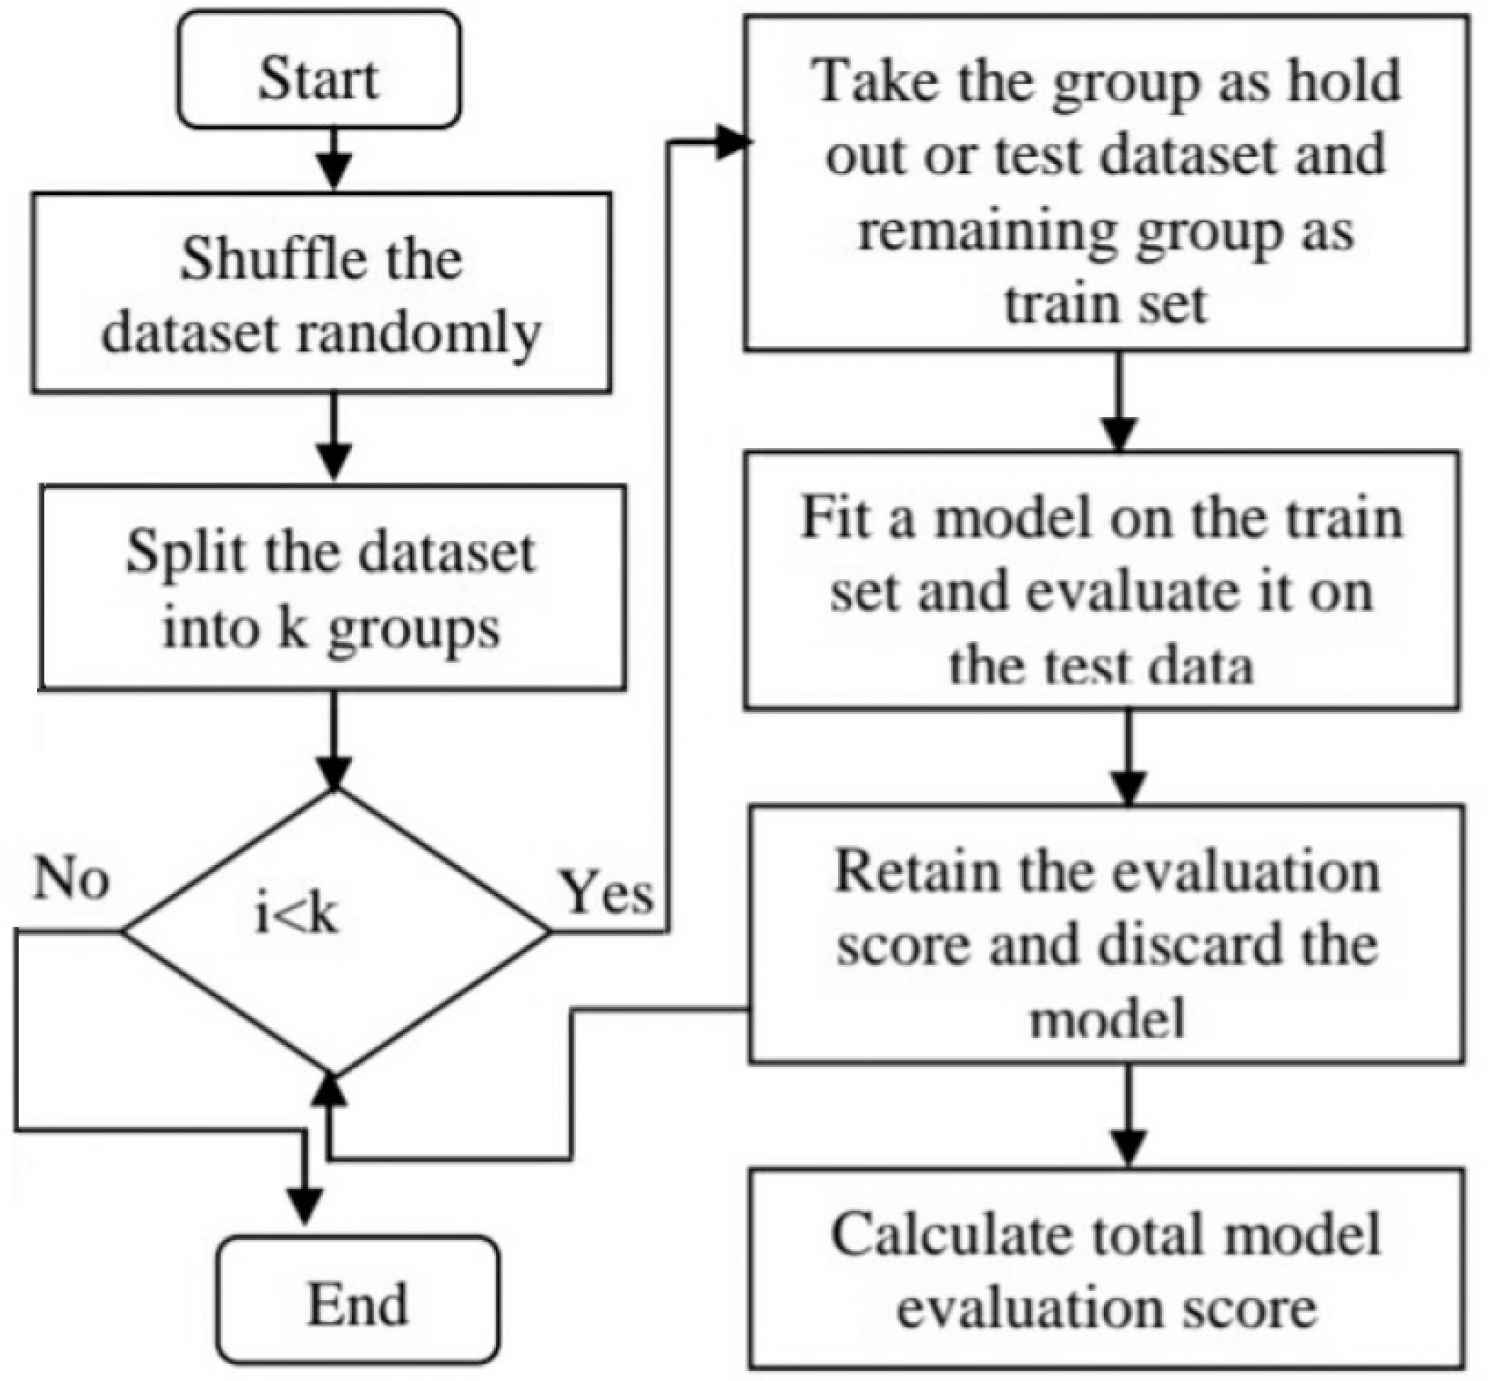
K-fold cross-validation procedure.
First, it is needed to shuffle the input dataset randomly. And then, these dataset is split into k groups. For each unique group, it is taken the group as the hold out or test dataset. It is also needed to take the remaining groups as a training dataset. The next step is to fit a model on the training set and evaluate it on the test set. Finally, the skill of the model is summarized using the sample of model evaluation scores.
4.2. Limitations of Cross-validation
Although the cross-validation method has many advantages in machine learning field, it has some limitation [31]. In an experiment, the cross-validation will provide a meaningful and accurate result. However, in a real world, it cannot know that the model might encounter in the future. In predictive modeling, the predictive result is within a period. In the real world, it can be expected the accurate prediction of the next period. In the cross-validation process development, cross-validation can face the individual’s risk of suffering from a particular aliment.
4.3. Applications of Cross-validation
Cross-validation method can be used to avoid an overfitting and an underfitting of datasets [32]. The applications of cross-validations are as follow. Cross-validation can use for comparing the performances of a set of predictive modeling procedures. It can be used in medical research and determine the exact subset that provides the best results. Data analysts have used this method in the field of medical statistics.
4.4. Ten-fold Cross-validation
In this validation, the value of k for folding the dataset is 10. First, the dataset is separated into 10 groups. For each validation, the first group is used as the testing dataset and the remaining groups are used as the training dataset. When the model is generated from the testing dataset, the model must be evaluated with the remaining groups. After finishing the first evaluation, it is needed to discard this model. And then, it is continued the next validation. When the 10-fold validation process have completed, the total model evaluation score must be calculated. In this paper, the model evaluation score, the precision, recall and F1 score [33] are calculated. The precision is the measurement of the retrieved instance that is relevant to these instances. The precision is shown in Equation (2). The recall is the measurement of the relevant instance that is successfully retrieved. This recall equation is shown in Equation (3). The F1 score is the measurement of seeking the balance between the precision and the recall. This F1 score measurement is shown in Equation (4).
5. EVALUATION OF EFFECTIVE DATASET
In this paper, we analyze and evaluate our created feature dataset, SDNTrafficsDS. We compare the effectiveness of the created dataset with the KDDCUP99 dataset. This dataset is the well-known dataset for an intrusion detection system. The KDDCUP99 dataset consists of 41 features and 15 classes.
5.1. Analysis of SDNTrafficsDS Dataset
In this paper, we use our created dataset, SDNTrafficsDS. This dataset consists of five features attributes and three types of classes. Five features are the average number of packets per flow in the sampling interval (ANPI), the variation of packets per flow in the sampling interval (VPI), the average number of data bytes per flow in the sampling interval (ANBI), the variation of data bytes per flow in the sampling interval (VBI) and the average duration of traffics in the sampling interval (ADTI). Three types of classes are UDP Flood, SYN Flood and Normal. We have compared the five features on the Normal Traffics, UDP Flooding and SYN Flooding attack. The comparison of traffics features for UDP Flooding attack is shown in Figure 5.
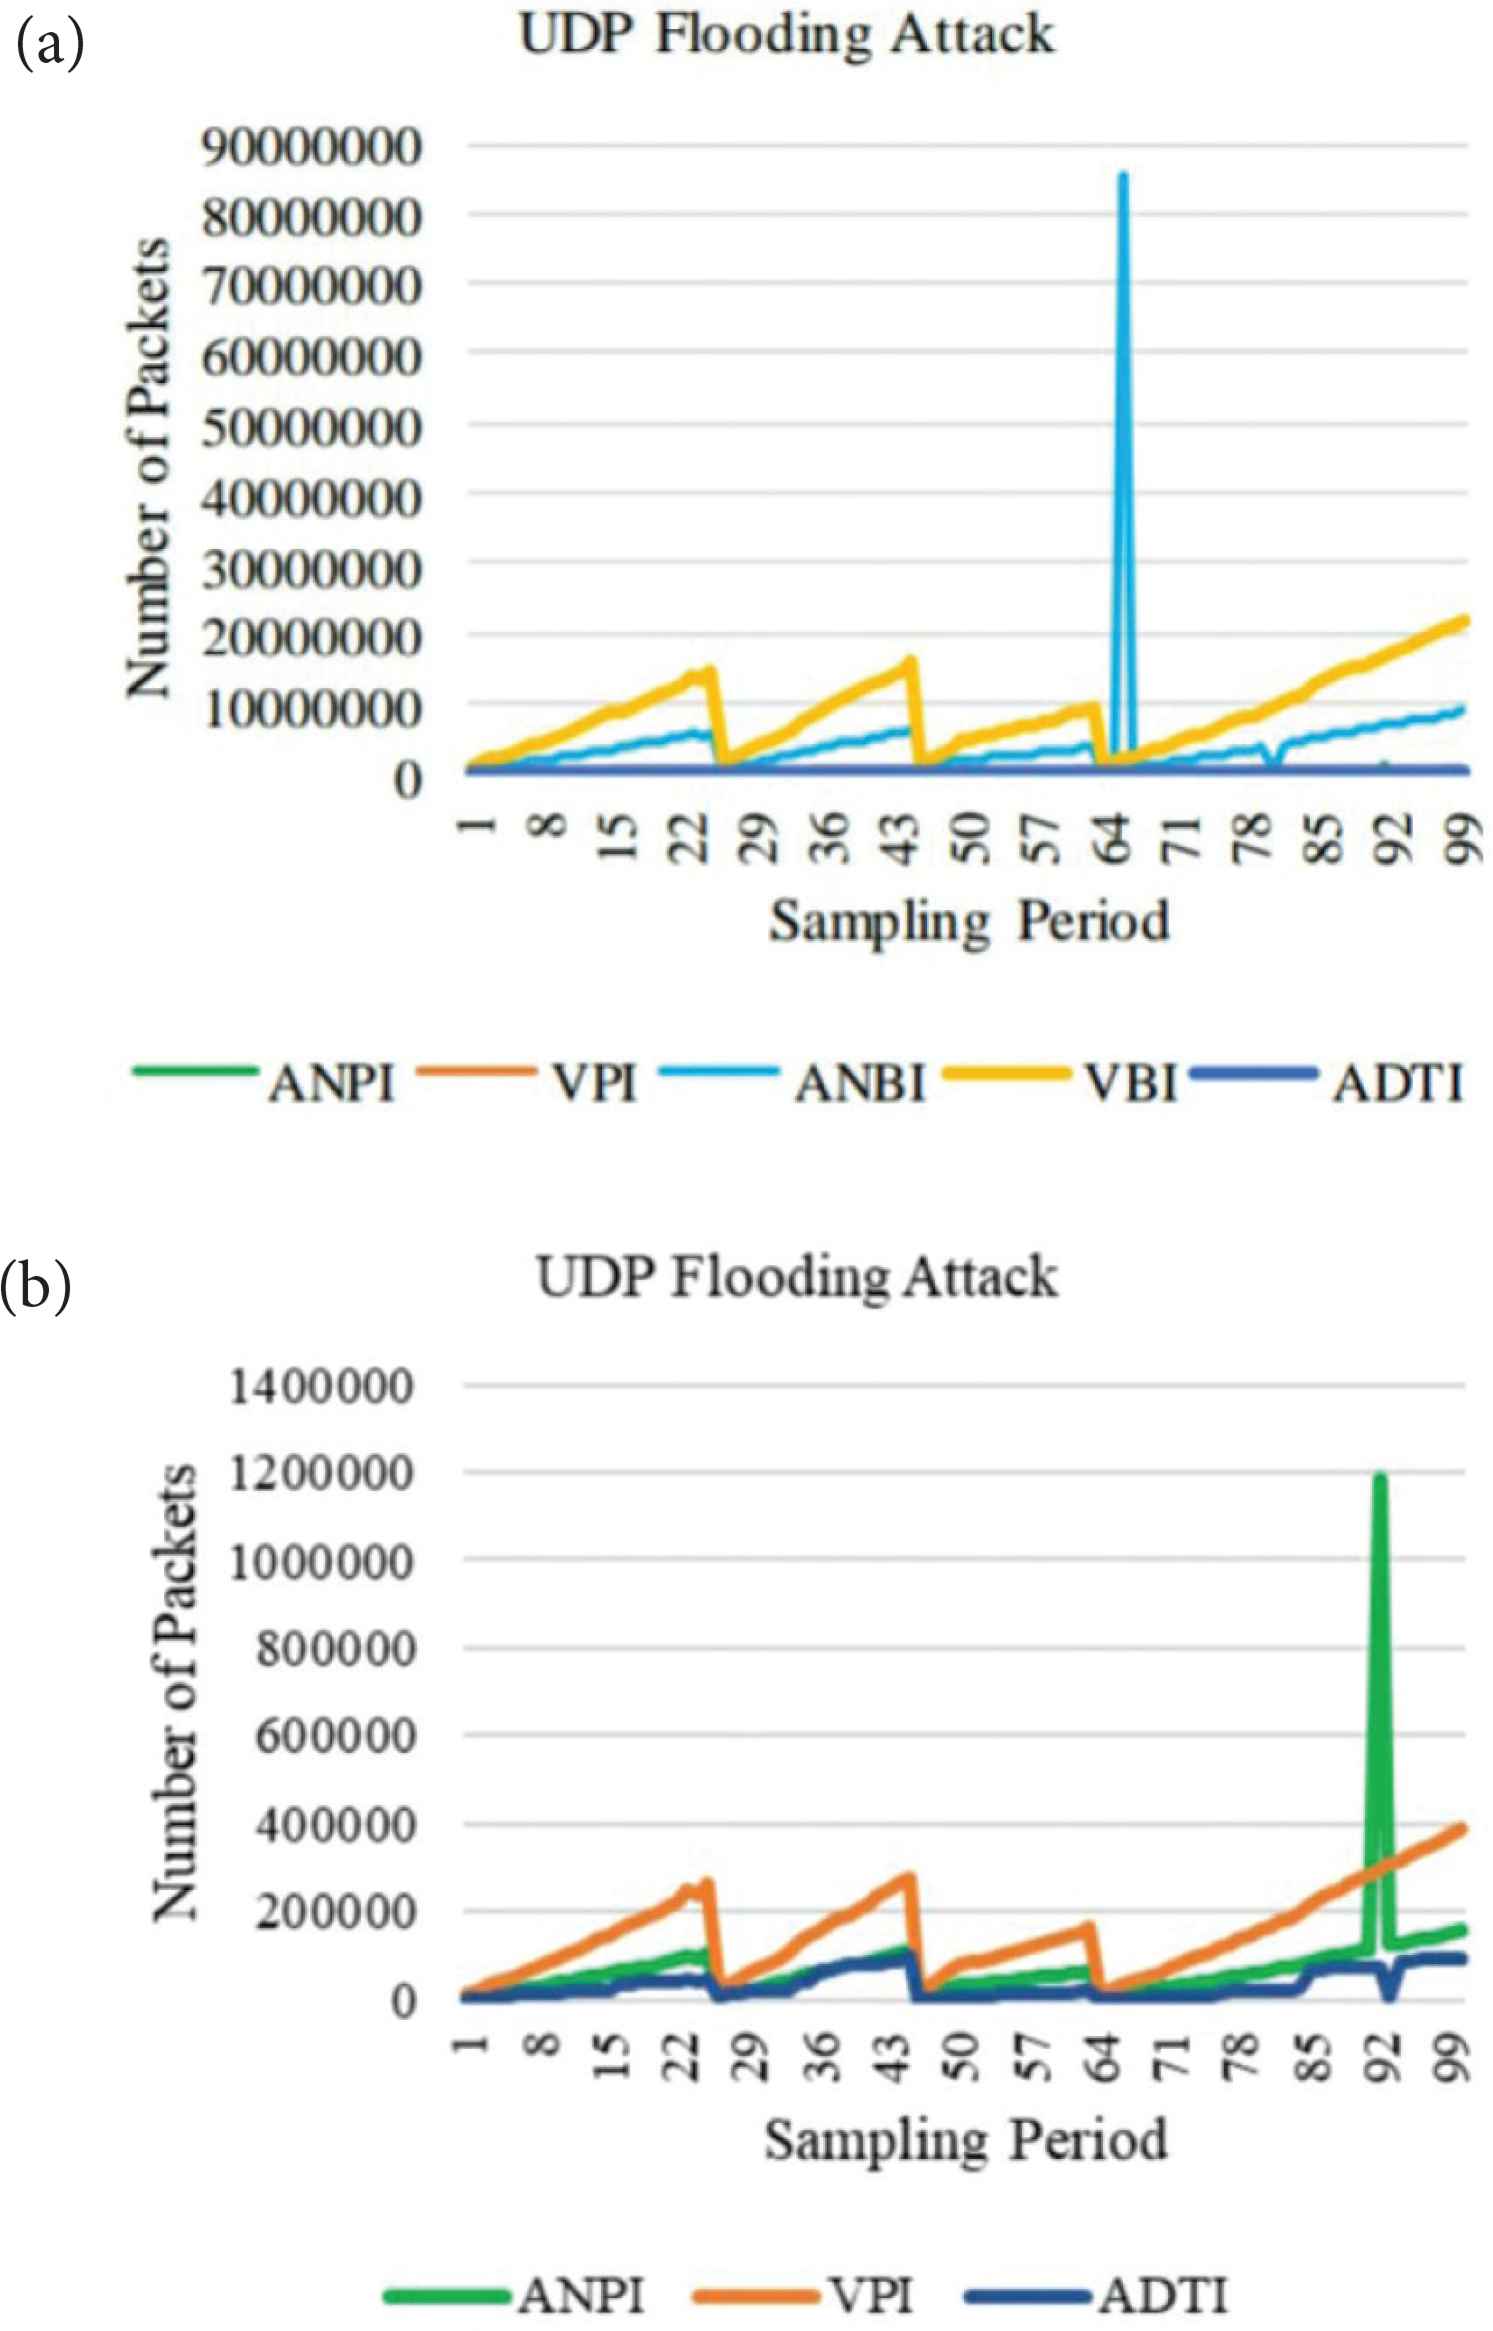
UDP Flooding attack of traffics features.
Under the UDP Flooding attack, the number of packets and the number of data bytes per flow are continuously increased and fluctuated due to a huge amount of attack traffics. The trend of the VPI and VBI features are similar because the attackers do not change the data significantly. They only need to consider the flooding of attack traffics. These two features curves are gradually fluctuated within the sampling period. The trends of the ANPI and ANBI features are very similar in traffics pattern. They are gradually fluctuated and sharply increased at the highest points. The trend of the ADTI feature is regularly fluctuated within the sampling period. The comparison of the traffics features for the SYN Flooding attack is shown in Figure 6.
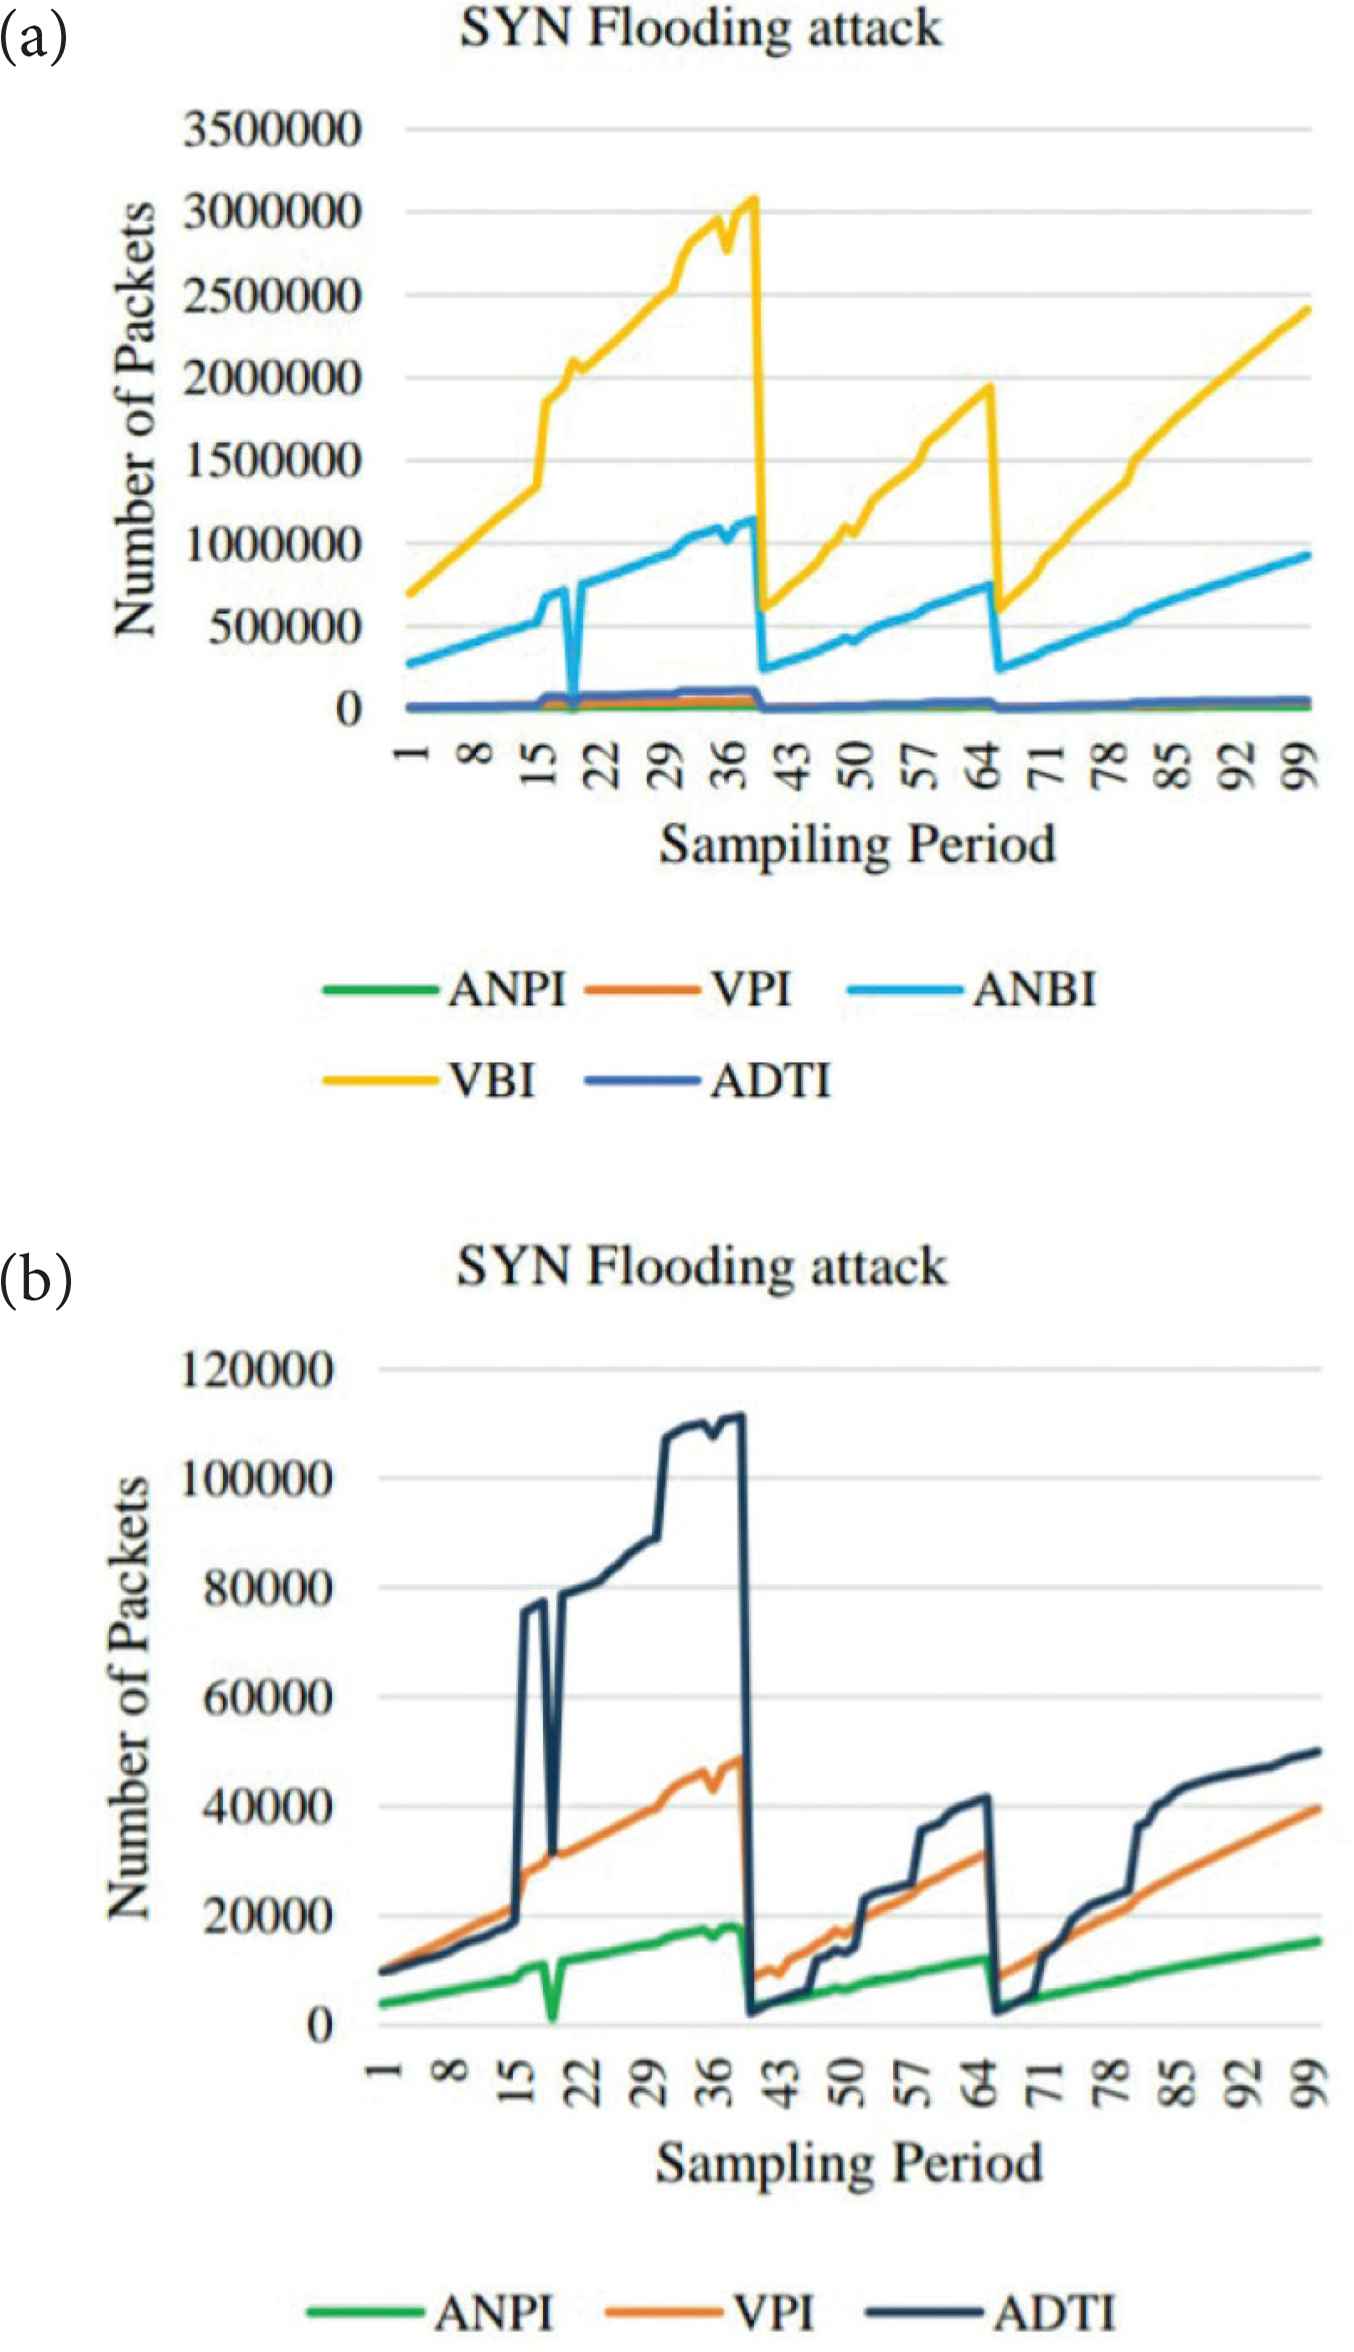
SYN Flooding attack of traffics features.
According to Figure 6, we can conclude that the trend of the curves for ANPI, VPI and ANBI features are similar. They are moderately fluctuated within the sampling period. The trends of the curves for ANPI and ANBI features have sharply dropped points. There is no sharply dropped point in VPI features. The trend of the curve for VBI features is dramatically increased and immediately dropped down to the original rate. The trend of the curve for ADTI features is similar to that of the VBI features. There are many significant dropped points for ADTI feature trend curve. The comparison of the traffics features for normal traffics is shown in Figure 7.

Normal traffics of traffics features.
According to Figure 7, all features of Normal traffics values are normally distributed. Therefore, their curves are regularly fluctuated. The trend of the ANPI, VPI and ANBI features cures are similar. They are regularly fluctuated in a normal condition. The trend of the VBI feature curve is regularly fluctuated and sometimes it reaches to the highest points. These cases can happen in every sampling period because the sender sends the large amount of packets but these are not malicious packets. The trend of the ADTI feature curve is moderately fluctuated and regularly up and down at a normal condition. Therefore, it can be concluded that the Normal traffics pattern of ANPI, VPI, ANBI and ADTI features are fluctuated. The traffics pattern of VBI features is gradually fluctuated and sometimes it reaches the highest points but the amount of variation is not significantly different.
5.2. Comparison for Evaluation of SDNTrafficsDS with KDDCUP99 Dataset
There are two comparison steps in this section. At the first step, the 10-fold cross-validation of the SDNTrafficsDS dataset are calculated. These datasets are used for both training and testing. The overall validation process and the evaluation score are shown in Table 1. According to Table 1, the overall precision rate (P), the overall recall rate (R) and the overall F1 score rate are 0.86, 0.85 and 0.94, respectively. At the second step, the 10-fold cross-validation of both SDNTrafficsDS and KDDCUP99 datasets are calculated. The SDNTrafficsDS is used as the training data and generated the model. This model is then tested with the KDDCUP99 dataset. The equal amount of testing data from the KDDCUP99 dataset is extracted. The overall validation process and the evaluation score are shown in Table 2. According to Table 2, the overall precision rate (P), the overall recall rate (R) and the overall F1 score rate are 0.87, 0.84 and 0.93, respectively. The validation score of the two tables are similar. Cross-validation procedure estimates the skill of the model on the new dataset. In this paper, the cross-validation method on our created dataset and KDDCUP99 dataset is calculated. It can be concluded that the effectiveness for our created dataset is 86% of precision, 85% of recall and 94% of F1 score rate.
| No. | Rate | TrainDS (%) | TestDS (%) | P | R | F1 score |
|---|---|---|---|---|---|---|
| 1 | 0.1 | 10 | 90 | 0.89 | 0.89 | 0.89 |
| 2 | 0.2 | 20 | 80 | 0.89 | 0.85 | 0.85 |
| 3 | 0.3 | 30 | 70 | 0.88 | 0.89 | 0.99 |
| 4 | 0.4 | 40 | 60 | 0.86 | 0.87 | 0.97 |
| 5 | 0.5 | 50 | 50 | 0.85 | 0.85 | 0.98 |
| 6 | 0.6 | 60 | 40 | 0.87 | 0.86 | 0.96 |
| 7 | 0.7 | 70 | 30 | 0.86 | 0.81 | 0.97 |
| 8 | 0.8 | 80 | 20 | 0.84 | 0.83 | 0.94 |
| 9 | 0.9 | 90 | 10 | 0.87 | 0.85 | 0.97 |
10-Fold cross-validation of SDNTrafficsDS
| No. | Rate | TrainDS (%) | TestDS (%) | P | R | F1 score |
|---|---|---|---|---|---|---|
| 1 | 0.1 | 10 | 90 | 0.88 | 0.88 | 0.90 |
| 2 | 0.2 | 20 | 80 | 0.89 | 0.83 | 0.95 |
| 3 | 0.3 | 30 | 70 | 0.87 | 0.88 | 0.98 |
| 4 | 0.4 | 40 | 60 | 0.85 | 0.85 | 0.89 |
| 5 | 0.5 | 50 | 50 | 0.86 | 0.84 | 0.97 |
| 6 | 0.6 | 60 | 40 | 0.88 | 0.85 | 0.95 |
| 7 | 0.7 | 70 | 30 | 0.87 | 0.85 | 0.97 |
| 8 | 0.8 | 80 | 20 | 0.82 | 0.81 | 0.89 |
| 9 | 0.9 | 90 | 10 | 0.89 | 0.84 | 0.95 |
10-Fold cross-validation of SDNTrafficsDS and KDDCUP99 dataset
6. CONCLUSION
Software defined networking has logically centralized and physically distributed nature. SDN has security vulnerabilities to allow some network attacks. Our previous works have proposed the model for detecting a DDoS attack on SDN. We observed and experienced from using the dataset for the SDN security vulnerability and detection. In this paper, we validated the feature dataset, SDNTraffficsDS using the 10-fold cross-validation techniques. In this validation, we have separated each group and calculated the evaluation score, precision, recall and F1-score. With the advantage of the cross-validation method, we can reduce the over fitting problem of the feature datasets. We have evaluated the cross-validation result of our created dataset and the KDDCUP99 dataset. According to the comparison results, the evaluation scores are similar. It can be concluded that our created dataset, SDNTrafficsDS, is 86% of precision, 85% of recall and 94% of F1 score rate. In our future work, we will detect a DDoS attack on a real SDN network implementation. We will mitigate the flooding based DDoS attack by using a light weight method.
CONFLICTS OF INTEREST
The authors declare they have no conflicts of interest.
ACKNOWLEDGMENTS
We may express the thankful to our scholarship program. Our work was financially supported by the
REFERENCES
Cite this article
TY  - JOUR
AU  - Myo Myint Oo
AU  - Sinchai Kamolphiwong
AU  - Thossaporn Kamolphiwong
AU  - Sangsuree Vasupongayya
PY  - 2020
DA  - 2020/04/09
TI  - Analysis of Features Dataset for DDoS Detection by using ASVM Method on Software Defined Networking
JO  - International Journal of Networked and Distributed Computing
SP  - 86
EP  - 93
VL  - 8
IS  - 2
SN  - 2211-7946
UR  - https://doi.org/10.2991/ijndc.k.200325.001
DO  - 10.2991/ijndc.k.200325.001
ID  - Oo2020
ER  -