
Extraction of Characteristics of Time in “Tree Hole” Data
 , Shaofu Lin2, Zhisheng Huang3
- DOI
- 10.2991/jaims.d.201209.001How to use a DOI?
- Keywords
- Depression; Microblog; Tree hole; Knowledge graph; Time characteristics; Rescue
- Abstract
Statistics show that 15 percent of depressed people died by suicide, and more than 50 percent of depressed people are thinking about suicide. Worldwide, depression has become the second leading cause of death among people aged 15–29. This paper focus on the “tree hole” message data on microblog, and conducts data visualization research from different granularity, such as quarter, month, and analyses activity of message during holiday based on the knowledge graph, so as to obtain the national time distribution characteristics of the potential risk of mental health for the reference of social institutions’ monitoring and rescue and government departments’ decision-making. According to the time distribution rule of “tree hole” data, the relatively high occurrence time and possible reasons for depression and suicide are found, so that manpower could be reasonably deployed for effective prevention and rescue.
- Copyright
- © 2021 The Authors. Published by Atlantis Press B.V.
- Open Access
- This is an open access article distributed under the CC BY-NC 4.0 license (http://creativecommons.org/licenses/by-nc/4.0/).
1. INTRODUCTION
Depression is a kind of common mental disease. The patients are depressed and lose interest or enjoyment. Depression seriously affects the work, learning ability, or daily-life ability of individuals and even leads to suicide. According to the survey report of the World Health Organization, the number of suicides due to depression is estimated to be as high as 1 million every year in the world. Depression is the primary cause of morbidity and disability for adolescents, and has become the second leading cause of death for the population aged 15–29. Research shows that depressed patients are reluctant to seek help in life, but they are more likely to reveal depression tendencies or suicide intention in daily speech [1]. Young people are the main users of social tools such as microblog. Most of them express their feelings and suicidal wishes through microblog. Therefore, the research and analysis of online microblog data can help us to find suicidal tendencies and carry out timely and effective rescue.
In March 2012, a user left a suicide message on the microblog. Since then, most people left messages under the microblog, including some patients with depression and suicidal thoughts. The microblog has become a “tree hole,” which allows people to talk about their feelings or suicide messages. This paper takes the data of “tree hole” as the object of research, and analyzes the time distribution of the “tree hole” group in the nearly 7 years from 2012 to 2019 with time visualization nationwide. The time ontology of holidays is established based on knowledge graph technology, and the influence of some holidays on message activity is studied and analyzed, so as to provide monitoring and rescue for social organizations and decision-making reference for government departments.
The term “Knowledge Graph” is widely used to refer to a large-scale semantic network consisting of entities and concepts as well as the semantic relationships among them, using representation languages such as Resource Description Framework (RDF) and RDF Schema [2]. Such knowledge graphs are used in the construction of many knowledge-based applications in medicine: extracting information from patient records [3], support for co-morbidity analysis [4], and many others. In this paper, the knowledge graph of holidays is constructed to facilitate the statistics of the active degree of messages left during holidays. Holidays refer to the legal holidays of Chinese people, including Chinese and Western festivals. There are some traditional and fixed festivals. This paper focuses on the active time of online potential depression patients, in order to obtain the time distribution characteristics of potential mental health risks, and to provide help and basis for rescue and research and treatment of depression patients.
2. RELATED WORK
Based on the survey of depression, all aspects of work are relatively mature at present. Through a long-term study, Jinlin You, found that the first year and the third year of university are the high incidence periods of depression [5]. In discussion on the relationship between “HeYi” lesion time and the onset time of depression in Mongolian medicine, the study analyzes and discusses the time rule of “ZhenHeYi” in the treatment of depression [6]. Although there have been a lot of achievements in related research, most researchers only conduct research and analysis based on offline data, and there are relatively few researches on depressive suicide with online netizens as the main body. There are gaps in the data because some patients don’t actively seek medical treatment. The knowledge graph has been used in depression research, for example, building knowledge graph of depressive disorders and integrating knowledge of adverse reactions with antidepressants [7]. Integration of depression knowledge and data, to provide support for solving clinical problem and browsing knowledge [8]; however, there are few related results in this area, and there is no knowledge graph on the research of time characteristics of depression.
Given the problem of insufficient online data and the knowledge graph not being applied in the time feature, this paper takes the young netizens as the main body to study and extract the “tree hole” data of microblog, most of which were sent by people with depressive suicide. Based on these online data, the knowledge graph of holidays is constructed and conducted the analysis of the time of depressive suicide. The paper “Time Characteristics of Suicide in the Social Media Information” is based on this kind of data to study the impact of holidays and major activities on depressive suicide [9]. Differently, this paper not only studies holidays and festivals based on knowledge graph, but also analyzes the time characteristics of depressive suicidal behaviors according to different time granularity of season and month.
3. THE CONTENT OF RESEARCH
3.1. Data Processing
A senior girl with the nickname “Zou Fan” in microblog committed suicide after suffering from depression in the early morning of March 17, 2012. On March 18, she sent a message via a regular time machine, since then, the microblog became a “tree hole,” in which many people expressed their feelings. By the beginning of July 2019, 1.54 million messages had been left. The paper analyzes the message data for the past seven years. The research process includes data-crawling, data-preprocessing, statistical calculation, and visual presentation.
The data were crawled out of the “tree hole” of microblog by Python language and compiler tools. The original data mainly includes the release time, microblog ID, user name, comment content, etc. Because this paper focuses on the study of time distribution, and does not consider the space for the moment, so the program mainly grabs the time information, there are no regions and provinces in the original data. Due to user privacy, the microblog ID and user name will not be displayed (as shown in Table 1). The crawled data is transformed and cleaned by Python language to remove useless and duplicate data; time is separated and sorted to obtain the processed data (as shown in Table 2). The useless and duplicate data refers to incomplete user information and data repeatedly captured in the process of crawling.
| Date | Microblog ID | User Name | Comment Content |
|---|---|---|---|
| 2018-10-1 00:00 | Anonymous | Anonymous | Fan, I need relief |
| 2018-10-1 00:18 | Anonymous | Anonymous | I want to die |
The original data
| Date | Time | Microblog ID | User Name | Comment Content | Province | City/District |
|---|---|---|---|---|---|---|
| 2018-10-1 | 00:00 | Anonymous | Anonymous | Fan, I need relief | Beijing | Chaoyang district |
| 2018-10-1 | 00:18 | Anonymous | Anonymous | I want to die | Shanghai | Jingan district |
The processed data
After data cleaning and processing, the data are processed again according to different granularity of quarter, month, etc. Among them, taking the month as the unit, removed the repeated messages of users in each month, the 1.54 million message data will be cleaned into 484235 data (person-time). Finally, charts will show the result according to different categories.
3.2. Designing Knowledge Graph
Based on common techniques, we will construct knowledge graphs into RDF graphs. Formally, an RDF graph is a collection of triples < hs, p, oi, > each consists of a subject s, a predicate p, and an object o. Each triple represents a statement of a relationship p between the things denoted by the nodes s and o that it links. The identifiers for p, s, and o are uniform resource identifiers (URIs), allowing triples in one knowledge graph to refer to elements in another knowledge graph that reside in a physically different location. While an object represented by a URI’s can themselves be the subject of other triples (resulting in a graphical structure), the literals cannot be themselves the subject of other triples. In conclusion, let U be the set of all URI, and L be the set of all literals. A knowledge graph K can be defined as a set of three-place tuples < hs, p, oi, > with s, p ∈ U, and o ∈ U ∪L.
In this paper, information related to Chinese traditional holidays is collected to construct an RDF graph, the time, and common names of holidays are described in the form of triples. The languages RDF and RDF schema assign a fixed semantics to some of the predicates p. As part of the ontology architecture used in this article:
rdfs:subClassOf a rdf:Property;
rdfs:isDefinedBy <http://www.w3.org/2000/01/rdf-schema#>;
rdfs:label “subClassOf";
rdfs:comment “The subject is a subclass of a class.";
rdfs:range rdfs:Class;
rdfs:domain rdfs:Class.
Among them, “rdfs:subClassOf” to denote (transitive) containment of subclasses, “rdfs:domain” and “rdfs:range” to denote membership of any subject respectively object of a given predicate to a specified type. These (and other) predefined predicates allow for automatic inference of additional triples from a given knowledge graph.
Taking “Spring Festival” as an example,
treehole: HT0212103 rdf: subClassOf “节日".
treehole: HT0212103 sct: hasChinesePreferredLabel “春节".
treehole: HT0212103 sct: hasChineseLabel “新年".
treehole: HT0212103 rdf: label “Chinese New Year"@en.
treehole: HT0212103 sct: hasYear
“2018”|<http://www.w3.org/2001/XMLSchema#integer>.
treehole: HT0212103 sct: hasMonth
“2”|<http://www.w3.org/2001/XMLSchema#integer>.
treehole: HT0212103 sct: hasDay
This example shows the use of name space abbreviations, writing rdf: subClassOf instead of http://www.w3.org/2000/01/rdf-schema#subClassOf. These triples state that treehole: HT0212103 is an instance of the concept “节日” (holiday) with the given several common titles (second, third, fourth triple) and the date (fifth, sixth, seventh triple).
Here, holidays are mapped to the corresponding web pages of http://www.ztonebv.com through common name semantics, while other information is supplemented to achieve semantic integration of the temporal knowledge graph of depression. The sparql language can be used to query, such as the second half of the query holiday:
PREFIX…
select ?holiday ?month
where { ?s sct: hasMonth ?month.
FILTER (?month > 6)
?s sct: hasChinesePreferredLabel ?holiday.
}
4. DATA ANALYSIS
In the process of data analysis, the activity of messages left during holidays is calculated with the help of knowledge graph, and charts are made with Excel spreadsheet tools and visual tools. The results have three different dimensions—season, month, and holiday, which are obtained respectively, lead to the interpretation of phenomenon and correlation factor analysis.
4.1. Data Analysis by Season
Figure 1 is based on the seasonal division of “tree hole” data from March 2012 to July 2019. Due to the large influence of “Zou Fan” event in March 2012 and 2013, the data has little reference value and is not convincing enough. In 2019, there are only complete data from January to June, so the research focuses on 2014 to 2018. According to Figure 2, from 2014 to 2018, the number of patients in autumn and winter is more than that in spring and summer in four years; therefore, we can infer the following information: the number of patients in autumn and winter is higher than that in spring and summer, and the number of patients in autumn and winter is generally higher, which is the high incidence season of depression.
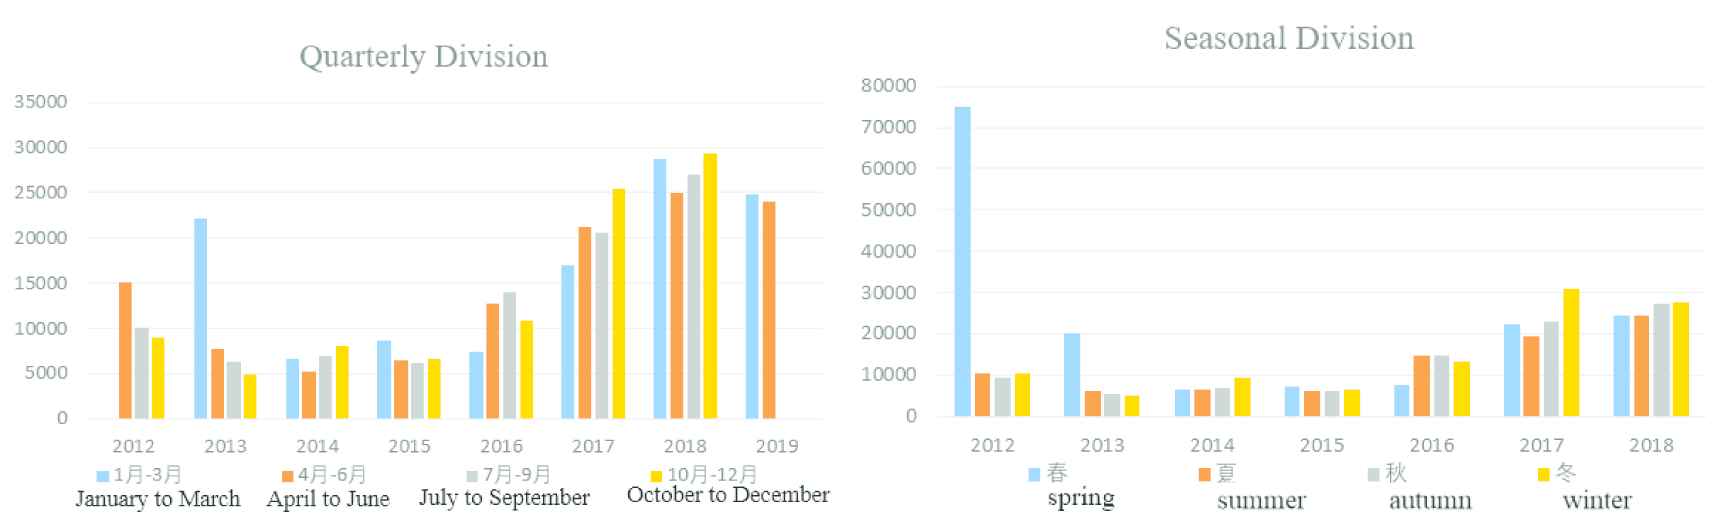
Statistical chart of “Tree Hole” data by season.
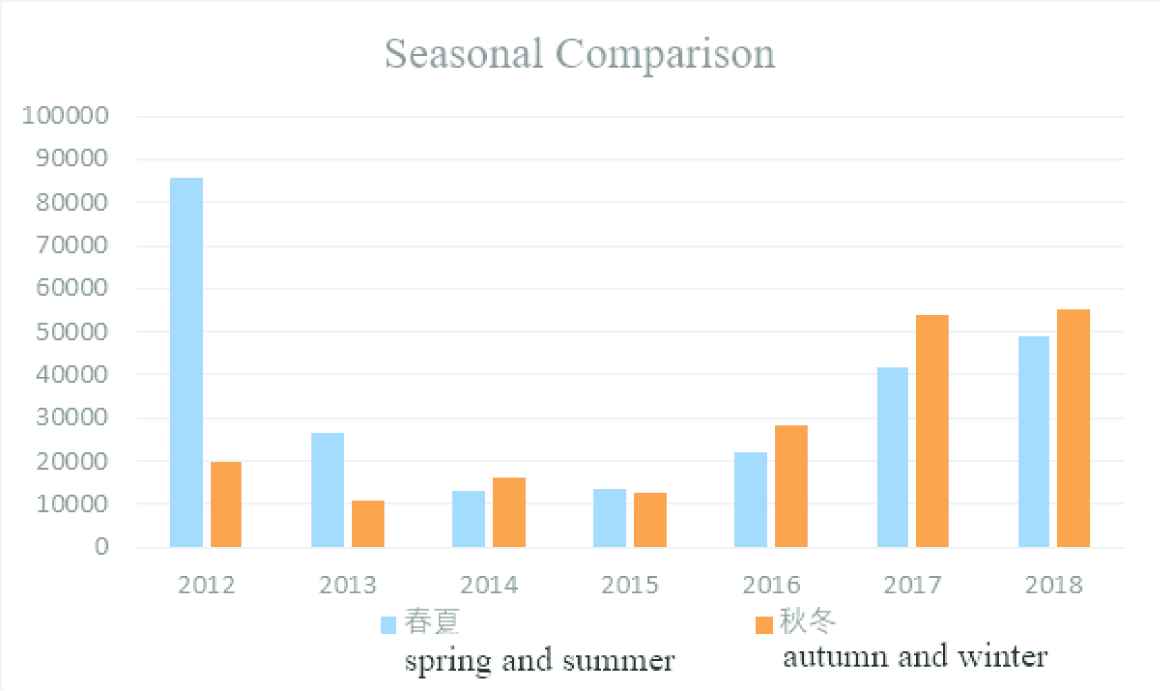
Chart of statistical comparison with season.
The research and clinical practice show that the incidence of depression in the whole autumn and winter season from September to January of the next year is more than that in spring and summer, and it shows an upward trend before and after [10]. Depression has its seasonal characteristics, because from summer to autumn, there is less sunlight, the body’s biological clock does not adapt to the change of short sunshine time, resulting in physiological rhythm disorder and endocrine disorder, so there is a disorder of mood and mental state, so autumn and winter is the high incidence period of depression [6]. This is mutually confirmed with the above figure, indicating that environmental factors are also one of the causes of depression.
4.2. Data Analysis by Month
The statistical results in months are consistent with those in years. From 2012 to 2015, they basically decreased month by month, and from 2016 to 2018, they basically increased. However, it can be seen in Figure 3 that the number of people fluctuates a lot in several months. After searching for relevant information, the following explanation is made.
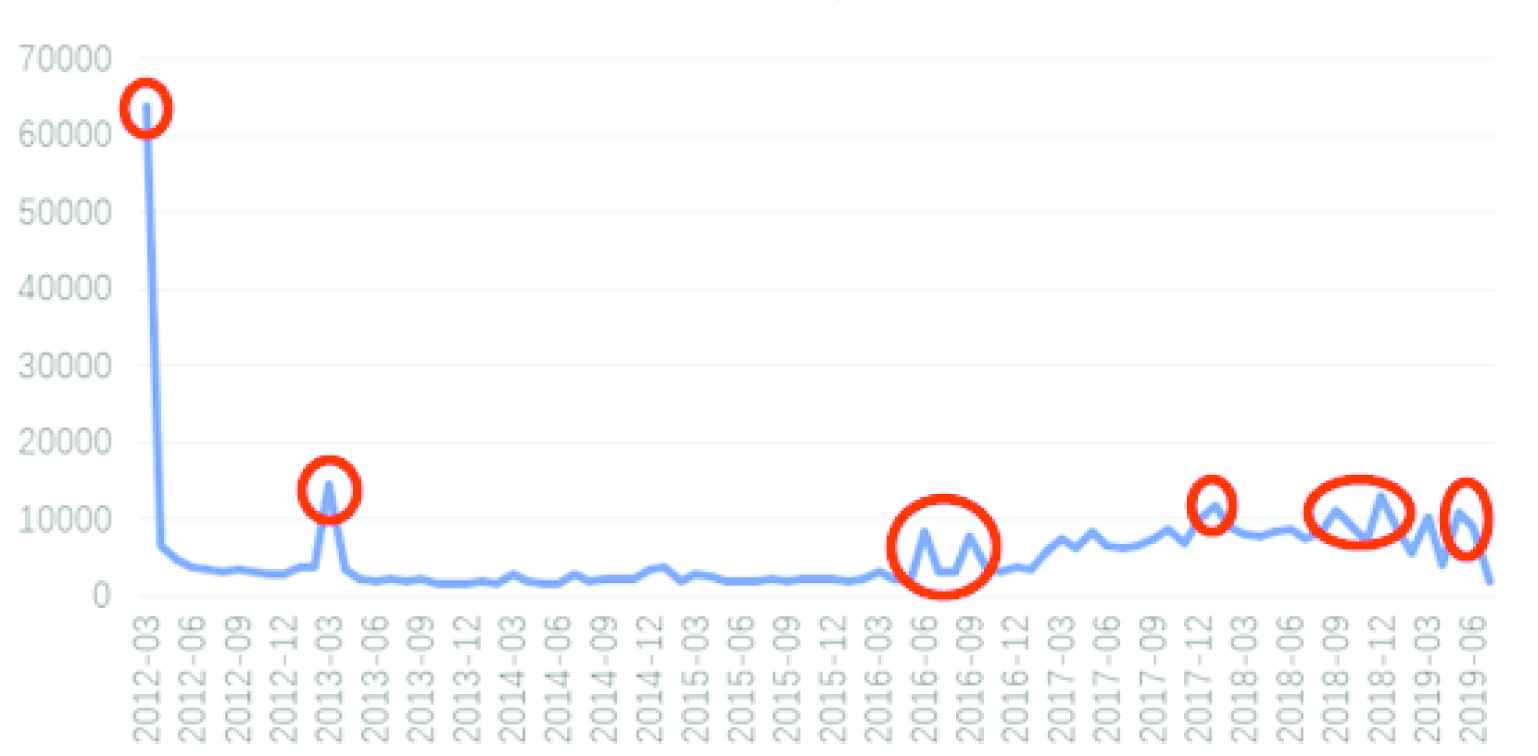
Statistical results of “Tree Hole” data in months.
In March 2012, the number of people reached a peak, which may be due to the huge sensation caused by suicide message of “Zou Fan” in this month, and people began to leave messages on her microblog ID; in March 2013, the number of people fluctuated significantly, which may be due to the abnormal increase in the number of messages on the first anniversary of her death.
In June and September 2016, the number of people fluctuated significantly. The possible reasons: on June 10, the netizen with the nickname of “Pu Erding” was rescued after his suicide message was left, which attracted wide attention of netizens and significantly increased the number of comments; in September 2016, the star Kimi’s suicide caused wide attention and increased the sadness of depressed patients.
The number of people fluctuated greatly in December 2017 and January 2018. The possible reasons are that Korean stars Kim Jonghyun and Tian Taisui suicided respectively in December 2017 and January 2018 due to depression, which caused a lot of attention, and increased the sense of depression.
In September and December 2018, the number of people fluctuated greatly. The possible reasons are that in September 2018, a female netizen was photographed to commit suicide by jumping off a cliff in Mount Emei, and the video was widely spread on the Internet. In the suicide note, she said that she was suffering from depression. In December of the same year, “lonely wind of travel” left a message to commit suicide, which was confirmed to be dead by the police. The netizen was deeply touched. Soon, the user of microblog “Zou Fan” appeared in the hot search list of the day.
In May 2019, the number of people fluctuated greatly, which may be due to the following reason: Koo Ha Ra, who is Korean pop star, was rescued after attempting suicide in May 2019. The incident became a hot search on microblog, attracting a large number of netizens and increasing depression.
The time of occurrence of these events is consistent with the time of an abnormal increase in the number of people. We may speculate that the social environment will induce the incidence of depression patients [11], especially the negative report related to depression patients.
4.3. Analysis of the Activity of Message During Holidays
This paper selects several important festivals with Chinese characteristics, and makes statistical analysis based on holiday knowledge graph, including: “New Year,” “Spring Festival,” “Valentine’s Day,” “Tomb-sweeping Day,” “Hungry Ghost Festival,” “Mid-Autumn Festival,” “Chinese National Day,” etc. These festivals are compared with the average of a usual day (a month before and after the festival or major event) to study if there is a significant difference. Firstly, we look at the difference between “New Year” and the usual day.
It can be seen from Table 3 that New Year has a great influence on the activity of “tree hole,” the average increase is 33.82%. A possible explanation for it is that the alternations of the old year and the new year increase depression. From the information of the tree hole, we also see a lot of sad expressions. That suggests our rescuers need to devote 33% more of their manpower to the rescue during the New Year.
| Year | New Year | Usual Day | Diversity (%) |
|---|---|---|---|
| 2013 | 314 | 215 | 31.53 |
| 2014 | 187 | 127 | 32.09 |
| 2015 | 282 | 203 | 28.01 |
| 2016 | 284 | 179 | 36.97 |
| 2017 | 857 | 616 | 28.12 |
| 2018 | 3117 | 1678 | 46.17 |
| 2019 | 1945 | 1331 | 31.57 |
| Average value | 998 | 621 | 33.49 |
The difference between “New Year” and usual day
It can be seen from Table 4, the annual Spring Festival has only a small change, but in 2019, the activity of “tree hole” decreased significantly. The average increase is 5.77%. The explanation for this is that the Spring Festival is a relatively happy and warm holiday, reunions, and celebration with family to some extent reducing depression.
| Year | Spring Festival | Usual Day | Diversity (%) |
|---|---|---|---|
| 2013 | 275 | 235 | 14.55 |
| 2014 | 154 | 127 | 17.53 |
| 2015 | 221 | 212 | 4.07 |
| 2016 | 215 | 188 | 12.56 |
| 2017 | 746 | 615 | 17.56 |
| 2018 | 1956 | 1613 | 17.54 |
| 2019 | 550 | 789 | −43.45 |
| Average value | 588 | 540 | 5.77 |
The difference between “Spring Festival” and usual day
From the data of valentine’s day in Table 5, it can be seen that the activity degree of “tree hole” has decreased considerably. In 2015, the activity of “tree hole” decreased significantly (−48.64). A possible explanation for this phenomenon is that during valentine’s day, when most people are immersed in sweet love, the sadness of depression also decreases. This suggests that our rescue workers can arrange for a small amount of manpower during valentine’s day.
| Year | Valentine’s Day | Usual Day | Diversity (%) |
|---|---|---|---|
| 2013 | 230 | 236 | −2.61 |
| 2014 | 136 | 145 | −6.62 |
| 2015 | 148 | 220 | −48.64 |
| 2016 | 213 | 219 | −2.82 |
| 2017 | 537 | 785 | −46.18 |
| 2018 | 1505 | 1613 | −7.18 |
| 2019 | 724 | 789 | −8.98 |
| Average value | 499 | 572 | −17.58 |
The difference between “Valentine’s Day” and usual day
It can be seen from Table 6 that Tomb-sweeping Day also has a great influence on the activity of “tree hole.” In 2017, the activity of Tomb-sweeping Day increased to 29.02%. But in 2018, the activity of Tomb-sweeping Day is basically the same as usual. The possible explanation for this phenomenon is that in this special festival, the association with the dead increases the sadness of the depressed. This suggests that our rescuers should invest at least 15% more manpower to rescue during the Tomb-sweeping Day.
| Year | Tomb-sweeping Day | Usual Day | Diversity (%) |
|---|---|---|---|
| 2013 | 368 | 325 | 11.68 |
| 2014 | 194 | 170 | 12.37 |
| 2015 | 252 | 179 | 28.97 |
| 2016 | 256 | 237 | 7.42 |
| 2017 | 1768 | 1255 | 29.02 |
| 2018 | 1273 | 1228 | 3.53 |
| Average value | 783 | 566 | 15.50 |
The difference between “Tomb-sweeping Day” and usual day
From the data in Table 7, it can be seen that the influence of Hungry Ghost Festival on the activity of “tree hole” is increasing year by year, from 2013 to 2017. It’s not clear why activity increased significantly in 2012. But overall, the activity of “tree hole” on Hungry Ghost Festival is decreasing.
| Year | Hungry Ghost Festival | Usual Day | Diversity (%) |
|---|---|---|---|
| 2012 | 424 | 247 | 41.75 |
| 2013 | 159 | 189 | −18.87 |
| 2014 | 174 | 195 | −12.07 |
| 2015 | 155 | 168 | −8.39 |
| 2016 | 330 | 344 | −4.24 |
| 2017 | 1127 | 1174 | −4.17 |
| 2018 | 1064 | 1160 | −9.02 |
| Average value | 491 | 497 | −2.14 |
The difference between “Hungry Ghost Festival” and usual day
It can be seen from Table 8 that the Mid-Autumn Festival has different effects on the activity of “tree hole.” In 2015, the activity of the Mid-Autumn Festival reached 26.40%, and in 2016, the activity of “tree hole” on the Mid-Autumn Festival decreased greatly (− 36.83). But the average activity increased.
| Year | Mid-Autumn Festival | Usual Day | Diversity (%) |
|---|---|---|---|
| 2012 | 255 | 263 | −3.14 |
| 2013 | 205 | 155 | 24.39 |
| 2014 | 236 | 191 | 19.07 |
| 2015 | 250 | 184 | 26.40 |
| 2016 | 315 | 431 | −36.83 |
| 2017 | 1486 | 1283 | 13.66 |
| 2018 | 1334 | 1316 | 1.35 |
| Average value | 583 | 546 | 6.41 |
The difference between “Mid-Autumn Festival” and usual day
From the data in Table 9, it can be seen that the activity of tree holes on the Chinese National Day has greatly weakened. The possible explanation for this phenomenon is that everyone celebrates the birthday of the motherland, and the joy greatly reduces depression. This suggests that our rescuers can arrange a small amount of manpower during the Chinese National Day.
| Year | Chinese National Day | Usual Day | Diversity (%) |
|---|---|---|---|
| 2012 | 188 | 262 | −39.36 |
| 2013 | 141 | 143 | −1.42 |
| 2014 | 175 | 191 | −9.14 |
| 2015 | 176 | 176 | 0 |
| 2016 | 451 | 583 | −29.27 |
| 2017 | 1263 | 1283 | −1.58 |
| 2018 | 1125 | 1334 | −18.58 |
| Average value | 503 | 567 | −14.19 |
The difference between “Chinese National Day” and usual day
5. CONCLUSION AND FUTURE WORK
This study makes a detailed temporal visualization and analysis of the data in online microblog, interprets the phenomenon, and analyzes the related factors. According to the analysis results, we draw the following conclusions:
Autumn and winter are a period of a high incidence of “tree hole” users to leave messages actively including depression and suicide or potential victims, which should be paid attention to and deploy more manpower for monitoring and rescue. In the case of suicide or other negative reports of depression patients, emotional resonance of “tree hole” users including depression and suicide, or potential victims will be aroused, and the relevant message information will be increased. So in this period, it is necessary to strengthen the monitoring of online messages. New Year, Spring Festival, Tomb-sweeping Day, Mid-Autumn Festival will increase the activity of “tree hole.” We should strengthen the monitoring of message information and allocate more manpower to rescue suicides.
According to these results and conclusions, we can reasonably and effectively arrange manpower and monitor to rescue in terms of time, improve rate of rescue, and rescue more suicides. However, this paper only analyzes the time, and the results are limited. So, in the next step, temporal analysis and spatial analysis can be combined to carry out more efficient and accurate monitoring and rescue based on knowledge graph and spatial-temporal distribution characteristics.
CONFLICTS OF INTEREST
The Authors do not have any conflict of interest to declare.
REFERENCE
Cite this article
TY  - JOUR
AU  - Xiaomin Jing
AU  - Shaofu Lin
AU  - Zhisheng Huang
PY  - 2020
DA  - 2020/12/14
TI  - Extraction of Characteristics of Time in “Tree Hole” Data
JO  - Journal of Artificial Intelligence for Medical Sciences
SP  - 43
EP  - 48
VL  - 1
IS  - 3-4
SN  - 2666-1470
UR  - https://doi.org/10.2991/jaims.d.201209.001
DO  - 10.2991/jaims.d.201209.001
ID  - Jing2020
ER  -