
Temporal Aspects of Tree Hole Data
- DOI
- 10.2991/jaims.d.210604.001How to use a DOI?
- Keywords
- Tree hole; Suicide assistance; Temporal aspects
- Abstract
At present, adolescent suicide becomes a serious social problem. Many young people express suicidal thoughts through online social media. Weibo is a famous social media platform for real-time information sharing in China. When a Weibo user committed suicide, many other users continued to post information on this Weibo. Such a space is often called a “tree hole.” By analyzing the temporal aspects of tree hole data, we can understand the behavioral characteristics of suicide attempters and provide more valuable information for suicide assistance. This paper will introduce the analysis of temporal characteristics of tree hole data and guide suicide assistance through suicide monitoring and early warning based on these time characteristics.
- Copyright
- © 2021 The Authors. Published by Atlantis Press B.V.
- Open Access
- This is an open access article distributed under the CC BY-NC 4.0 license (http://creativecommons.org/licenses/by-nc/4.0/).
1. INTRODUCTION
Suicide is a serious social problem. In China, about 250,000 people die by suicide every year, and about 2 million people attempt to commit suicide. Suicide has become the fifth leading cause of death in China [1]. With the development of the Internet, people with suicidal tendencies are willing to vent their emotions on social media, such as Weibo. Weibo is a broadcast social media and network platform in China, which can share short and real-time information through its attention mechanism. It is one of the important channels for teenagers to express their personal feelings, and has the characteristics of anonymity and real time. Many young people will express their suicidal thoughts and wishes through online media [2]. The expression of online suicide intention has gradually become a serious mental health and public health problem [3], such as the QQ suicide group [4] (an online chat group focusing on suicide discussion, whose data only comes from friends chatting and cannot be obtained), suicide appointment on Weibo, suicide broadcast on Internet, suicide appointment on Channel-2 website in Japan [5], etc. By analyzing the relevant information on these social media, it will be easier to find suicide attempts, carry out online rescue or find the information of their families, relatives, and friends or organizations, and then give early warning to these relevant personnel to prevent suicide.
The word “tree hole” comes from a famous fairy tale called “The Emperor Has Donkey Ears” [6]. When a Weibo user expresses a desire to die by suicide, it will arouse the resonance of many other users, and then the user’s Weibo message area will receive messages continuously, which will become a place to confide secrets, which is called “tree hole.” Analyzing the time characteristics of information in tree holes is helpful to understand the behavioral characteristics of suicide attempters, provide valuable information for suicide rescue, and play a guiding role in suicide early warning and intervention.
2. TREE HOLE DATA AND ITS TEMPORAL CHARACTERISTICS
Research by Huang Zhi-sheng et al. [7] shows that since the blogger committed suicide on March 18, 2012, there have been more than 1 million messages in the biggest tree hole on Sina Weibo, which contains many messages of suicide attempts every day. We analyze the time characteristics of the data from 2013 to 2018 and the first seven months of 2019 and 2020, hoping to find out the temporal distribution characteristics of possible suicide groups and provide reference opinions for the rescue of suicide groups.
2.1. The Time Distribution of 24 Hours
The dynamics of time distribution is shown in Figure 1. This reflects the number of messages in the tree hole in each time period. The more news, the more active the tree hole is. It can be found that the most active time of tree hole is from 8:00 p.m. to 2:00 a.m., accounting for 44.74% of the tree hole data. Almost half of the tree hole information occurred in these six hours. It is worth noting that most of these six hours are when people need rest most. This time characteristic also proves the necessity and effectiveness of using artificial intelligence technology to monitor network suicide. Only the computer system can monitor the tree hole all day without the interference of time period. In case of emergency, special warnings should be given to the personnel of relevant departments so as to take emergency rescue actions. After 2:00 a.m., the activity began to weaken, reached a low tide at 6:00 a.m., and then gradually increased. At noon (10:00 a.m. to 1:00 p.m.), there was a short active period in the tree hole, which gradually became active until 8:00 p.m.
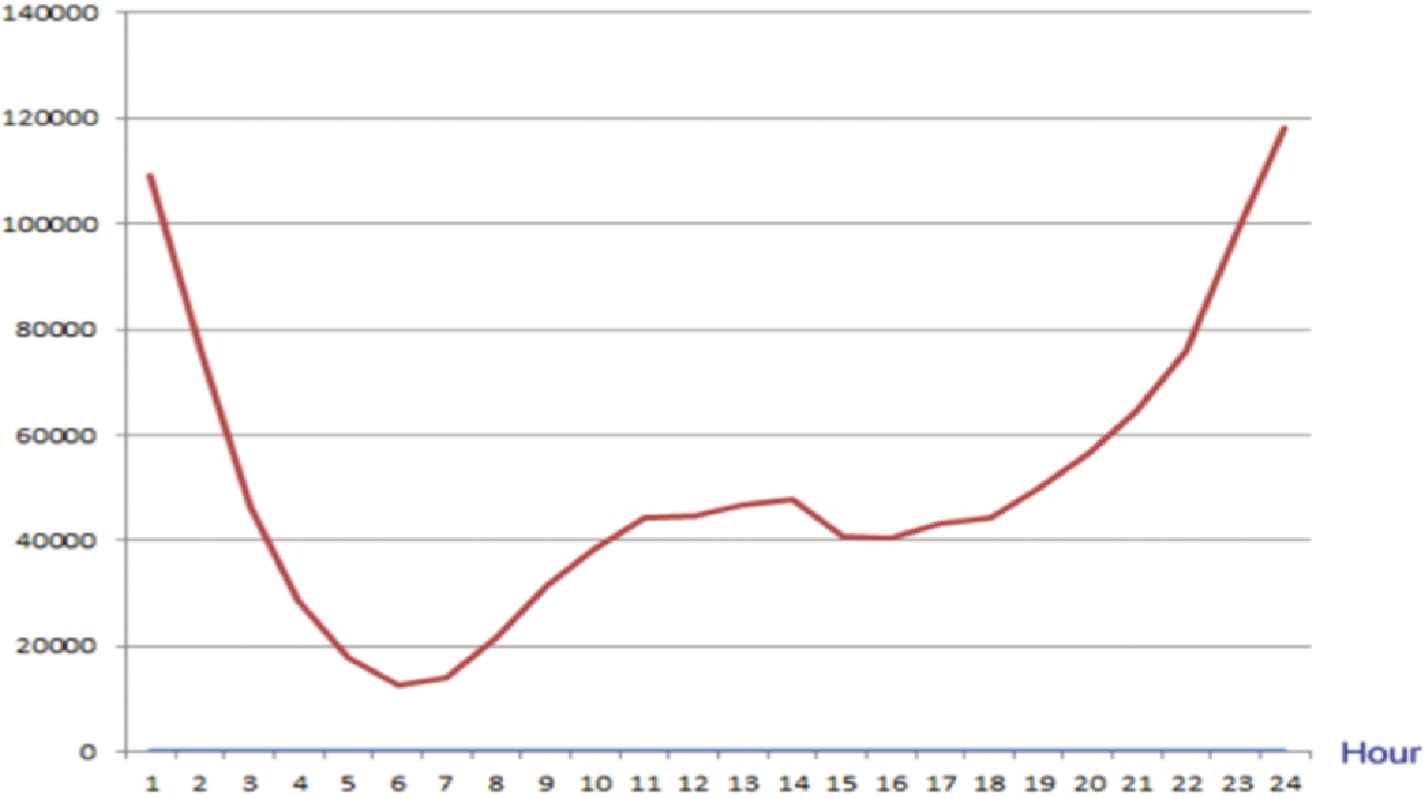
Tree hole time dynamic characteristics.
2.2. The Temporal Characteristics on Festivals
In this section, we study whether festivals have great influence on tree hole data and whether different festivals have different time characteristics. A correct understanding and grasp of the influence of these festivals will help to allocate human resources and help them to help more effectively in these special days. Our preliminary observation data shows that New Year’s Day, Tomb Sweeping Day, National Day, and Christmas Day have an impact on tree hole activity, so we chose these four festivals to investigate. We compare the number of tree hole information in these festivals with the average number of tree hole information at ordinary days, and investigate whether there are obvious differences in festivals or major events.
Table 1 shows the difference of tree hole information between New Year’s Day and ordinary days. It can be seen that New Year’s Day has a great influence on the activity of the tree hole, increasing by at least 25.31%. The activity of New Year’s Day increased by 40.65% in 2018. The possible explanation for this phenomenon is that the alternation of the New Year and the old year increases the sadness of depressed patients. It is recommended that rescue workers invest at least 30% more manpower than usual during New Year’s Day.
| Year | Average of One Month Before and After New Year’s Day (Bar) | New Year’s Day (Bar) | The Differences (%) |
|---|---|---|---|
| 2013 | 216 | 314 | 31.32 |
| 2014 | 121 | 187 | 35.53 |
| 2015 | 190 | 282 | 32.55 |
| 2016 | 188 | 284 | 33.87 |
| 2017 | 640 | 857 | 25.31 |
| 2018 | 1,850 | 3,117 | 40.65 |
| Average | 534 | 840 | 33.20 |
The difference of tree hole information number between New Year’s Day and ordinary days.
The differences of tree hole information number between Tomb Sweeping Day and ordinary days are shown in Table 2. It can be seen that Tomb Sweeping Day also has a great influence on the activity of the tree hole. In 2017, the activity of Tomb Sweeping Day increased by 33.96%. However, in 2018, the activity in Tomb Sweeping Day is basically the same as usual. The possible explanation for this phenomenon is that in this special festival, people with depression will think of the dead, which increases their sadness. This suggests that rescue workers should invest at least 10% of the manpower to rescue during their stay in Tomb Sweeping Day.
| Year | Average of One Month Before and After New Year’s Day (Bar) | New Year’s Day (Bar) | The Differences (%) |
|---|---|---|---|
| 2013 | 325 | 368 | 11.65 |
| 2014 | 146 | 194 | 24.86 |
| 2015 | 179 | 252 | 28.79 |
| 2016 | 212 | 256 | 17.08 |
| 2017 | 1,168 | 1,768 | 33.96 |
| 2018 | 1,228 | 1,273 | 3.50 |
| Average | 763 | 783 | 10 |
The difference of tree hole information number between Tomb Sweeping Day and ordinary days.
The difference of tree hole information number between number National Day and ordinary days is shown in Table 3. It can be seen that the activity of the tree hole on National Day has been greatly weakened. Especially in the National Day of 2016, the reduction reached 59.62%. The possible explanation for this phenomenon is that joy reduces depression to a great extent during the national celebrations. This reminds rescue workers that they can arrange a small amount of manpower during the National Day.
| Year | Average of One Month Before and After New Year’s Day (Bar) | New Year’s Day (Bar) | The Differences (%) |
|---|---|---|---|
| 2013 | 296 | 188 | −57.48 |
| 2014 | 147 | 141 | −4.53 |
| 2015 | 183 | 175 | −4.42 |
| 2016 | 181 | 176 | −2.93 |
| 2017 | 720 | 451 | −59.62 |
| 2018 | 1,368 | 1,263 | −8.32 |
| Average | 433 | 368 | −13 |
The difference of tree hole information number between National Day and ordinary days.
The difference of tree hole information number between Christmas Day and ordinary days is shown in Table 4. It can be seen that Christmas has different influences on the activity of the tree hole. The activity of tree holes decreased by 15.41% in Christmas 2013, and reached 20.07% in Christmas 2015, and exceeded 12% in the following two years. It can be considered that Christmas has a certain influence on the activity of the tree hole. According to the rule of the past three years, rescue workers need to increase their manpower by 10% during Christmas.
| Year | Average of One Month Before and After New Year’s Day (Bar) | New Year’s Day (Bar) | The Differences (%) |
|---|---|---|---|
| 2013 | 212 | 256 | 17.33 |
| 2014 | 125 | 108 | −15.41 |
| 2015 | 197 | 186 | −6.12 |
| 2016 | 186 | 233 | 20.07 |
| 2017 | 632 | 723 | 12.56 |
| 2018 | 1,841 | 2,103 | 12.46 |
| Average | 497 | 559 | 4 |
The difference of tree hole information number between Christmas Day and ordinary days.
2.3. The Temporal Characteristics on Holidays and Major Events
In this part, we chose the main holidays in China for investigation, including winter vacation, summer vacation, and major events (such as the World Cup). Examine the average values of these holidays and ordinary days (i.e., one month before and after the holidays or major events) and judge whether there are obvious differences between holidays or major events. Table 5 shows the difference between winter vacation and summer vacation and one month before and after them. It can be seen that winter, summer vacation, and ordinary days have no obvious influence on the activity of tree holes, and there is no positive or negative influence. Only the winter vacation in 2018 has obvious differences, and its activity has increased by 35%. At present, it is not clear why this special activity has increased, and it is impossible to judge whether this situation will continue to develop into the following years. The preliminary conclusion can be drawn that it is not necessary to adjust the manpower input for the relief during the holidays like winter and summer vacation.
| Year | Average of One Month Before and After the Winter Vacation (Bar) | Average of Winter Vacation | The Differences (%) | Average for the Month Before Summer Vacation | Average of Summer Vacation | Average for the Month After Summer Vacation | The Differences (%) |
|---|---|---|---|---|---|---|---|
| 2013 | 228 | 235 | 3 | 193 | 184 | 154 | 6 |
| 2014 | 130 | 135 | 4 | 169 | 199 | 193 | 9 |
| 2015 | 165 | 171 | 4 | 178 | 163 | 183 | 11 |
| 2016 | 201 | 208 | 3 | 605 | 329 | 347 | −47 |
| 2017 | 615 | 635 | 5 | 1,170 | 1,060 | 1,145 | 9 |
| 2018 | 1,031 | 1582 | 35 | 1,879 | 1,160 | 1,432 | −43 |
Influence of winter vacation and summer vacation on tree hole information.
It is particularly worth mentioning that there was a World Cup in 2014, and it was found that major events such as the World Cup would make the tree hole more active. One explanation for this phenomenon is that when people are keen on their favorite activities, they will increase the loneliness of depression patients, thus increasing the activity of tree holes. During the World Cup, we should pay more attention to these special people.
2.4. Time Series Analysis of Tree Hole Data
This paper analyzes the data from 2013 to 2018 and the first seven months of 2019 and 2020 in time series, and forecasts the data in 2019 and the next five months of 2020. The methods we use include moving average method, trend forecast analysis method, and exponential smoothing method.
2.4.1. Moving average method
The moving average method is a method to calculate the time series average with a certain number of items according to the gradual passage of time series data to reflect the long-term trend. When the value of time series fluctuates greatly due to the influence of periodic changes and irregular changes, and it is difficult to show the development trend, the moving average method can be used to eliminate the influence of these factors and analyze and predict the long-term trend of the series. Here we use the simple moving average method.
The principle of the simple moving average method is as follows. Let the observation sequence be
When the basic trend of the forecast target fluctuates up and down at a certain level, a simple moving average method can be used to establish the prediction model.
The standard error of prediction is as follows:
2.4.2. Trend forecast analysis method
When there is no obvious trend change in time series, the simple moving average method can accurately reflect the actual situation. However, when the time series shows a trend of linear increase or decrease, the simple moving average method will lead to lag deviation. Therefore, it needs to be revised. The modified method is to make a second moving average and establish a prediction model of linear trend by using the law of lag deviation of moving average. This is the trend prediction analysis method.
On the basis of the single moving average, another moving average is the double moving average. The calculation formula is as follows:
The process of establishing linear trend prediction model by using the lag deviation of moving average is as follows. Suppose that the time series {
In the above formula, t is the number of current periods, T is the number of periods from t to the prediction period,
According to the moving average, the calculation formula of smoothing coefficient is as follows:
For the series with linear trend and periodic fluctuation at the same time, the trend prediction analysis method can not only reflect the trend change, but also effectively separate the periodic change.
2.4.3. Exponential smoothing method
In fact, the single moving average considers that the data in recent
Let the time series
The above formula shows that
There is obviously the following formula.
Because the weighted coefficients conform to the exponential law and have the function of smoothing data, it is called exponential smoothing.
It is an exponential smoothing method to predict with this smoothing value. The prediction model is as follows:
In other words, the exponential smoothing value of the period t is taken as the forecast value of the period
2.4.4. Time series analysis
According to the data of the first seven months from 2013 to 2018, the data of the first seven months of 2019 are predicted. Taking the square of the difference between the actual value and the predicted value as the error value, the average error of the three prediction methods is calculated. Then, the method with the minimum average error is selected to forecast the tree hole data in 2019 and the next five months after 2020. The forecast results and average error of the first seven months of 2019 are shown in Table 6.
| Month | Moving Average Method | Trend Forecast Analysis Method | Exponential Smoothing Method |
|---|---|---|---|
| 1 | 26,470 | 44,385 | 53,521 |
| 2 | 16,108 | 40,360 | 43,298 |
| 3 | 19,462 | 38,742 | 39,671 |
| 4 | 18,617 | 42,238 | 38,342 |
| 5 | 19,922 | 46,715 | 42,132 |
| 6 | 36,545 | 56,550 | 56,367 |
| 7 | 17,705 | 38,004 | 34,589 |
| Average error | 196,087,873 | 321,950,729 | 427,712,785 |
Predict the tree hole data for the first seven months of 2019.
It can be seen from Table 6 that the average error obtained by the moving average method is the smallest. So we use the moving average method to forecast the tree hole data in the last five months of 2019 and 2020, as shown in Table 7.
| 2019 | 2020 | 2019 | 2020 | ||
|---|---|---|---|---|---|
| January | 37,992 | 60,029 | July | 6,490 | 81,999 |
| February | 23,676 | 11,709 | August | 19,040 | 21,658 |
| March | 39,913 | 20,799 | September | 32,684 | 37,819 |
| April | 16,642 | 79,964 | October | 21,647 | 24,793 |
| May | 44,907 | 78,093 | November | 19,110 | 21,893 |
| June | 39,772 | 81,278 | December | 25,302 | 28,764 |
The bold values indicates the data predicted by the moving average method.
Forecast tree hole data for the second five months of 2019 and 2020.
It can be seen from Table 7 that September and December in 2020 are two periods with high activity of the tree hole, and the input of rescue workers should be increased in these two periods. In addition, it also can be found that the outbreak of COVID-19 this year has also affected the activity of the tree hole. For example, in February, when the epidemic in COVID-19 was the worst, the tree hole activity was much less than that in other months. The reason may be that during the epidemic period, most patients with depression stayed at home. With the care of their families, their sadness will be reduced. In this year, due to COVID-19, there may be more tree holes, so rescue workers should put more energy into discovering their existence.
3. RELATED WORK
There are different methods to analyze the tree hole data in Weibo. Chen Pan et al. obtained the top 500 high-frequency keywords from the tree hole data in Weibo by word segmentation and TF-IDF algorithm, analyzed the keywords by co-occurrence network with Gephi software, judged the positive and negative emotional degree of the extracted high-frequency keywords by using the emotional dictionary provided by Boson, and analyzed the content of negative emotions [8]. Gong Jing-qiu et al. used quantitative analysis method, empirical research method, and data visualization method to study the spatial distribution visualization expression of tree cave data in Weibo [9]. Tian Wei et al. put forward a method based on text analysis, realized MLP two-class classifier, and realized automatic identification and classification of suicide risk based on Weibo [10]. In this study, statistics and time series analysis are used to analyze the tree hole data in Weibo.
There have been many studies related to time series analysis before. For example, Saikia Achinta et al. analyzed the trend value of rice yield in Assam, India from 1995 to 2015 in time series [11]. In order to predict China’s agricultural output value, Zhang Hong-meng used ARIMA model to fit the quarterly data of China’s agricultural output value from January 2010 to August 2020, and forecast the next six quarters with the optimal model, which provided the basis for national macro-control and policy-making [12]. Goldberg Patricia et al. adopted a new methodology to synchronize the data with the continuous annotations that can observe students’ behaviors and analyzed the time series of 3,646 seconds of video materials. The results showed that when learners showed positive learning-related behaviors, novice teachers’ attention was most easily attracted [13]. In this study, the tree hole data are analyzed in time series, and the analysis results can give inspiration to rescue workers.
4. CONCLUSION
Through the above analysis, we observed the time characteristics of tree hole data, and obtained the data of the influence of time factors on suicidal tendency of depression patients. These time characteristic data show that the following more effective suicide rescue strategies should be adopted.
Most suicides are active from 8:00 p.m. to 2:00 a.m.. Most of this time is the time when people need to rest, so artificial intelligence robots should be used to monitor the network information. It is easier for depression patients to feel sad when the new year turns over, so 30% of human resources should be increased to help them. Tomb Sweeping Day, National Day, and Christmas Day will also increase the activities of tree holes to a certain extent, which should be paid attention to and sufficient manpower should be deployed to help. Major events, such as the World Cup, will increase the loneliness of depressed patients. These special groups need more attention, so as to reduce the risk of suicide. In addition, using the moving average method to predict the tree hole data in the next few months can help rescue workers know the activities of the tree hole in advance, so as to arrange rescue more efficiently.
The investigation of the time characteristics of tree holes is helpful to understand suicide behavior more accurately. In this regard, there are many valuable analysis angles, such as the characteristics of tree holes in different seasons, the impact of suicide mode selection in different time periods and seasons, and the impact of COVID-19 epidemic on tree holes. We will also examine the changes of suicide patterns chosen by people in different times [14], which are the future research directions.
CONFLICTS OF INTEREST
The authors declare they have no conflicts of interest.
AUTHORS' CONTRIBUTIONS
Conceptualization, Dan Xie and Min Hu; methodology, Dan Xie and Zengzhen Du; validation, Zengzhen Du and Dan Xie; formal analysis, Dan Xie and Zengzhen Du; investigation, Zengzhen Du; resources, Dan Xie; data curation, Dan Xie; writting-original draft preparation, Zengzhen Du and Dan Xie; writting-review and editing, Dan Xie and Min Hu; funding acquisition, Dan Xie.
Funding Statement
This study is supported by Research Project of Provincial Teaching Reform in Hubei Province (No. 2017356) and General Project of Humanities and Social Sciences Research of Ministry of Education (No. 19YJC880032).
REFERENCES
Cite this article
TY  - JOUR
AU  - Zengzhen Du
AU  - Dan Xie
AU  - Min Hu
PY  - 2021
DA  - 2021/06/09
TI  - Temporal Aspects of Tree Hole Data
JO  - Journal of Artificial Intelligence for Medical Sciences
SP  - 55
EP  - 61
VL  - 2
IS  - 1-2
SN  - 2666-1470
UR  - https://doi.org/10.2991/jaims.d.210604.001
DO  - 10.2991/jaims.d.210604.001
ID  - Du2021
ER  -