
Does trade reduce poverty? A view from Africa☆
- DOI
- 10.1016/j.joat.2014.06.001How to use a DOI?
- Keywords
- F02; F15; O11; O55
- Abstract
Although trade liberalization is being actively promoted as a key component in development strategies, theoretically, the impact of trade openness on poverty reduction is ambiguous. On the one hand, a more liberalized trade regime is argued to change relative factor prices in favor of the more abundant factor. If poverty and relative low income stem from abundance of labor, greater trade openness should lead to higher labor prices and a decrease in poverty. However, should the re-allocation of factors be hampered, the expected benefits from freer trade may not materialize. The theoretical ambiguity on the effects of openness regarding the trade-poverty relationship is also apparent in the empirical literature. To resolve this ambiguity, this paper examines whether the effect of openness on poverty varies with some country characteristics. Using a panel of African countries over the period 1981–2010 and testing for non-linearities in the trade-poverty relationship, we find that trade openness tends to reduce poverty in countries where financial sectors are deep, education levels high and institutions strong.
- Copyright
- © 2014 Afreximbank. Production and hosting by Elsevier B.V. All rights reserved.
- Open Access
- This is an open access article under the CC BY-NC license (http://creativecommons.org/licences/by-nc/4.0/).
1. Introduction
While most economists agree that, in the long run, open economies fair better in aggregate than do closed ones, many fear that trade could be detrimental to the poor.1 Africa remains the poorest continent of the world. Yet, at the same time, African countries have experienced significant improvements in trade liberalization. It seems that the large gains expected from opening up to international economic forces have, to date, been limited in Africa, especially for poor people.
While the traditional trade theory predicts welfare gains from openness at the country level through specialization, investment in innovation, productivity improvement, or a better resource allocation, the theoretical impact of trade on the poor remains uncertain. Besides, empirical results do not converge on this point and it seems that developing countries are not equally able to make use of the opportunities arising out of increased access to markets in the developed world.
Our contribution to the literature lies in examining how structural characteristics of countries affect the link between trade openness and poverty in Africa. Using a panel of African countries over the period 1981–2010 and testing for non-linearities in the trade–poverty relationship, this paper explores the empirical link between trade openness and poverty. Its results uncover interesting complementarities: trade openness tends to reduce poverty in countries as their financial sector grows deeper, their education level higher and their institutions stronger.
Our concern is with poverty, not inequality. Since trade liberalization tends to increase the opportunities for economic activity, it can very easily widen income inequality while at the same time reduce poverty. Consequently, statements about its effects on inequality cannot be translated directly into statements about its impact on absolute poverty. There may be sound positive and normative reasons for interest in inequality, but they are not the concerns of this paper.
The rest of the paper is organized as follows. Section 2 reviews the impact of trade on poverty by focusing on the transmission channels and the conditional variables that can influence the trade–poverty relationship. Section 3 sets up the empirical analysis of the non-linear trade–poverty relationship. Conclusions are presented in Section 4.
2. Trade openness and poverty: discussion of the literature
Bhagwati and Srinivasan (2002) distinguish two broad strands of argumentation when discussing the effects of freer trade on poverty: static and dynamic. In the former case, we examine how freer trade affects poverty taking resources and technology as given. In the latter case, we consider growth effects and the evolution of poverty over time.2
Following the static approach, the Stolper–Samuelson theorem, in its simplest form, suggests that the abundant factor should see an increase in its real income when a country opens up to trade. If the abundant factor in developing countries is unskilled labor, then this framework suggests that the poor (unskilled) in developing countries have the most to gain from trade. Krueger (1983) has used this insight to argue that trade reforms in developing countries should be pro-poor, since these countries are most likely to have a comparative advantage in producing goods requiring unskilled labor.
However, for comparative advantage to increase the incomes of the unskilled, they need to be able to move out of contracting sectors and into expanding ones. Davis and Mishra (2006), Goh and Javorcik (2006), Harrison (1996) and Topalova (2006) suggest that labor in the real world may not be as mobile: there are too many barriers to entry and exit for firms, and too many barriers to labor mobility for workers.
Focusing on urban Colombia, Attanasio et al. (2004) find for example that the probability of being unemployed is more important in traded-good sectors than in non-traded-good sectors. Trade openness may also increase the size of the informal sector (Goldberg and Pavenik, 2003). Being more exposed to foreign competition, firms may be incited to reduce their costs by hiring temporary workers instead of permanent ones, or even to lay off workers, who may in turn obtain informal jobs. Depending on the wage differences between sectors, this could lead to an increase in poverty.
In addition, if the poor are mostly completely unskilled, while it is semi-skilled labor that is on increased demand, poverty will be unaffected — or possibly, worsened. Trade liberalization may even be accompanied by skill-biased technical change, which can mean that skilled labor may benefit relative to unskilled labor (Winters et al. (2004). Lower prices for capital goods or increased competition following trade liberalization could encourage firms to import machines and increase their demand for skilled labor (Acemoglu, 2003; Behrman et al., 2000; Harrison and Hanson, 1999). Furthermore, many developing countries are rich in natural resources. Trade would stimulate this sector rather than labor-intensive ones.
From a dynamic perspective, economic growth is key to sustained poverty alleviation and trade liberalization is argued to lead to the needed increases in productivity to sustain growth. Freer trade provides greater incentives for investment, the benefits of scale and competition, limitation on rent-seeking activities favored by trade restrictions and openness to new ideas and innovations (Krueger and Berg, 2003; Grossman and Helpman, 1991; Lucas, 1988).
Empirically, cross-county growth regressions have produced mixed evidence. Using either trade shares or indices of trade liberalization, Sachs and Warner (1995), Edwards (1997), Frankel and Romer (1999) Dollar and Kraay (2001) and Lee et al. (2004) find a positive association between liberalization and growth. However, noting that trade liberalization often occurs at the same time as other policy reforms, Rodríguez and Rodrik (2001) have criticized the literature which associates trade openness measured by trade shares with more rapid growth. Considering trade policy measures instead, Harrison (1996), Edwards (1997), and Irwin and Terviö (2002) find a significant negative effect of trade on economic growth, while Vamvakidis (2002) still shows that trade enhances growth.
Examining the effect of trade on poverty more directly, Krueger (1983) shows in her case studies that developing countries’ manufactured exports were, indeed, labor-intensive, but that the employment effects of freer trade policies were generally rather limited. A number of cross-country studies on poverty, while not dealing with trade explicitly, incorporate trade openness as a control variable and showed similar results: at best the benefits of greater trade openness seem to have by passed the poor.
Looking at developing countries only, Beck et al. (2007) and Kpodar and Singh (2011) find no effect on the poor. Similarly, Dollar and Kraay (2001) find a lack of any evidence of an impact of openness on the income of the poorest quintile in a sample of advanced and developing economies. By contrast, looking at a sample of developing countries, Guillaumont-Jeanneney and Kpodar (2011) find a negative relationship between trade openness and the income of the poorest quintile. Similarly, Singh and Huang (2011) focusing on a sample of sub-Saharan African countries suggest that greater trade openness increases headcount poverty, widens the poverty gap, and reduces the income of the poorest quintile.
This lack of any clear correlation between openness measures and poverty indicators in aggregate could be because there is too much heterogeneity in the effects of trade reforms on the poor. Since poor workers in import-competing sectors lose from reforms, while poor workers in export-oriented sectors gain, it could be that in the aggregate these different effects cancel each other. Similarly, cross-country studies have tended to favor larger samples and focus on developing countries at best. While using a broader sample increases the degrees of freedom, it may also introduce unwanted heterogeneity if factors explaining poverty differ between country groups.
Another possibility suggested by Winters et al. (2004) is that trade liberalization almost certainly requires combination with other appropriate policies. The sort of policies envisaged would be those that encourage investment, allow effective conflict resolution, and promote human-capital accumulation. Linear regression models would not capture such complementary dynamics. A number of recent studies emphasize the importance of complementary policies in determining the benefits or costs of trade reforms for developing countries. For example, Bolaky and Freund (2008) show that trade reforms actually lead to income losses in highly regulated economies. Excessive regulations restrict growth because resources are prevented from moving into the most productive sectors and to the most efficient firms within sectors. Similarly, Sindzingre (2005) suggests that institutions could help explain the heterogeneity in the globalization–poverty relationship. She argues that domestic political structures and institutions (such as oligarchic or predatory regimes) may prevent the poor from benefiting from globalization.
More recently, Haltiwanger (2011) and McMillan and Verduzco (2011) argue that benefits of trade depend to a large extent on national institutional settings. Trade entails a reallocation of resources away from less productive activities to more productive ones. These authors argue that many things could go wrong in this process. Transportation or communication infrastructure might not be sufficiently developed. Competition policy could be ineffective, not preventing large firms from abusing their market power. Financial markets might be too shallow to fund new and expanding businesses. In such distorted economic environments, there is little chance that the benefits of greater trade openness materialize and – in extreme cases – a “de-coupling” may take place, i.e. cases in which policy reforms induce downsizing and exit of some firms but do not lead to the expansion of other firms.
Similarly, reviewing the new wave of research under the International Collaborative Initiative on Trade and Employment, Newfarmer and Sztajerowska (2012) conclude that the benefits of trade are not automatic. Policies need to accompany greater openness to trade, including measures aimed at macroeconomic stability and a favorable investment climate, as well as protection for workers and facilitation of labor transitions. These policies are argued to play an important role in allowing the potential income and employment gains associated with trade to materialize.
Finally, Agénor (2004) examines whether the effect of globalization on poverty depends on the liberalization degree. Introducing a square term of globalization index in his base model, he finds that under a certain level globalization is detrimental for the poor and that beyond this threshold, globalization appears to reduce poverty (illustrating an inverted U-shaped relationship between globalization and poverty). One explanation suggested by Agénor (2004) is that at the first stage, globalization generates a decrease in the output of import-competing sectors, while at the next stage, output increases thanks to the development of the exportable sector induced by greater globalization. Using endogenous threshold regression techniques to investigate the trade–poverty relationship in China, Liang (2006) reaches similar results: globalization promotes poverty-reduction in Chinese provinces only after the economy has reached a certain level of globalization.
3. Empirical analysis
3.1. Sample
Our empirical objective is to examine how the poverty reduction effect of openness may depend on a variety of country characteristics. For this purpose, we work with pooled cross-country and time-series data for 30 African countries averaged over five-year periods from 1981 to 2010. Summary statistics and the correlation matrix for the variables used in our estimation exercises are provided in Appendix 1 (country list in Appendix 2). Following the same approach as Chang et al. (2009), we start with a linear regression specification and then extend it to test heterogeneity in the poverty–trade relation according to some country characteristics.
The article focuses on the three dimensions (finance, education, and governance) that should characterize an economy’s ability to reallocate resources away from the less productive sectors to the more productive ones and, hence, take advantage of the opportunities offered by greater trade openness. A more developed financial sector, as measured by the private sector credit-to-GDP ratio, would allow a faster identification of new and promising sectors and a redirection of credit. A more educated population, as measured by primary completion rates, would be more able to acquire the new skills sought by growing sectors and adjust more rapidly to the new conditions of the labor market. Finally, better governance, as measured by the quality of bureaucracy, would reduce transaction costs of trade.
3.2. Model and definition of variables
3.2.1. Model
We estimate a classical poverty model, as follows3:
Following Chang et al. (2009), we then introduce interacting terms to allow the poverty–openness relationship to vary with some country characteristics (financial depth, education, and governance). Now, the regression equation is the following:
3.2.2. Variables
3.2.2.1 Poverty
There are many definitions and measures of poverty but the most popular indicator is the poverty headcount index which measures the percentage of the population living with consumption or income per person below a certain poverty line. It is a measure of absolute poverty. Another popular measure is the poverty gap, which measures the mean distance below the poverty line as a proportion of the poverty line. As dependent variable, we use the poverty headcount and the poverty gap considering the $1.25 poverty line.
3.2.2.2 Trade openness
Two main categories of trade openness measures can be found in the economic literature. Spilimbergo et al. (1999) distinguish for instance between incidence-based measures of openness, based on tariff data and trade policy, and outcome-based measures of openness, based on trade data. Calderón et al. (2005) make a similar distinction between policy or legal measures and outcome or de facto measures of openness. In this paper we focus on the impact of actual globalization on poverty, that is why we have chosen as our independent variable (Trade openness) a measure of effective trade openness (the sum of exports and imports as a share of GDP), and not a measure of liberalization policies.4
3.2.2.3 Control variables
We also include a set of control variables that are commonly used in poverty equations: overall income per capita (GDP per capita) to control for economic development, a measure of human capital level (Education); a variable of financial deepening (Private credit/GDP); growth of the consumer price index (Inflation) to control for the macroeconomic instability; and an indicator of institutional quality (Bureaucracy quality) drawn from the International Country Risk Guide (ICRG) database which measures the strength and impartiality of the legal system, and the popular observance of the law. Data sources are provided in Appendix 3.
3.3. Methodology
To control for country-specific effects and the possible endogeneity of control variables with poverty, we estimate the coefficients of our model by using the System Generalized Method-of-Moment (GMM) estimator developed by Blundell and Bond (1998).
To verify the consistency of the GMM estimator, we have to make sure that lagged values of the explanatory variables are valid instruments in the poverty regression. We examine this issue by considering the Hansen test of over-identifying restrictions. The no rejection of the null hypothesis implies that instrumental variables are not correlated with the residual and are satisfying the orthogonality conditions required. A serial correlation test is also carried out and demonstrates that the errors exhibit no second-order serial correlation.
3.4. Results
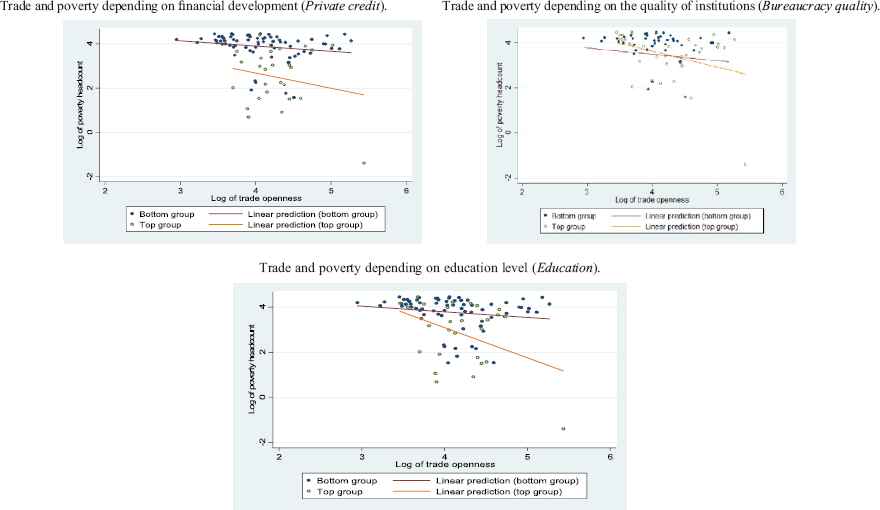
As in Chang et al. (2009), we first take a look at the plots in Appendix 4 which compare the trade–poverty relationship in the top country group and the bottom country group in terms of financial development, education and governance.5 The observation of these plots suggests that the effect of trade openness on poverty would depend on a variety of country characteristics. Indeed, for each conditional variable considered, the slope for the relationship between trade openness and poverty is negative and steeper in the top group than in the bottom group.
To control for other poverty determinants and endogeneity issues, we now test our model through an econometric analysis. Results of the basic regression with no interaction term (Eq. (1)) are presented in Table 1 (for the poverty headcount) and Table 2 (for the poverty gap), columns 1. The log transformation of all the variables allows us to interpret the coefficients as elasticities. A positive sign of coefficients indicates an increase in the poverty headcount (corresponding to a rise in the number of poor people), or an increase in the poverty gap (suggesting a worsening in the situation of the poor).
| Poverty headcount (log) | ||||
|---|---|---|---|---|
| (1) | (2) | (3) | (4) | |
| Trade openness (log) | 0.727 (1.38) | 5.018 ** (2.33) | 12.539 ** (2.02) | 2.270 ** (2.07) |
| GDP per capita (log) | −0.707 *** (−4.16) | −0.861 *** (−3.89) | −0.679 *** (−3.07) | −0.539 ** (−2.48) |
| Inflation (log) | 0.106 (1.27) | 0.153 (1.01) | 0.023 (0.14) | 0.155 (1.46) |
| Education (log) | −0.228 (−0.68) | 0.432 (0.75) | 12.015 * (1.90) | −0.629 (−1.59) |
| Bureaucracy quality | −0.091 (−1.20) | −0.346 * (−1.65) | −0.167 (−1.24) | 5.333 * (1.77) |
| Private credit/GDP (log) | −0.222 (−1.09) | 8.51 * (1.90) | −0.246 (−1.36) | −0.305 ** (−2.18) |
| Private credit/GDP * trade openness | −2.156 * (−1.94) | |||
| Education * trade openness | −3.13 ** (−1.97) | |||
| Bureaucracy quality * trade openness | −1.298 * (−1.78) | |||
| Constant | 6.73 *** (3.50) | −11.65 (−1.18) | −38.844 (−1.61) | 0.805 (0.18) |
| Observations | 64 | 64 | 64 | 64 |
| Number of countries | 30 | 30 | 30 | 30 |
| Sargan/Hansen test | 0.11 | 0.87 | 0.88 | 0.85 |
| AR(2) | 0.35 | 0.22 | 0.59 | 0.29 |
Notes: data are averaged over five years. Absolute value of z statistics in parentheses.
Significant at 10%.
Significant at 5%.
Significant at 1%.
Trade openness and poverty incidence in Africa-GMM system.
| Poverty gap (log) | ||||
|---|---|---|---|---|
| (1) | (2) | (3) | (4) | |
| Trade openness (log) | 1.122 (1.63) | 5.343 ** (2.39) | 15.655 ** (1.98) | 3.151** (2.04) |
| GDP per capita (log) | −0.926 *** (−4.27) | −1.085 *** (−3.86) | −0.921 *** (−3.04) | −0.715 ** (−2.51) |
| Inflation (log) | 0.210 * (1.87) | 0.221 (1.17) | 0.070 (0.33) | 0.250* (1.74) |
| Education (log) | −0.350 ** (−0.81) | 0.527 (0.74) | 14.92 * (1.85) | −0.788 (−1.55) |
| Bureaucracy quality | −0.156 (−1.39) | −0.438 (−1.63) | −0.268 (−1.43) | 7.010 (1.63) |
| Private credit/GDP (log) | −0.287 (−1.18) | 8.822 * (1.79) | −0.339** (−1.44) | −0.407 ** (−2.12) |
| Private credit/GDP * trade openness | −2.261 * (−1.86) | |||
| Education * trade openness | −3.877* (−1.90) | |||
| Bureaucracy quality * trade openness | −1.720* (−1.66) | |||
| Constant | 6.028 ** (2.41) | −50.19 * (−1.65) | −50.19 * (−1.65) | −2.036 (−0.33) |
| Observations | 64 | 64 | 64 | 64 |
| Number of countries | 30 | 30 | 30 | 30 |
| Sargan/Hansen test | 0.12 | 0.38 | 0.51 | 0.26 |
| AR(2) | 0.44 | 0.81 | 0.73 | 0.80 |
Notes: data are averaged over five years. Absolute value of z statistics in parentheses.
Significant at 10%.
Significant at 5%.
Significant at 1%.
Trade openness and poverty gap in Africa-GMM system.
Overall, our results are consistent with the empirical literature. The negative and significant coefficient of income per capita reveals that all other things being equal, more developed countries have lower levels of poverty. Inflation, financial development, education and governance variables have no significant impact on poverty. Looking at trade openness, the results are in line with Beck et al. (2007) and Kpodar and Singh (2011): they suggest that greater trade openness is not significantly associated with either lower or higher levels of poverty.
While the first regression only considers linear effects, we examine next the influence of some structural country characteristics in the trade-poverty relationship. The results with the interaction terms are presented in Columns 2, 3 and 4 of Tables 1 and 2. As Chang et al. (2009), our findings provide evidence of reform complementarity: the coefficient on the trade openness proxy suggests that greater trade is associated with higher levels of poverty, but the coefficients on the interaction terms indicate that this adverse relation could be reversed if financial development grows, education level increases, or governance improves.
We first test whether the trade–poverty relationship would change with the development of the financial sector. The coefficient on the interaction term with the financial depth (measured by the private sector credit-to-GDP ratio) is negative and significant. These results suggest that a greater openness of African economies to trade is associated with lower levels of poverty when the financial system is more developed. In other words, easier access to cheaper credit may allow the poor to benefit more from trade openness. A threshold of 10.2% of GDP is estimated for the development of domestic private credit beyond which the poor can benefit from trade openness, which is far below the average of our sample (21.2% of GDP). To illustrate, Ghana, Malawi and Uganda are under this threshold while South Africa, Algeria and Tunisia are well above it.6
Column 3 of Table 1 shows the results of the estimations testing the role of human capital in the trade–poverty relationship. The beneficial impact of an increase in trade openness on poverty reduction is larger when the investment in human capital is stronger. We find that when the share of the population over age 15 with completed primary education exceeds 55% (the average in the sample is 55%), trade openness starts being favorable to the poor. In other words, with appropriate learning skills, people are better able to take advantage of the new opportunities offered by trade.
Finally, we examine whether the relationship between the openness to trade and poverty may hinge on a country’s institutional environment. Results suggest that the negative association between trade openness and poverty could diminish and even reverse when the quality of bureaucracy improves (Column 4, Table 1). We find that trade openness could be favorable to the poor when institution quality (measured by the Bureaucracy quality variable) reaches 1.75 (the average of our sample is 1.4). In other words, an environment where bureaucracy is of high quality seems to be more favorable for the emergence of new enterprises and the closing of older ones, allowing the economy the needed flexibility to adjust.
3.4.1. Robustness tests
We conducted several robustness tests:
- •
First, we use an alternative measure of absolute poverty, the poverty gap. Results using the poverty gap confirm the observations for the poverty headcount ratio (see Table 2);
- •
We also remove outliers. Results reported in Tables A.1 and A.2 confirm and reinforce our previous observations.
4. Concluding remarks
While trade liberalization is considered as an efficient tool to enhance development, both theoretically and empirically, its impact on poverty is ambiguous. At best, the benefits of freer trade seem to bypass the poor. By focusing on African countries and taking into account possible non-linearities, this paper attempted to reach more robust results.
While on average trade does not seem to be associated with lower poverty, this observation hides important non-linearities and an interesting pattern of policy complementarities. More openness results in a reduction in poverty when financial sector is deeper, education levels higher, or governance stronger.
These results are consistent with the recent literature arguing that the benefits of trade are not automatic and that policies to accompany trade opening are needed. These policies would aim at encouraging the financing of new investment, the quality of institutions and the ability to adjust and learn new skills. This accompanying policy agenda would allow resources to be reallocated away from less productive activities to more promising ones.
Trade liberalization should therefore not be seen in isolation and additional policies will be needed to enhance its impact, including on poverty. This also means that poor policies and institutions, weak human capital and limited financial development, have not only a direct negative effect countries’ welfare, but also prevent the poor in developing countries from benefitting from the gains of trade liberalization.
Appendix 1. Summary statistics and correlation matrix
| Variable | Observations | Mean | Standard deviation | Minimum | Maximum |
|---|---|---|---|---|---|
| Poverty incidence | 64 | 42.5 | 26.3 | 2.0 | 86.1 |
| Poverty gap | 64 | 17.6 | 13.9 | 0.4 | 53.1 |
| Trade openness | 64 | 65.8 | 28.0 | 19.1 | 178.3 |
| GDP per capita | 64 | 2255.9 | 2443.3 | 295.1 | 13,003.9 |
| Inflation | 64 | 27.4 | 130.1 | 0.3 | 1042.7 |
| Education | 64 | 55.0 | 22.4 | 9.6 | 93.9 |
| Bureaucracy quality | 64 | 1.41 | 0.89 | 0 | 3.17 |
| Private credit/GDP | 64 | 21.2 | 24.9 | 0.6 | 151.6 |
| (1) | (2) | (3) | (4) | (5) | (6) | (7) | (8) | ||
|---|---|---|---|---|---|---|---|---|---|
| Poverty incidence | (1) | 1 | |||||||
| Poverty gap | (2) | 0.97 | 1 | ||||||
| Trade openness | (3) | −0.02 | 0.03 | 1 | |||||
| GDP per capita | (4) | −0.61 | −0.55 | 0.17 | 1 | ||||
| Inflation | (5) | 0.09 | 0.15 | 0.28 | −0.01 | 1 | |||
| Education | (6) | −0.54 | −0.49 | 0.28 | 0.58 | −0.13 | 1 | ||
| Bureaucracy quality | (7) | −0.47 | −0.46 | 0.10 | 0.57 | 0.13 | 0.47 | 1 | |
| Private credit/GDP | (8) | −0.50 | −0.47 | −0.06 | 0.56 | −0.11 | 0.42 | 0.16 | 1 |
Appendix 2. List of the sample countries (30)
| Algeria | Kenya |
| Angola | Liberia |
| Botswana | Madagascar |
| Burkina Faso | Malawi |
| Cameroon | Mali |
| Congo, Dem. Rep. | Morocco |
| Congo, Rep. | Mozambique |
| Cote d’Ivoire | Niger |
| Egypt Arab Rep. | Nigeria |
| Ethiopia | Senegal |
| Gabon | South Africa |
| Gambia | Tanzania |
| Ghana | Togo |
| Guinea | Tunisia |
| Guinea-Bissau | Uganda |
Appendix 3. Variable definition and sources
| Variables | Description | Data sources |
|---|---|---|
| Poverty incidence | The percentage of the population living below the $1.25/day international poverty line | World Bank Global Poverty Index |
| Poverty gap | The average shortfall of the poor with respect to the poverty line, multiplied by the headcount ratio | Database |
| Trade openness | Sum of exports and imports as a share of GDP | International Financial Statistics and World |
| Inflation | Annual percentage change in consumer prices | Development Indicators |
| GDP per capita | Nominal GDP divided by population size | |
| Private credit/GDP | Domestic credit to private sector (% of GDP) | |
| Education | Primary completion rate: total number of new entrants in the last grade of primary education, regardless of age, expressed as percentage of the total population of the theoretical entrance age to the last grade of primary. | UNESCO database |
| Bureaucracy quality | Strength and quality of the bureaucracy. Its values range from 0 to 4, with a higher figure indicating a better quality of bureaucracy. | International Country Risk Guide (ICRG) |
Appendix 4. Poverty and trade openness for top and bottom reformers
Appendix 5. Robustness checks
(See Tables A.1 and A.2.)
| Poverty headcount (log) | ||||
|---|---|---|---|---|
|
|
||||
| (1) | (2) | (3) | (4) | |
| Trade openness (log) | −0.126 (−0.30) | 4.239 * (1.93) | 14.648* (2.30) | 1.636 * (1.92) |
| GDP per capita (log) | −0.616 *** (−3.72) | −1.028 *** (−4.86) | −0.761 *** (−3.64) | −0.607 *** (−4.20) |
| Inflation (log) | 0.046 (0.65) | 0.074 (0.53) | −0.034 (−0.27) | 0.091 (1.61) |
| Education (log) | 0.155 (0.58) | 0.60 (1.07) | 14.861** (2.31) | −0.260 (−1.11) |
| Bureaucracy quality | −0.123 * (−1.69) | −0.308 * (−1.70) | −0.211 * (−1.68) | 4.503 * (1.74) |
| Private credit/GDP (log) | −0.377 * (−1.94) | 7.319 * (1.68) | −0.276 (−1.63) | −0.335 *** (−2.73) |
| Private credit/GDP * trade openness | −1.841 * (−1.70) | |||
| Education * trade openness | −3.750 ** (−2.34) | |||
| Bureaucracy quality * trade openness | −1.098 * (−1.79) | |||
| Constant | 8.733 *** (5.70) | −8.316 (−0.85) | −47.92* (−1.90) | 2.561 (0.75) |
| Observations | 60 | 60 | 60 | 60 |
| Number of countries | 28 | 28 | 28 | 28 |
| Sargan/Hansen test | 0.11 | 0.14 | 0.99 | 0.63 |
| AR(2) | 0.41 | 0.25 | 0.77 | 0.24 |
Notes: data are averaged over five years. Absolute value of z statistics in parentheses.
Significant at 10%.
Significant at 5%.
Significant at 1%.
Trade openness and poverty incidence in Africa-GMM system excluding outliers.
| Poverty gap (log) | ||||
|---|---|---|---|---|
|
|
||||
| (1) | (2) | (3) | (4) | |
| Trade openness (log) | 0.463 (0.52) | 5.335 *** (2.70) | 19.507 ** (2.32) | 2.656 ** (2.12) |
| GDP per capita (log) | −0.920 *** (−3.96) | −1.321 *** (−5.50) | −1.027 *** (−3.61) | −0.802 *** (−3.83) |
| Inflation (log) | 0.135 (1.35) | 0.160 (0.94) | −0.016 (−0.09) | 0.168 * (1.90) |
| Education (log) | 0.158 (0.41) | 0.879 (1.40) | 19.658 ** (2.35) | −0.368 (−1.13) |
| Bureaucracy quality | −0.190 (−1.50) | −0.477 ** (−2.38) | −0.345 * (−1.97) | 6.864 * (1.91) |
| Private credit/GDP (log) | −0.502 * (−1.86) | 9.078 ** (2.35) | −0.387 * (−1.67) | −0.490 *** (−2.69) |
| Private credit/GDP * trade openness | −2.306 ** (−2.14) | |||
| Education * trade openness | −4.956 ** (−2.36) | |||
| Bureaucracy quality * trade openness | −1.683 ** (−1.97) | |||
| Constant | 7.406 *** (2.99) | −12.570 (−1.32) | −66.094 ** (−2.00) | −0.805 (−0.16) |
| Observations | 60 | 60 | 60 | 60 |
| Number of countries | 28 | 28 | 28 | 28 |
| Sargan/Hansen test | 0.11 | 0.35 | 0.94 | 0.67 |
| AR(2) | 0.58 | 0.21 | 0.63 | 0.24 |
Notes: data are averaged over five years. Absolute value of z statistics in parentheses.
Significant at 10%.
Significant at 5%.
Significant at 1%.
Trade openness and poverty Gap in Africa-GMM System excluding outliers.
Appendix 6. Classification of countries with regard to the thresholds (1981–2010)
| Financial development | Education level | Quality of institutions | |||
|---|---|---|---|---|---|
|
|
|
|
|||
| Under the threshold | Above the threshold | Under the threshold | Above the threshold | Under the threshold | Above the threshold |
| Angola | Algeria | Angola | Algeria | Algeria | Botswana |
| Botswana | Burkina Faso | Burkina Faso | Botswana | Angola | Egypt, Arab Rep. |
| Congo, Dem. Rep. | Cote d’Ivoire | Congo, Dem. Rep. | Cameroun | Burkina Faso | Gambia, The |
| Congo, Rep. | Egypt, Arab Rep. | Cote d’Ivoire | Congo, Rep. | Cameroon | Ghana |
| Cameroon | Ethiopia | Ethiopia | Egypt, Arab Rep. | Congo, Dem. Rep. | Guinea |
| Gabon | Gambia, The | Guinea | Gabon | Congo, Rep. | Kenya |
| Ghana | Kenya | Guinea-Bissau | Gambia, The | Cote d’Ivoire | Morocco |
| Guinea | Liberia | Kenya | Ghana | Ethiopia | South Africa |
| Guinea Bissau | Morocco | Liberia | Malawi | Gabon | Tunisia |
| Madagascar | Mozambique | Madagascar | Morocco | Guinea Bissau | |
| Malawi | Nigeria | Mali | South Africa | Liberia | |
| Mali | Senegal | Mozambique | Tanzania | Madagascar | |
| Niger | South Africa | Niger | Togo | Malawi | |
| Uganda | Tanzania | Nigeria | Tunisia | Mali | |
| Togo | Senegal | Mozambique | |||
| Tunisia | Uganda | Niger | |||
| Nigeria | |||||
| Senegal | |||||
| Tanzania | |||||
| Togo | |||||
| Uganda | |||||
Notes: countries in bold are under the calculated threshold for each of the three characteristics.
Footnotes
We would like to thank Richard Baldwin, Daniel Lederman and Sherry Stephensen for their helpful comments. We would also like to thank the participants at the Center for the Study of African Economies Conference, March 18–20, 2012, Oxford and at the Poverty Reduction, Equity, and Growth Network’s Conference, September 6–7, 2012, Dakar for suggestions on earlier versions. The usual disclaimer applies.
See Winters et al. (2004) for a detailed discussion on the possible various channels for freer trade to affect poverty.
See Dollar and Kraay (2001) or Kpodar and Singh (2011) for example.
Moreover, as argued by Chang et al. (2009), policy measures are difficult to aggregate in a single indicator and do not say anything about the degree of their enforcement.
Countries are classified in the top (bottom) group if they belong to the top one-fourth (bottom three-fourths) of a rank distribution given by each conditional variable (financial development, education level and quality of institutions).
See Appendix 6.
References
Cite this article
TY  - JOUR
AU  - Maëlan Le Goff
AU  - Raju Jan Singh
PY  - 2014
DA  - 2014/07/23
TI  - Does trade reduce poverty? A view from Africa☆
JO  - Journal of African Trade
SP  - 5
EP  - 14
VL  - 1
IS  - 1-2
SN  - 2214-8523
UR  - https://doi.org/10.1016/j.joat.2014.06.001
DO  - 10.1016/j.joat.2014.06.001
ID  - LeGoff2014
ER  -