
The African Economic Partnership Agreements with the EU: Reflections inspired by the case of the East African Community☆
- DOI
- 10.1016/j.joat.2014.09.001How to use a DOI?
- Keywords
- F1; F4; O5
- Abstract
This paper appraises the likely effects of the Economic Partnership Agreement (EPA) between the East African Community (EAC) and the European Union (EU). Customs data are used to estimate the revenue and welfare effects of an EPA with and without an exception list. Revenue and welfare effects are rather small. The paper then discusses the benefits that would have occurred had the EAC-EU protocol on rules of origin been simplified and made more compatible with the multilateral trading system. An inclusion of services would have also helped achieve the objective of increased competitiveness in goods trade, while the time table for tariff reduction in the EAC should have been shorter. The paper suggests in closing that the present appraisal is applicable also to the other African EPAs.
- Copyright
- © 2014 Afreximbank. Production and hosting by Elsevier B.V. All rights reserved.
- Open Access
- This is an open access article under the CC BY-NC license (http://creativecommons.org/licences/by-nc/4.0/).
1. Introduction
At the concluding days of the Doha negotiations in November 2001, WTO members signed a waiver extending the Cotonou Partnership Agreement (CPA) which allowed the Cotonou trade regime to be extended provided that it became WTO-compatible, that is a reciprocal Free Trade Area (FTA). Negotiations were to be concluded by December 2007. Successful negotiations between the EU and 15 CARIFORUM countries of the Caribbean resulted in an agreement (the CA-EU EPA) that included reduction on barriers to trade in services as well as trade in goods. This “deep” agreement reflected a favorable balance in the trade-off between the benefits (internalizing the spillovers) and the costs (moving away from members’ preferred national policies) of a deep regional agreement as it resulted in the delegation of national sovereignty to negotiation teams at the regional level. Yet, after five years into the agreement, only six members had ratified it and only two had started tariff reductions. Difficulties in satisfying the necessary regulatory and policy changes, a lack of funding and a lack of technical support have been mentioned as reasons for the delays (South Centre, 2013). Further delays resulted from the EU’s request that the Mutual Recognition Agreements necessary for integrating services markets be carried out first at the CARIFORUM level.
This positive balance during the negotiation phase was absent for the other negotiating groups, especially in Africa where disparities among members in each negotiation group (large and small countries, landlocked and coastal, resource-rich and resource-poor, ethno-linguistic fractionalization) were greater than for the CA-EU negotiations, disparities that effectively blocked negotiations that could have led to a “deep” EPA as in the case of CARIFORUM. In the end, these negotiations settled in December 2007 for a series of Interim Agreements (IEPAs) that still preserved Duty-Free Quota-Free (DFQF) access to the EU for 35 ACP countries. For non-LDC ACP countries, this amounted to €100 million per year relative to GSP even though these countries have negative preferential margins at the product level because of EU preferences granted to competitors. Probably the most significant market access obtained from the negotiations was the relaxation of some rules of origin (RoO) requirements.1
Five years later, with the October 1, 2014 deadline for concluding “full” EPAs, non-LDC partners in those groupings that would not have reached an agreement would return to GSP status. This paper draws on the experience of the EAC, the African negotiation group that has gone furthest in integrating along the lines outlined in the CPA (see below) since it is a now a common market, a level beyond the common market envisaged by the EU when the CPA was launched. It gives evidence that the EAC-EU EPA will only result in a very marginal reduction in trade barriers by African partners and no extra access in the EU market since negotiations are only for goods trade and most members already have DFQF access.
Section 2 provides the background on the CPA and on the interim EPAs. The remainder of the paper turns to the EAC-EU EPA. Section 3 reports ‘traditional’ estimates of revenue losses based on statutory revenues and Section 4 gives more accurate estimates based on customs data for Rwanda and Uganda. These results suggest very small benefits from the final EPA even though the EAC is the only negotiation group that satisfied the ‘two-layer objective’ of the EU at the launch of the negotiations under the aegis of the CPA. Section 5 discusses some of the omitted elements in the agenda which would have led to larger gains for the EAC. Section 6 concludes.
2. The CPA rationale
The CPA sets out the following four core elements around which to build the EPAs:
- 1.
Differentiation: Keep differential and special treatment (SDT) taking into account the level of development using asymmetry to benefit especially vulnerable, landlocked and small island economies;
- 2.
Reciprocity: ensuring WTO-compatibility represents a radical departure from previous EU-ACP relations whose rationale is to liberalize ACP markets, foster competition, better resource allocation and enhanced investment, both foreign and domestic;
- 3.
Regionalism (two-layer objective): only in exceptional circumstances would negotiations be envisaged with individual countries, the conviction being that regional integration for ACP countries is the stepping stone towards a successful integration in the World Trading System;
- 4.
Development: EPAs are to be “economically meaningful, politically sustainable, and socially acceptable”.
The CPA objectives are laudable. It is likely that the absence of reciprocity in past EU-ACP relations contributed to their lack of integration into world markets. Even though difficult to implement, pushing for regional integration within heterogeneous groupings would lead to larger gains than if the groupings were more homogenous (de Melo and Tsikata, 2014). The development component deserves no comment. Finally, keeping SDT would have required that the EU does not extend preferences to other countries.
Apart from South Africa, which continues to export under its own free trade agreement (FTA) with the EU (the Trade, Development and Cooperation Agreement (TDCA)), the remaining African, Caribbean and Pacific (ACP) countries in the final stages of negotiating a ‘full’ EPA now export to the European market under one of the following regimes (listed in terms of increasing preferential access):
- •
the EU Generalized System of Preferences (GSP);
- •
the GSP+ sub-regime2;
- •
Everything But Arms (EBA) sub-regime in the case of LDCs which gives duty-free quota-free (DFQF) access to the EU;
Except for CA-EU EPA initialed in 2007, all other IEPA negotiations concentrated on Trade-in-Goods issues with much negotiating energy going to draw the exclusion list so as to reach the 80% tariff-free imports from the EU along with the corresponding timetable to reach that objective. In the end, the IEPAs did not result in the negotiation of a “full” reciprocal FTA since only 80% of imports from the EU were to have tariffs eventually set to zero. It is therefore interesting to have an idea of what has been negotiated as opposed to a full reciprocal FTA with all tariffs on EU imports set to zero and what might have happened under a deep agreement including barriers to trade in services.
As expected, a large number of LDCs (26 out of 50) that had duty-free-quota-free (DFQF) market access under the EBA initiative since 2002, have opted not to enter into an EPA agreement reflecting their desire to keep the status quo and therefore not to take up this possibility to liberalize domestic trade bilaterally even though it is politically more appealing than integrating on a unilateral or multilateral basis. In the end, it is the countries that were relatively advanced in their own regional integration with a non-LDC partner (i.e. the EAC and SACU) that opted to enter IEPAs, an indication that these countries value their regional integration efforts and potentially, are more reform-minded.
Table 1 summarizes what was negotiated under the IEPAs in 2007, and the phasing in of tariff reductions among ACP signatories. An inspection of columns 1–3 reveals a great diversity in the outcome of the different negotiation groups with respect to timing, the speed of tariff reduction, and products excluded from liberalization. At one extreme, Mozambique and Côte d’Ivoire start to liberalize immediately in 2008 with most liberalization up-front, the ‘cold-shower’ approach. At the other extreme, EAC does not start reducing tariffs on EU imports before 2014, with tariff reductions taking place over 19 years ending in 2033. These large differences in the timing of liberalization across groupings probably reflect a combination of several factors: the relative negotiating power/knowledge across negotiating teams; last minute haste on both sides; different development agendas across countries. Perhaps the most important determining factor was the relative weakness of the public sector in the face of the private sector whose interests are to maintain a status quo.
| Members (1) |
Phase 1 (2) |
Phase 2 (3) |
Phase 3 (4) |
Exclusions (5) |
|---|---|---|---|---|
| Cameroon | 2010–13 (24.5%) | 2011–17 (24.3%) | 2014–23 (30.2%) | 1217 (21%) |
| Côte d’Ivoire | 2008–12 (59.5%) | 2013–17 (10.6%) | 2018–22 (9.9%) | 517 (20%) |
| Ghana | 2009–13 (28.8%) | 2013–17 (42.6%) | 2018–22 (8.3%) | 1085 (20.3%) |
| EACa | 2010–14 | 2015–23 | 2020–33 | 1323 |
| Burundi | (29.7%) | (28.1%) | (23%) | |
| Kenya | (18.3%) | (4.2%) | (19.4%) | |
| Rwanda | (18.6%) | (3.2%) | (25.4%) | |
| Tanzania | (17.6%) | (2.4%) | (20.2%) | |
| Uganda | (20.4%) | (2.5%) | (17.3%) | |
| EAS | ||||
| Comoros | 2013 (21.5%) | 2014–22 (25%) | 2014–22 (34%) | 93 (19.3%) |
| Madagascar | 2013 (37.0) | 2014–22 (26.1%) | 2014–22 (17.6%) | 575 (19.3%) |
| Mauritius | 2008 (24.5%) | 2013–17 (29.1%) | 2013–22 (42%) | 185 (4.4%) |
| Seychelles | 2013 (62.1%) | 2013–17 (15.1%) | 2013–22 (20.4%) | 131 (2.5%) |
| Zimbabwe | 2013 (44.9%) | 2015–23 (14.7%) | 2015–22 (20.3%) | 716 (20.1%) |
| SACU | 2008 (55%) | 2008–12 (12.4%) | 2011–14 (0.8%) | 181 (16.7%) |
| Mozambique | 2008 50.8% | 2018 (2.6%) | (37.8%) | |
Notes: Phases refer to those agreed at the signing of the IEPA in 2007. In all cases: average value of imports over 2004–06. Since many agreements have not been ratified, it would be more accurate to state the number of years per phase rather than the actual years. For example for the EAC, if the agreement is signed in 2014, phase I would cover 2014–2018, phase II would cover 2019–2027, etc.
Columns: Columns (2) to (4) give the length of each phase with the percentage of EU imports moving to zero tariffs in parenthesis. In some cases, there is overlap in the phases indicating that some tariffs in a previous phase are still being reduced while new tariff reductions have started in the next phase. Column (5) gives the number of excluded tariff lines counted at HS-6 level followed by the percentage of imports from the EU in parenthesis. So for Cameroon, tariff elimination is over 13 years with phase I taking place during the period 2010–13 and involving 24.5% of imports from the EU. There are 1217 excluded tariffs lines at the (HS6 level) which count for 21% of imports from the EU (over 2004–2006).
All EAC countries have identical schedules.
The phasing of tariff elimination and product exclusion in the IEPAs.
Source: Carrère and de Melo (2008).
In any event, these negotiated schedules lacked credibility. Usually, tariff-reduction negotiations for all barriers to trade (tariffs and NTBs) in Free Trade Area (FTA) negotiations are spread over a less-than 10 year period (NAFTA, MERCOSUR, various enlargements of the EU). Here reductions are typically spread over twice as long a period while at the same time excluding a good chunk of bilateral trade. Common sense suggests that it is highly probable that these schedules will be interpreted as ‘the indefinite future’ and be subject to renegotiation as has just occurred for the recently signed ECOWAS-EU EPA.
At the time of writing in August 2014, an ECOWAS-EU EPA was signed on July 14, and on July 15, it was announced that a SADC-EU EPA was reaching signature stage. In the case of the ECOWAS-EU EPA very little reduction in trade barriers was finally negotiated.3 This is also the case for the SADC-EU EPA where the main benefit for 28 SADC members is the preservation of preferential access (beyond GSP) for fish, beef and sugar exports to the EU from Botswana, Namibia and Swaziland.
For the EAC, the full EPA includes three phases.4 The first one is the full implementation of the EAC’s CET which includes tariff liberalization for around 50% of EU imports in 2011. Even though the exception list to the CET (the so-called “Sensitive Item” (SI) list of products) is likely to be extended, the 5 EAC countries are full members of the EAC customs Union since 2010. Should this SI list grow, insofar as new goods are not on the extended list, the EPA will exclude products originating from the EU. The second phase includes the liberalization of some goods starting seven years after the signature of the agreement and the third one should start twelve years after the ratification. In short, if the agreement is signed as expected in 2014, the liberalization of 80% of imports from the European Union (among which 50% are already traded at zero tariffs) would start in 2020 and would end only in 2038. This is an extraordinarily long period that could only be justified if the fears of an invasion of imports from the EU are plausible. The next two sections show that this is most unlikely.
3. Revenue loss estimates
Exports from the EAC to the EU will be largely unaffected by the EPA since, apart from Kenya, they have DFQF access under EBA. So estimates of the EPA on revenues and resource allocation can be approximated by concentrating on imports by the EAC. All official tariffs are all equal to zero within the community and all countries have a common external tariff (CET). The CET includes two schedules: schedule 1 with duty rates under the three-band tax structure, i.e. rates applied for raw materials (0%), intermediate products (10%) and finished goods (25%), and schedule 2 with duty rates of sensitive items (the so-called ‘SI list’ in the range of [35%;100%]). Except for a few exemptions, the EAC’s tariff vis-à-vis the EU is the CET. Under this CET, a substantial share of imports from EU already benefits from 0% tariffs. The EAC thus satisfies the EU’s objective of helping the integration of ACP countries by a two-layer process of integration, the first one at the regional level already completed.
3.1. Estimates from statutory tariffs
Table 2 gives indicators of the importance of the EU in each EAC member and estimates of the revenue losses from implementing the EPA. For the 5 countries, around 60% of their imported products involve some imports from the EU (rows (1) and (2)) ranging from 30.4% of imports for Burundi to 12.8% for Uganda (row 5). Accordingly import-duty revenue from the EU is also higher for Burundi (37.6%) and Rwanda (24.1%) than for Tanzania, Kenya and Uganda (row 11). While the list of excluded goods should represent 20% of imports from the EU, since the list is the same for all EAC countries but EU trade shares differ across countries, the share of excluded imports will be different across countries ranging from 14.8% for Tanzania to 24.3% for Burundi (row 6).5 Using statutory tariffs and 2011 imports, the aggregate (over the 3 phases) direct revenue loss is estimated at 40% of revenues (from the EU), ranging from 37% for Rwanda to 50% for Tanzania (row 13). In terms of leeway for government spending, the greatest loss would be for Tanzania as revenues from tariffs on EU imports would be cut in half, contributing only to 9.2% of government spending (row 10).
| Burundi | Kenya | Rwanda | Tanzania | Uganda | |||
|---|---|---|---|---|---|---|---|
| (i) Number of HS6 lines with positive imports 2011 | Total | (1) | 1566 | 3880 | 2988 | 3984 | 3658 |
| From EU | (2) | 930 | 2702 | 1462 | 2589 | 2159 | |
| Excluded lines | (3) | 553 | 1116 | 977 | 1119 | 1090 | |
| (ii) Imports | Total ($ thousand) | (4) | 332,009 | 10,705,526 | 1,407,440 | 10,572,156 | 5,331,288 |
| EU import share | (5) | 30.4% | 18.4% | 18.8% | 15.8% | 12.8% | |
| Share of imports excluded from the EPA (% of EU imports) | (6) | 24.3% | 22.8% | 22.1% | 14.8% | 18.1% | |
| Share of EPA (% of total imports) | (7) | 23.1% | 14.2% | 14.7% | 13.5% | 10.5% | |
| (iii) Tariff revenuea | Average applied statutory tariffb | 8(a) | 5.5% | 9.5% | 7.5% | 6.8% | 5.9% |
| Average applied collected tariffc | 8(b) | (4.3%) | (3.3%) | ||||
| Total tariff revenue (% of GDP) | (9) | 0.8% | 3.0% | 1.3% | 3.0% | 2.0% | |
| Tariff revenue (% of government spending)d | (10) | 2.8% | 18.1% | 14.2% | 18.4% | 17.8% | |
| From EU (% of import revenue) | (11) | 37.6% | 14.0% | 24.1% | 11.8% | 11.4% | |
| (iv) Direct revenue loss from EPA statutory tariffs | In thousand dollars | (12) | 2617 | 51,770 | 7358 | 42,566 | 15,585 |
| % of initial revenue for imports from EU | (13a) | 38.1% | 36.5% | 37.3% | 50.0% | 40.4% | |
| (total import revenue) | (13b) | (6864) | (141,822) | (19,708) | (85,089) | (38,604) |
Revenue loss estimates take account of exceptions.
Computed at the HS-6 level on the basis of statutory tariffs.
Import-weighted.
Calculated from customs data: Rwanda (2012), Uganda (2011).
Source: WDI indicators.
EU-EAC trade by country and revenue loss estimates from statutory tariffs.
Source: Melo and Regolo (Tables 2, 3, 4) calculations using BACI database/TRAINS trade data (2011).
3.2. Estimates from customs data
The direct first-order estimates from statutory tariffs in Table 2 have the advantage of not requiring data beyond trade volumes and official tariff schedules, but they have two drawbacks. First, they assume no response of imports to the elimination of tariffs by EAC members on their imports from the EU. Second, they fail to take into account exemptions from tariff duties that are typically more important for products in the highest tariff bands (see below). From a revenue perspective, both simplifications distort the estimates from the EPA as import response to tariff cuts also affects the base from which revenues from other taxes (VAT and excise) are collected at customs.
Two approaches could remedy this shortcoming: partial equilibrium estimates that can be carried out at the HS-6 product levels on the basis of customs data and full economy-wide estimates based on computable general equilibrium (CGE) approach that takes into account secondary effects.6 The partial equilibrium approach taken here has two advantages. First, for welfare cost estimates, it takes fully into account the variance in tariffs across products (for a given average tariff, the welfare costs are higher the greater the variance across tariffs). Second for revenue loss estimates, it lends itself to taking into account tariff exemptions. On the other hand, CGE-based estimates have the advantage of estimating the supply response and income redistribution effects while taking into account economy-wide budget and factor endowment constraints, all of which would be important for extensive changes in trade policy. This is not the case here where changes in tariffs are small as tariffs are only to be eliminated on some imports from one partner, with the reduction taking place for products with low tariffs. Therefore, the partial equilibrium approach taken here is arguably more appropriate to estimate the likely effects of the negotiated EPAs.
Table 3 compares average applied and statutory tariffs by tariff bands based on customs data for Rwanda (2012) and Uganda (2011) using the TRIST (for Tariff Reform Impact Simulation Tool) simulation package (see Brenton et al., 2011).7 The applied tariffs take account of tariff exemptions (e.g. imports of goods in transit, imports for ministries in public agencies, international agencies, non-profit and charity organizations—all entities exempt from duties according to the revenue code). For both Rwanda and Uganda the import-weighted applied tariff is much lower (respectively 4.3% and 3.3%) than the corresponding average statutory tariff (of respectively 7.5% and 5.9%) (Table 2, col. 8b).
| Statutory and excluded | Number of products | CIF import value (USD million) | Import share | Share of tariff revenue | Simple average applied tariffb | Weighted average applied tariff |
|---|---|---|---|---|---|---|
| 3a: Rwanda | ||||||
| 0% | 665 | 161 | 59.4% | 0.0% | 0.00% | 0.0% |
| 10% | 425 | 38 | 14.0% | 15.7% | 7.5% | 4.2% |
| 25% | 297 | 17 | 6.2% | 8.4% | 17.1% | 5.1% |
| Excludeda | 664 | 56 | 20.5% | 75.9% | 20.1% | 13.6% |
| Total | 2051 | 271 | 100% | 100% | 10.6% | 3.7% |
| 3b: Uganda | ||||||
| 0% | 924 | 441 | 69.6% | 0.0% | 0.00% | 0.0% |
| 10% | 523 | 79 | 12.5% | 21.3% | 7.2% | 5.7% |
| 25% | 371 | 39 | 6.2% | 32.8% | 17.0% | 18.0% |
| Excludeda | 761 | 75 | 11.8% | 45.9% | 17.8% | 13.1% |
| Total | 2579 | 635 | 100% | 100% | 9.0% | 3.4% |
Number of lines excluded from tariff removal. Excluded goods include all sensitive items of the CET imported by Rwanda and Uganda. Taking apart the specific tariff, the average statutory tariffs on excluded goods are of 24.7% for Rwanda and 12.8% for Uganda.
Average applied tariff from customs data for the corresponding tariff lines.
Distribution of applied tariffs on trade by statutory tariff band.
Source: Authors’ calculations from customs data.
As expected, the gap between applied and statutory rates is greatest for the 25% tariff band (the simple average applied tariff is of 17%), a well-known stylized fact for low-income countries that is usually not taken into account during the negotiations. Thus, exemptions are concentrated on high tariffs, precisely those tariffs that are the cause of the greatest losses in efficiency. Goods excluded count for between 46% (Uganda) and 76% (Rwanda) of tariff revenues from the EU, a large difference in spite of a common list. Large differences must have certainly contributed to the difficulties encountered in reaching agreement on a single list of excluded products. This is probably an important contributing factor to why several IEPAs were negotiated at the country (e.g. Cameroon Côte d’Ivoire and Ghana) rather than at the regional “two-layer” level wished by the EU.
For Rwanda and Uganda, all imported sensitive items are in the list of excluded goods.8 The import weighted average statutory tariffs on excluded goods were of 4.7% and of 12.8% in Rwanda but actual weighted average collected tariff on these goods is around 13% reflecting the common observation that higher statutory tariffs are accompanied by a lower implementation rate so the exclusions are in effect negotiated on applied tariff rates that could be up to half the official rates (see Table 5 of de Melo and Regolo, 2013).9
Table 4 reports the results of two EPA scenarios for imports, tariff revenue and revenue from all border levies (i.e. tariffs, VAT and excise taxes), the first scenario based on the exclusion list, the second from a “full” EPA in which tariffs are removed on all EU imports. The estimated losses of tariff revenue in the first scenario are low, of respectively 3.3% for Rwanda and 8.1% for Uganda. Moreover, once the positive effect of the increase in imports on other border levies is taken into account, the total losses of tax levies are negligible (of 0.8% for Rwanda and of 1.3% Uganda). Even for the “full” EPA estimates (cols. 2 and 4), revenue loss estimates are low, especially when compared to the direct estimates from statutory tariffs (Table 2, row 13b).
| Rwanda | Uganda | |||
|---|---|---|---|---|
| EPA with official EAC exclusion list (1) |
EPA with no sensitive product list (100% liberalized) (2) |
EPA with official EAC exclusion list (3) |
EPA with no sensitive product list (100% liberalized) (4) |
|
| % change in imports | 0.1% | 0.5% | 0.2% | 0.4% |
| % change in tariff revenue | −3.2% | −13.2% | −8.1% | −15.0% |
| % change in total border levies revenue (VAT, excise taxes and tariffs) | −0.8% | −3.3% | −1.3% | −2.5% |
| % change in collected applied tariff rate | −3.3% | −13.6% | −8.29% | −15.39% |
Note: Figures reported here are results for total imports; total tariff revenue and total tax revenue from all partners (including the EU).
Revenue estimates of full EPA with and without exclusion lists.
Source: Melo and Regolo (Table 5) from customs data: 2011 for Uganda, 2012 for Rwanda.
These estimates do not take into account that the VAT collected on intermediate products at the borders would be reimbursed to firms. However, since the estimated changes in VAT revenue following the implementation of the EPA are approximately equal to 0% (see Fig. 1 and Tables A.5.5.a and A5.5.b in de Melo and Regolo, 2013), taking account of VAT repayments would not affect the results of Table 4 significantly. Actually, in Table 4, the difference between the % change in tariff revenue and the % change in total border levies revenue is mainly due to the low share of tariff revenues in the total border levies revenue (of respectively 24% and 16% for Rwanda and Uganda, see Table 4 of de Melo and Regolo, 2013).
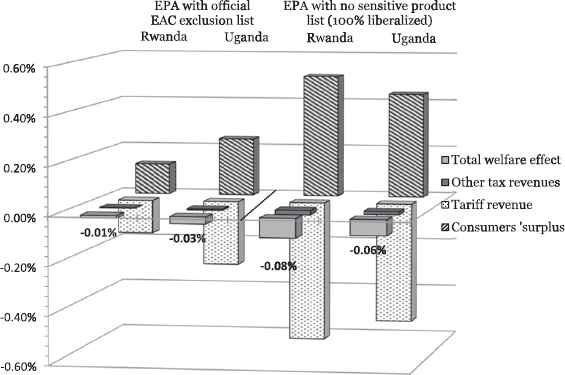
Welfare estimates of EPA on Rwanda and Uganda. Source: Melo and Regolo, Fig. 1. Values are percent of total initial imports. From front to back: Total welfare effect, other tax revenue, tariff revenue and consumer surplus.
4. Efficiency estimates
Achieving greater reciprocity in EU-ACP goods trade relations was necessary for non-LDC ACP countries to maintain and secure market access in the EU. While the exclusion list shields the two countries from the expected loss of tariff revenue, it also results in a smaller reduction in average tariffs which would be the source of efficiency gains via an increase in consumer purchasing power, provided that diversion of imports away from other potentially more efficient partners (e.g. the rest-of-the-world and China especially) towards the EU are not too large. Fig. 1 gives the decomposition of the welfare effects of implementing the EPA (based on import values of 2011 for Uganda and of 2012 for Rwanda). Removing tariffs on all goods results not only in a larger gain in consumers’ surplus, but also in a larger revenue loss, a reflection of the importance of excluded goods in government revenue. In the end, however, the decomposition in Fig. 1 shows a very small effect on welfare for both countries of implementing the EPA currently under negotiations.10
Eliminating tariffs preferentially for imports from the EU gives rise to two well-known effects: (i) pure trade creation, i.e. an increase in the volume of imports from the EU, and (ii) trade diversion as imports from other partners are replaced by imports from the EU. However, there is “trade diversion” only if the good imported is produced less efficiently in the EU than in countries subject to the MFN tariff, and there is “trade correction” when deviated imports were previously originating from countries which already benefited from preferential access prior to the EU being granted the tariff reduction. This is not trade diversion as it actually reflects a move of consumption towards a more efficient producer that was previously disadvantaged in terms of market access. Contrary to trade diversion, trade correction is not welfare reducing. Fig. 2 shows that the increase in imports from the EU is largely dominated by trade creation which represents approximately 83% of the import increase, although trade diversion is substantial (around 13%) and slightly higher under the full liberalization.11
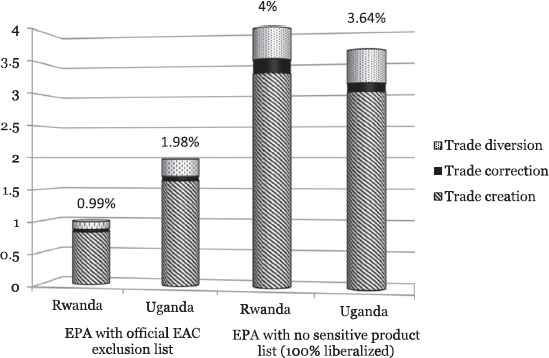
Estimated changes in EU imports, trade creation and trade diversion. Source: Melo and Regolo (Fig. 2). Note: Trade creation is the share of increase of imports from EU which has not been diverted from other partners; Trade diversion is the share of increase of imports from EU which was previously imported from other partners with an applied tariff higher or equal to the previous applied tariffs from EU; trade correction is the share of increase of imports from EU which was previously imported from partners who were benefitting from preferential applied tariffs compared to the EU.
These estimates are at the HS8 product line level. Collapsing these estimates to 72 ISIC sectors shows that for the “realistic” EPA (i.e. partial rather than full tariff elimination to all partners) the estimated price decline would exceed 1% only in 4 sectors in Rwanda and in 12 in Uganda.12 Not surprisingly, the price decreases are concentrated in activities producing intermediate products rather than final products which are produced locally and for which lobbying activities would have opposed tariff reductions. This also means that the EPA will have more impact on local firms’ costs (e.g. lower cost of electricity) than on the purchasing power of households where a large share of household expenditures is dedicated to food.
How plausible are these estimates suggesting few changes from a status quo? Do they vastly under-estimate the likely gains from the contemplated EPA? On the positive side suggesting greater gains is the recognition that these are static first-order (i.e. do not take into account supply response) estimates that do not take into account several factors that would contribute towards resulting in an overall positive effect. To start with, the estimated increase in imports is at the intensive margin since new products—another source of welfare gain—this time at the extensive margin, are not accounted for. Other well-known positive effects of liberalization for which there is increasing empirical support are not taken into account either (e.g. Goldberg et al., 2009). The first is the pro-competitive effect of greater competition as imports remove market power for incumbent domestic firms. Lower price–cost margins raise welfare. The second effect is increased efficiency as low-productivity firms exit the market. The third is increased scale efficiency as incumbent firms move down their cost curves. More and better suited varieties are to be expected from the implementation of a full EPA as European products are close to the frontier in terms of costs and quality.13 However, if one recognizes that the reductions in tariffs are for one partner, are small and only for products with relatively low tariffs, these other positive effects would only be significant for a ‘full’ EPA with no exclusions.
On the negative side, suggesting that the estimates may not understate the likely gains is the assumption of a full utilization of preferences. While rates of preference utilization are on the rise world-wide (see WTO, 2011; Keck and Lendle, 2012 for developing countries in developed countries), rules of origin (RoO) that are necessary to prevent trade deflection may represent an important obstacle to realizing these gains. Indeed, in all PTA negotiations since NAFTA, RoO have been the subject of intense negotiations largely driven by private-sector interests. Of interest to EAC producers in the EPA negotiations are the apparel and fish sectors where EU MFN rates are over 10%, implying substantial potential market access if RoO are not too strict. As mentioned above, simpler rules for both sectors have already been obtained as part of the IEPA negotiations.14
Of interest to EPA consumers is that the RoO that are necessary to prevent trade-deflection should be kept simple, i.e. they should be ‘business-friendly’ rather than ‘business-owned’ since, in the end, the objective of granting market-access is to favor the partner. The final stages of the EU-EAC negotiations show that 372 products are under negotiation for Product-Specific Rules of Origin (PSRO) and while the EU-EAC protocol (July 2013) is 78 pages long, the corresponding list of proposed RoO has 180 pages! PSRO are tougher for the EU for 70 products and only for 4 products for the EAC and there is only disagreement for 5 products (see de Melo and Regolo, 2013, Table 8). One way to interpret this pattern is to conclude that the EAC has potentially obtained extra protection from these more stringent rules for 70 products. From an efficiency point of view, however, it is possible that RoO for imports from the EU will be sufficiently restrictive as to significantly reduce the import response and efficiency gains below the levels estimated in this paper.
5. A more ambitious agenda would have addressed simplifying rules of origin and deepening integration by opening services sectors
The estimates in this paper are narrowly-based, only taking into account the response of imports to the reductions in tariffs that will take place when a full EPA is implemented. The small magnitude of the estimates on revenue and welfare are attributable to the already relatively low tariffs embodied in the EAC’s CET and the relatively small share of EU imports. However, in the long-run, other efficiency-raising effects under a more ambitious agenda are likely to occur. Estimating these is beyond the scope of this paper although a range of orders of magnitude from other studies is mentioned below, notably relating to rules of origin and to the deepening of integration to include services, which would have secured larger gains from the negotiations.
On RoO, the extensive evidence on their cost-raising effects suggests that the way ahead is not to haggle over the particular content of PSRO as in the ongoing EAC-EPA negotiations, but to make them simpler.15 For example, in their highly trade promoting FTAs, Asian FTAs have usually avoided PSRO with two broad categories: wholly obtained for agricultural products and a single threshold of non-originating materials of less than 60% of the FOB price (Cadot et al., 2007). This much simpler rule has served well ‘factory Asia’. The negotiations should have also pushed for making RoO more compatible with the multilateral trading system as proposed by Estevadeordal et al. (2009). Multilateralizing RoO would imply adopting rules that would ensure that at least the qualifying production methods in a given sector would remain relatively similar across export markets.16
As to services, the African paradigm for regional integration continues to be one of linear integration, following stepwise integration of goods, labor and capital markets, and eventually monetary and fiscal integration. This has been the route followed by the EAC, the most advanced Regional Integration Agreement as it moved to a customs union in 2005 then to a common market in 2010 with the next planned step being a monetary union for 2015. In this linear integration model trade in services only gets attention when the common market stage is reached.
This focus on goods markets, or ‘shallow’ integration also applies to the EPA negotiations where there is reluctance to liberalize the services market. It is ironic that trade in services has been largely missing in EAC’s regional integration agenda, at least until recently, since in a world where the production chain is increasingly delocalised, a well-functioning regulatory environment and a relatively open services sector is required to attract the FDI. And FDI are needed to provide the backbone services to compete in goods markets.
While caution is called for when opening services sectors, estimates of gains from a successful opening of the services sector are likely to be large relative to the gains from removing remaining tariffs. Gravity-based simulations of trade costs for services (mode 1 and 2) for industrialized countries over the period 1995–2007 by Miroudot et al. (2013) suggest that trade costs in services are about two to three times higher than trade costs in goods and that, contrary to trade costs in goods, they have remained relatively constant as regulatory barriers have not been reduced even in the EU where heterogeneity in trade costs remain high. Similar results are likely to hold for developing and low-income countries, suggesting large gains to be reaped from reforming the regulatory environment even though liberalization requires technical capacity.17
As an example of orders of magnitude of potential gains from liberalization of services sectors, in a series of papers using simulation methods similar to TRIST but in full general equilibrium models of the economy, Tarr and co-authors have estimated the ex-ante welfare effects of liberalization of services sectors in Tanzania and in Kenya, two EAC members. In their model, goods-producing sectors are protected by tariffs, as are services sectors where in some cases, services by foreigners are not provided under protection because the market is closed. Opening the market attracts FDI which in turn lowers the cost of producing goods because a greater number of varieties of intermediate goods become available and the cost of services fall. In their simulations, the gains from reducing barriers in services trade are a multiple of the gains from eliminating protection. Furthermore, their simulations show that there are complementarities between reductions in barriers to trade in services and in goods as lower barriers to services trade reduce the costs for goods production.
In the case of Tanzania, Tarr and Rutherford (2010) estimate that gains from service reform could reach 5% of consumption (4.5% of GDP) in the medium term. They also find that productivity gains from the net introduction of new varieties of service providers and from additional varieties of goods could raise the gain from services reform to 14.1% of GDP in the long term mostly from regulatory reforms for water and road transport, and for the banking sectors. In the case of Kenya, Balistreri and Tarr (2011) contrast the results from an opening of services sectors unilaterally to all partners on a non-discriminatory basis, regionally with African partners, and also with the EU as would be the case under the EPAs. They find that the preferential arrangement with the EU that includes both goods and services would generate gains for Kenya of 0.5% of consumption, gains coming primarily from the preferential liberalization of services (0.3%), rather than from liberalization of goods. This gain is three times larger than the effect if the preferential liberalization of services were with the Africa region (of 0.1%). They also estimate that wider liberalization, with more partners, i.e. multilaterally, would yield much larger gains due to providing access to a much wider set of services providers.
Like the ones in this paper, these simulations are ex-ante, requiring caution in interpretation even though the mechanisms included in the models have strong empirical grounding across a spectrum of environments. It is likely to be detrimental to the EAC to rely solely on the standard mercantilist approach of exchange of market access for goods. It will not work as there is no new market access for the EAC in the EU. In the EU, sectors such as finance, telecommunications and information technology are already open to all service suppliers, including those from Africa. On the other hand, the EU is very restrictive and not prepared to make offers in the area of greatest potential benefit for Africa — the temporary movement of unskilled workers.
6. Conclusions
Achieving greater reciprocity in EU-ACP relations for goods trade was necessary for non-LDC ACP countries to maintain and secure market access in the EU market. Originally, the CPA was to help promote deeper integration within the groupings and to extend negotiations to cover trade in services, now the backbone for competitiveness in goods markets for countries wishing to participate in regional production networks. Only the CA-EU EPA achieved this objective, though with limited success at implementation so far. The others concentrated their negotiations efforts on goods trade. The focus was on drawing exception lists to minimize losses in government revenues, the inclusion or not of an MFN clause and detailing product-specific rules of origin.
This paper estimates the effects of the EAC-EU EPA, an interesting case since EAC is the most integrated regional grouping in Africa with a reasonably functioning Customs Union since 2005 (and a common market since 2010), much along the two-layer regional objective set out by the EU at the launch of the CPA. Revenue losses and welfare estimates are carried out at the HS-6 product level. For Rwanda and Uganda, estimates from customs data suggest that revenue losses will be half of those drawn from statutory tariffs. Based on customs data, under the negotiated exception list, government revenues would decline by 0.8% for Rwanda and 1.3% for Uganda while a more ambitious full liberalization (no exceptions) would still only result in losses of 3.3% and 2.5%, respectively. Impacts on welfare and on efficiency are also estimated to be negligible. As they were negotiated along the same lines, similarly small revenue and efficiency estimates would emerge from estimates of the other EPA negotiations.
The experience of the EAC and the results of this paper suggest that the negotiations which have focused on a ‘shallow’ exchange of market access in goods markets will have negligible effects. Negotiations should have rather focussed on providing the aid-for-trade resources to provide the knowledge platforms and technical assistance learned from other experiences with integration in services sectors, in order to ensure that the appropriate supportive regulatory framework in the EAC is adopted sector by sector. The Trade Facilitation Agreement signed in Bali in December 2013, if it is to be implemented, would provide the necessary framework and resources for technical support to reduce trade costs, thereby contributing to Africa’s integration into the World Trading System.
Footnotes
This paper draws on de Melo and Regolo (2013). This paper benefited from the financial support of the FERDI (Fondation pour les Etudes et Recherches sur le Développement International) and of the program “Investissement d’Avenir” (reference ANR-10-LABX-14-01) of the French government. Thanks also to IGC for financial support and to Céline Carrère, Augustin Fosu, Anne-Marie Geourjon, Richard Newfarmer and a referee for comments. Views expressed here are those of the authors, who take responsibility for any remaining errors.
WTO (2011, p. 128) estimates that adjusted preferential margins for African countries are about 1 percentage point. Rules of origin were relaxed for fisheries and for textiles and apparel as the EU followed suit on AGOA and adopted the single transformation rule (see de Melo and Portugal-Perez, 2014). Arguably, this was the most significant market access achievements for LDCs resulting from the IEPAs.
The GSP arrangement and its sub-regimes exclude those among the non-LDCs who are negotiating the follow-up to the current interim European Partnership Agreements. The GSP+ is a specific incentive arrangement which offers deep tariff cuts for vulnerable countries that ratified and implemented international conventions relating to human and labor rights, the environment and good governance. It concerns additional tariff reductions for essentially the same 66% tariff lines as for the standard GSP arrangement.
Nigeria opposed the agreement in the final stages, insisting until early July on renegotiating key provisions including requiring that 181 tariff lines be reclassified within different categories of the offer. In the end, countries agreed that the agreement would be revised every five years on the basis of results of an economic impact study and that the generous safeguard measures for ECOWAS’s 5-band common external tariff (an external tariff up to 70% for a five year period since the start of the implementation of the CET is scheduled for early 2015) thus giving each country plenty of room to protect domestic industries.
A more accurate description of the liberalization involved should state phases by number of years since starting with the year the final agreement is signed (which will be 2014 because of the October 1, 2014 deadline) and the amounts involved should be based on 2014 data. For the EAC-EU EPA, as of August 2014, an agreement has been reached on the MFN clause and on Rules of Origin However, the two parties disagree on provisions for agricultural subsidies that farmers in the EU benefit from, duties and taxes on EAC exports and non-trade issues such as good governance and transparency. On taxes on exports, the EAC wants to maintain its authority to determine when to impose the duties without seeking authorization from the EU. On subsidies, EAC members insisted that there must be a provision in the EPA that limits or excludes the EAC as a destination for EU agricultural exports benefiting from subsidies. Finally, EAC has reservations about including a non-execution clause that permits the deal’s suspension in cases of proven human rights violations.
This estimate based on 2011 imports represents a large difference across countries and will most likely be different by the time the EPA is fully implemented. However, even though this exclusion was negotiated on the basis of average imports over 2004–06, in 2011, excluded goods represent 19.3% of EAC imports from the EU (not shown in Table 2). The differences in shares in row 6 reflect differences of trade patterns and differences in bargaining power across EAC members result in a much higher share of product under negotiation in the EPA for Burundi (around 23.1%) than for example, for Kenya and Uganda (of respectively 14.2% and 10.5%).
Fontagné et al. (2011) give estimates of completing the six EPAs. Their results show small welfare and revenue effects.
Customs data for the other EAC members were not available. The discussion paper gives a detailed explanation of how the data was prepared for the simulations and a more detailed explanation of the results summarized here.
Note that sensitive items have statutory ad valorem tariffs between 35% and 100% and some have specific tariffs (for example, tariff on worn clothing is: “35% or USD 0.20/kg whichever is higher”). Specific tariffs affect only 2 products HS8 imported from the EU. For these products as for the other product, TRIST computes the corresponding applied tariff using the ratio between import revenues and CIF value.
Damuri (2012) reports that for 15 bilateral agreements involving the QUAD, 7% of the products in the sample involving 11,000 products are excluded either temporarily or permanently. These exclusions are concentrated in the food and agricultural sectors where political-economy motivations for maintaining protection are high.
Amounts are $191,000 and $1.287 million respectively for Rwanda and Uganda for the EPA with exclusions and $1.440 million and $2.898 million when there are no exclusions. These estimates assume an elasticity of substitution between partners of 1.5, and an import price elasticity of demand of −1.0. Doubling both elasticities would lead to small positive welfare effects in spite of a larger revenue loss as imports from non-EU partners fall.
A decomposition of trade diversion by origin shows that trade is diverted mostly from China and from the rest-of-the-world rather than from COMESA partners (see de Melo and Regolo, 2013, Fig. 3).
The price to pay for product-line estimates is that inter-industry linkages are not taken into account. Since the estimates suggest that intermediates or semi-processed are the most affected products, a fall in their price will raise the value-added price, and hence the profitability, of downstream sectors.
An order of magnitude is provided by Goldberg et al. (2009) estimates for India’s trade liberalization which show that 65% of the increase in Indian imports following trade liberalization was for new HS products with 82% coming from new varieties, the new varieties being concentrated on intermediate inputs with 70% coming from OECD countries. They estimate that the new varieties generated an additional 4.7% decline in the imported input price index and that firms developed new products.
de Melo and Portugal-Perez (2014) estimate that the move by the US under AGOA to abandon the ‘triple transformation rule’ (cotton → yarn → textile → apparel) to a ‘single-transformation’ rule (the so-called “special rule”) conferring duty-free access to apparel regardless of the origin of fabric increased apparel exports to the US by about 168% for the top 7 (out of 22) qualifying African exporters in the AGOA group. For the EU, the corresponding product-specific RoO required that apparel also be manufactured from qualifying yarn (i.e. yarn originating in the country or in the EU) following a double transformation process (yarn → textile → apparel) in the beneficiary country. The EU’s decision to move to the single-transformation rule when it revised its rules of origin in 2010 is a welcome move in the direction of simplifying RoO.
Cadot and de Melo (2007) and WTO (2011) survey the estimates of the costs of rules of origin.
WTO (2011, box E2) elaborates on rules that could be negotiated at the WTO. Convergence in rules would be helped by capping cumulation zones as the restrictiveness of the current RoO across RTAs are positively correlated with the cumulation zone.
Liberalization of services sectors is difficult to implement. As discussed in Brenton et al. (2010), it requires considerably technical capacity and there is the risk that the gains from greater competition by giving market to foreigners will run against the social objective of providing services to the poor as the foreigners eschew servicing them because they are the least profitable to serve. Regulatory reform should also accompany trade liberalization. Pitfalls in harmonizing standards to EU (or Northern norms in general) should be clearly weighed to avoid premature harmonization to Northern standards (Disdier et al., forthcoming) or errors like those in the harmonization of milk standards (Jensen and Keyser, 2012).
References
Cite this article
TY  - JOUR
AU  - Jaime de Melo
AU  - Julie Regolo
PY  - 2014
DA  - 2014/11/07
TI  - The African Economic Partnership Agreements with the EU: Reflections inspired by the case of the East African Community☆
JO  - Journal of African Trade
SP  - 15
EP  - 24
VL  - 1
IS  - 1-2
SN  - 2214-8523
UR  - https://doi.org/10.1016/j.joat.2014.09.001
DO  - 10.1016/j.joat.2014.09.001
ID  - deMelo2014
ER  -