
Trade dependence, liberalization, and exports diversification in developing countries☆
- DOI
- 10.1016/j.joat.2018.09.001How to use a DOI?
- Keywords
- C33; F63; O19; O55
- Abstract
This paper explores the relationship between trade, trade liberalization, and exports diversification in developing and Sub-Saharan African (SSA) countries. The non-parametric analyses indicate that developing countries that are more open to trade (based on trade intensity) tend to have more diversified exports structures than those that are classified as less open. However, for SSA countries the non-parametric test shows that countries that are more open to trade have less diversified exports structures. Regarding the parametric analysis, the findings provide further evidence that trade liberalization, in the form of lower tariffs, contributes to exports diversification in developing countries, and the results for the long term are even stronger for SSA countries. With regard to trade intensity, the parametric estimations also confirm the results that trade is associated with diversification in developing countries and in SSA countries in the short term; however, for SSA countries, it actually leads to concentration in the long term, consistent with the non-parametric results. The empirical analyses also show that human capital, GDP per capita and institutions, play important roles in exports diversification.
- Copyright
- © 2018 Afreximbank. Production and hosting by Elsevier B.V. All rights reserved.
- Open Access
- This is an open access article under the CC BY-NC license (http://creativecommons.org/licences/by-nc/4.0/).
1. Introduction
Sub-Saharan African (SSA) countries have traditionally depended on a narrow range of primary products and a relatively small number of markets for their exports. The development implications of exports concentration on products, sectors, and markets are potentially significant, not only for SSA countries but also for developing countries in general. Concentration in sectors with a limited scope to ignite productivity and product quality could result in low growth and may preclude the possibilities of achieving sustained employment creation and income upgrading (Imbs and Wacziarg, 2003; Hausmann et al., 2007). Furthermore, a lack of diversification may increase vulnerability to adverse external shocks and, hence, affect exports earnings and macroeconomic stability. Thus, for vulnerable countries such as those of Sub-Saharan Africa, diversification into manufacturing and more technology intensive sectors, including agroindustry, has the potential to promote economic growth, create jobs, and reduce dependence on primary commodities.
This paper examines the role of trade and trade policy in the diversification process in developing countries. It employs both parametric and non-parametric techniques to shed light on the relationship between trade, trade policy and diversification in a sample of 144 developing countries over the period 1970–2015. It also incorporates the roles of other structural and policy variables that may affect exports diversification, controlling for the direct impact of the studied relationships in Sub-Saharan Africa. This study is important in at least two respects. The first is that although the role of trade and trade policy in the development process is well-documented, there is less empirical research on their roles in fostering export diversification or structural transformation, particularly in Africa and the Least Developed Countries (LDCs). Over the past three decades, African countries and LDCs have increased their dependence on trade and have also adopted more liberal trade regimes.1 Yet, they have not made any significant progress in terms of diversifying their export structure, suggesting that the realization of any potential benefits of trade for diversification is not necessarily automatic and may depend on domestic policies and the macroeconomic environment facing a country. In this context, there is the need to provide empirical evidence on the role of trade in the diversification process in Africa and LDCs. The second reason why this study is important is that unlike existing studies, this paper employs both non-parametric and parametric techniques to examine the nexus between trade and diversification.
Theoretically, the relationship between trade and diversification depends on the model or framework considered. Traditional trade models suggest that trade fosters specialization via efficient reallocation of employment, capital, and resources across sectors, in line with a country’s comparative advantage, but more recent theoretical models suggest that trade can facilitate diversification. For example, Teignier (2018) shows that changes in productivity and reductions in trade barriers affect sectoral reallocation and, hence, growth and transformation. Using a general equilibrium framework, Dessy et al. (2010) also demonstrate that trade can promote diversification and transformation in developing countries.
Empirical research shows that diversification in exports and in domestic production have been conducive to economic growth, although a vast heterogeneity is observed among developing country groups and regions. Increased diversification is also associated with lower output volatility and greater macroeconomic stability (e.g., Agosin et al., 2012). Therefore, trade can potentially play a central role in developing countries’ development prospects, but whether trade fosters or hinders diversification in developing countries is a question that has to be answered at the empirical level. To this end, this paper attempts to shed new light on the question of using a variety of econometric techniques. The paper proceeds as follows. Section 2 provides a brief survey of the literature. Section 3 examines the trends in trade and exports diversification in the sample. Sections 4 and 5 present the empirical analyses. Section 6 concludes.
2. What does the literature say about trade and diversification in developing countries?
Concerns about the harmful effects of high dependence on primary commodity exports are founded on the assumption that primary commodity exporters are affected by the secular deterioration in their terms of trade, and primary exports may be characterized by high price volatility and low productivity growth (Prebisch, 1950, 1959; Singer, 1950). Sachs and Warner (2001) argue that the so-called Dutch-disease leads to concentration in resource exports, implying fewer possibilities for productivity growth, hence representing a transfer of income from developing to developed countries.2 In this setting, import substitution and export promotion policies have been adopted by governments of developing countries, with varying degrees of success, as strategies to reduce exports concentration and promote manufacturing sector development.
The literature shows that exports diversification has the potential to positively contribute to growth and development through several channels. First, increased investment in a broad range of activities and sectors enhance the sources of income and contributes to mitigating the adverse effects of export instability and fluctuations in the terms of trade — particularly in Africa and the LDCs (Edwards, 2009). Second, diversification can serve as a distributional instrument to channel revenues from mineral- and resource-based sectors to other sectors of the economy, thus building the foundation for a stable inflow of revenues while accounting for intergenerational equity (Go and Page, 2008). Third, the diversification of exports is also associated with reduced fluctuations in foreign exchange earnings, increases in GDP and employment, higher value addition, and improvements in the quality of manufactured products (Hausmann et al., 2007; Osakwe, 2007; Elhiraika and Mbate, 2014).
Empirical research confirms the theoretical predictions that international trade in goods and factor services is explained by differences in comparative advantages across countries, but some argue that without a minimum level of development, the benefits of exports promotion and diversification will not be realized (e.g., Edwards, 1993; Imbs and Wacziarg, 2003).
Exports diversification entails not only increasing the variety of goods exported but also moving into goods of higher quality and new markets (Bernard et al., 2007; Hausmann et al., 2007; Brenton and Newfarmer, 2009). More sophisticated exports baskets and higher technology intensity are more likely to act as catalysts for broad-based economic growth. Sectors that observe high sophistication or high-technology intensity are likely to act as an engine of growth and promote inter-sectoral and extra-sectoral linkages, rather than isolated enclaves, provided the right macroeconomic conditions and structural factors are in place (Anand et al., 2012; Hausmann et al., 2007). However, these linkages are complex, particularly in low-income countries, where challenges such as a low-skilled labor force, poor macroeconomic management, and institutional constraints persist (Santos-Paulino, 2017).
Some studies suggest that there are higher positive externalities associated with the manufacturing sector when compared with other sectors (e.g., Greenaway et al., 1999; Levin and Raut, 1997). For instance, Fosu (1990) provides evidence of the positive effects of manufacturing exports on growth for developing countries as compared to primary sector exports, but export industries in low-income countries tend to be small in scale and relatively unsophisticated, and they often specialize in products that cannot be produced easily or competitively in the developed world (Nicita and Rollo, 2015), hence the importance of diversifying and upgrading their economic structures and exports baskets.
Hausmann et al. (2007) show that diversification into new production and export activities, as well as improving the quality (and sophistication) of export baskets, determine economic growth across countries. For Africa, Osakwe (2007) finds that aid, the quality of infrastructure, resource endowments, and in some cases institutional factors determine diversification in the region. Contrary to existing evidence, that study does not find a significant impact of geography on diversification. The paper also highlights the role of regional integration and cooperation particularly for infrastructure development, which in turn could be conducive to diversification. Elhiraika and Mbate (2014) empirically explore the long-run determinants of export diversification for a sample of 53 African countries for 1995–2011. System generalized method of moments (GMM) panel data estimates provide evidence supporting the importance of per capita income, infrastructure, public investment, human capital, and the institutional framework as significant drivers of export diversification and transformation.
Finally, Fonchamnyo and Akame (2017) capture the impact of trade openness — not trade policy — on exports diversification in SSA countries. The paper finds that in SSA countries, exports diversification is determined by trade openness, value added in agriculture and manufacturing, and FDI. Also, foreign aid, official exchange rates, and gross domestic investment promoted export diversification in selected economies.
3. Trade and diversification trends in developing countries: an overview
The link between diversification and trade is not evident. There is significant heterogeneity across developing countries in terms of trade and exports specialization patterns. Despite significant openness to trade and ongoing liberalization efforts, a number of developing countries, notably African countries and LDCs, have not succeeded in diversifying production and exports, and in transforming their economies (UNCTAD, 2006). This contrasts with the situation of emerging economies in Asia and Latin America where higher trade has been associated with higher export diversification. Apart from the emerging economies, the export structures of most developing countries have remained largely unchanged, and highly concentrated on primary commodities. For example, Fig. 1a shows that the exports of SSA countries consist mostly of fuels, ores, and metals. In addition to concentration, there are concerns about the increasing deindustrialization trend in some developing countries — where the share of manufacturing value added in GDP is declining — and the negative impact on the potential for structural transformation (see Soderbom, 2017). In contrast to their export patterns, developing countries tend to import larger shares of manufacturing goods, which have more potential to contribute to enhancing productivity, and serve as means of technology and knowledge transfer (Fig. 1b).3
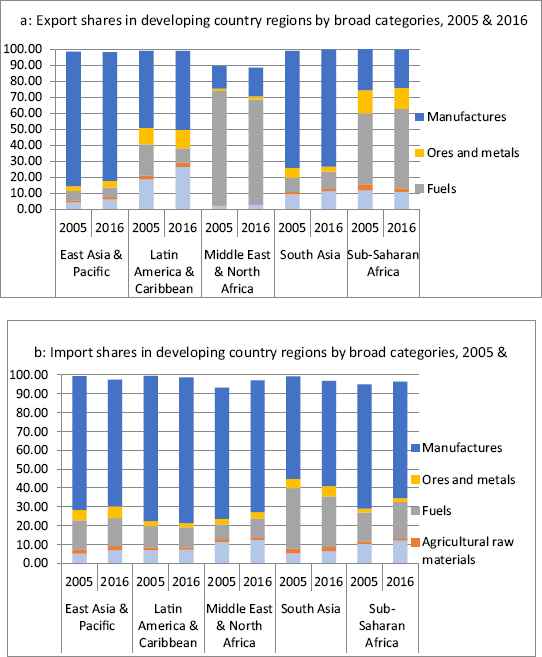
Export and import shares in developing country regions by broad categories, 2005 & 2016. Source: Authors’ elaboration based on UNCTAD Comtrade data (2017).
In this study, we cover a large group of developing economies, comprising a total of 144 countries. The sample displays significant differences in levels of development during the period 1970–2015, as well as important structural variances in terms of trade and production. The differences in the mean values of trade specialization, growth, and other key economic variables, are noticeable in the descriptive statistics presented in Tables A2 and A3 in the Appendix A.
The Theil export diversification index represents the sum of measures of diversity across sectors (i.e., the vertical diversity or extensive margin, implying new exported products or new export destinations) and diversity within sectors (horizontal diversity or intensive margin, meaning a larger volume of exports of old products). In our sample, the exports diversification index ranges between 1.5 and 6.4 across developing countries, with a median value of 3.96. In SSA countries, the range of the export diversification index, on average, is similar to that of other developing countries, although it has a higher mean of 4.33 compared with that of other developing countries of 3.79,4 and a higher lower bound (1.78 versus 1.53), suggesting a lower level of diversification in SSA countries. There are also discernible differences in the mean values of other specialization indicators such as manufacturing exports shares and total trade as a share of GDP as seen in Fig. 1 and Tables A2 and A3.
The data show a significant increase in trade liberalization over the sample period. It is worth noting that an important driver of trade liberalization has been the significant reduction of tariff rates, particularly in LDCs, driven by autonomous trade reforms as well as by bilateral and multilateral commitments (see Fig. 2). The following sections provide a systematic empirical analysis of the relationship between exports diversification and key trade, trade policy and structural indicators.
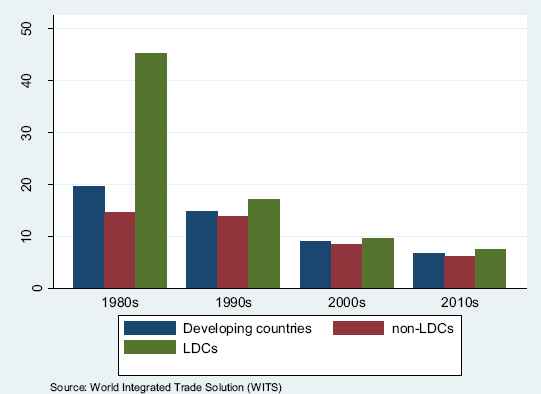
Changes in Tariff Rates across developing countries.
4. Trade and exports diversification: non-parametric analysis
This section uses non-parametric tests to analyze the patterns and the links between trade, trade policy, and the diversification of exports. Parametric tests often assume that the statistic under consideration is approximately normally distributed. This assumption makes sense when the sample size is large. However, for smaller samples it may or may not hold, so it is useful, for robustness, to perform non-parametric (or distribution-free) tests, to complement the regression analysis.
Fig. 3 depicts the distributional patterns of the exports concentration and export specialization indices. The first panel showing the Herfindahl Concentration Index indicates that many developing countries observe high concentrations of exports, particularly those at the bottom of the per capita income bundle. The second panel shows the Theil index of exports diversification, which displays a pattern closer to a normal distribution. Therefore, they provide some justification for using the Theil index, rather than the Herfindahl index, at least for statistical purposes,5 in the remaining empirical part of the paper.
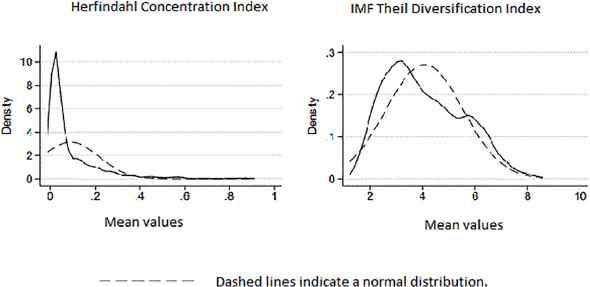
Distribution of concentration and diversification measures 1995–2010. Notes: Fig. 3 portrays the density estimates from the pooled data of the Herfindahl Concentration Index and the IMF Theil diversification index. Dashed lines indicate predicted values of a normal distribution, and straight lines actual values. Estimated using data from UNCTAD Comtrade (HHI) and the Theil index (IMF database).
To better tease out the connection between trade and diversification using non-parametric tests, developing countries in the sample are classified as “more open to trade” and “less open to trade” depending on their trade to GDP ratio compared to the sample mean.6 Then, we compute the median export diversification indices for both groups and ask whether there are any significant differences in export diversification between the groups. Over the period 1995–2010, the median trade openness ratio for the countries more open to trade is 80% and for those less open to trade it is 29%. Regarding exports diversification, the median Theil index for the countries more open to trade is 3.8 while for those countries less open to trade the index is about 4.0. This suggests that countries more open to trade are marginally more diversified than those less open to trade.
In the case of SSA countries, the data show that the median trade openness ratio for the countries more open to trade is 102.7%, and for those less open to trade, it is almost one-half, that is, 50%. Regarding exports diversification, the median Theil index for SSA countries classified as more open to trade is 4.5 while for those countries less open to trade it is lower at 4.3, suggesting that in SSA countries that are more open to trade have less diversified exports.
We conducted a robustness check using other diversification indicators, as well as the Kruskal– Wallis non-parametric test to assess if there are statistically significant differences between the medians of the two groups. That is, we test if countries that are more open to trade possess higher diversification of exports.7 Tables 1 and 2 present the results of the tests for the various indicators of export diversification for all developing countries and for SSA countries, respectively. The results in Table 1 indicate statistically significant differences, for both measures, in exports diversification patterns between the two groups for developing countries generally. However, for SSA countries (Table 2), statistical differences according to the level of openness can be observed only in the case of Theil index. Furthermore, since the Theil index is our most preferred measure, we conclude that while more open developing countries, generally, enjoy greater diversification than their less open counterparts, it is the reverse for SSA countries as a sub-group.
| Variable | Indicator | Kruskal–Wallis tests. (Chi_2) |
|---|---|---|
| Herfindahl concentration index | 98.58 (0.001) | |
| Manufacturing exports (% of total exports) | 88.86 (0.001) | |
| Export diversification | IMF Theil index | 99.17 (0.002) |
Notes:
- -
p_values are presented in parentheses.
- -
The Kruskal–Wallis tests for significant differences on a continuous variable among different groups. It is an H test where the test statistic is computed as follows:
Non-parametric tests for differences in diversification according to differences in degree of openness, complete sample.
| Variable | Indicator | Kruskal–Wallis tests. (Chi_2) |
|---|---|---|
| Herfindahl concentration index | 1.747 (0.186) | |
| Manufacturing exports (% of total exports) | 0.640 (0.430) | |
| Export diversification | IMF Theil index | 11.77 (0.001) |
Notes:
- -
p_values are presented in parentheses.
- -
The Kruskal-Wallis tests for significant differences on a continuous variable among different groups. It is an H test where the test statistic is computed as follows:
Non-parametric tests for differences in diversification in SSA countries according to the degree of openness.
However, the non-parametric tests provide only qualitative evidence. Thus, we undertake panel data econometric analysis in the subsequent section to further examine the relationship.
5. Cross-country and panel data estimations
5.1. Empirical specification
Trade has the potential to contribute to the diversification of production and exports, but the realization of this potential benefit will vary from country to country, reflecting differences in initial conditions and country-specific policies that affect the performance of production and trade sectors. In this context, this section examines the link between trade, trade policy, and export diversification across developing and SSA countries, after controlling for a set of trade-related factors and other structural and policy indicators such as human capital, macroeconomic conditions, investment, and infrastructure. Although our full sample covers the period 1970–2015, the empirical estimates in this section rely on data for the period 1970–2010 (encompassing 144 countries) because data for the Theil export diversification index is available only until 2010. The starting point for the empirical analysis is the following estimating equation (see for example Hausmann et al., 2007; Osakwe, 2007; Agosin et al., 2012):
5.2. Results
Before undertaking formal econometric analysis for all countries across the sample period, we present correlation coefficients between exports diversification and other explanatory variables considered in the analysis. Results are presented in Table 3. The correlations and signs of the coefficients are in the expected directions, in general. With regard to trade and diversification, the results indicate that higher trade liberalization (lower tariffs) appears to be associated with higher export diversification; the findings with trade intensity seem to indicate that trade is associated with lower concentration, although the results seem rather weak.
| Variables | Theil index | Total Trade | Tariffs | GDP per capita | Human capital | Remoteness | Infrastructure | Institutions |
|---|---|---|---|---|---|---|---|---|
| Theil index | 1.000 | |||||||
| Total Trade | 0.004 (0.804) | 1.000 | ||||||
| Tariffs | 0.120 (0.000) | −0.229 (0.000) | 1.000 | |||||
| GDP per capita | 0.041 (0.006) | 0.351 (0.000) | −0.227 (0.000) | 1.000 | ||||
| Human capital | −0.252 (0.000) | 0.158 (0.000) | −0.089 (0.024) | 0.331 (0.000) | 1.000 | |||
| Remoteness | 0.055 (0.002) | 0.030 (0.0076) | 0.087 (0.000) | 0.017 (0.297) | 0.055 (0.082) | 1.000 | ||
| Infrastructure | −0.046 (0.018) | −0.007 (0.679) | 0.057 (0.017) | −0.059 (0.001) | −0.086 (0.012) | 0.050 (0.017) | 1.000 | |
| Institutions | −0.316 (0.000) | −0.001 (0.965) | −0.139 (0.000) | −0.101 (0.000) | 0.101 (0.001) | 0.060 (0.001) | 0.163 (0.000) | 1.000 |
Notes: A negative value between the Theil index and a given variable indicates a positive correlation between export diversification and that variable.
Detailed data definition is provided in the Appendix A.
Correlation matrix.
To further validate the correlation estimates, we begin by estimating a cross-country regression specification by Ordinary Least Squares (OLS), which provide relatively long-term results. The findings are reported in Tables 4 and 5. In terms of the fitness of models, using the Theil export diversification index as an indicator of diversification provides more statistically sound results than other proxies of concentration or diversification. The estimations also use total trade (as share of GDP) and tariffs as indicators of trade intensity and trade policy, as well as other ancillary variables.8
| (1) | (2) | (3) | (4) | |
|---|---|---|---|---|
| With trade | With tariff | With trade | With tariff | |
| GDP per capita | 0.00001** (2.19) | 0.00001** (2.37) | − 0.00002 (− 1.58) | − 0.00001 (− 0.71) |
| Human capital | − 0.0135*** (− 6.74) | − 0.0134*** (− 5.90) | − 0.0112*** (− 5.14) | − 0.0118*** (− 4.81) |
| Remoteness | 0.00001 (1.04) | 0.00001 (0.13) | 0.00001 (0.64) | − 0.00003 (− 0.33) |
| Infrastructure | −0.00115 (−0.59) | −0.00110 (−0.49) | −0.0009 (−0.47) | −0.00113 (−0.50) |
| Institutions | −0.0412*** (−4.47) | −0.0431*** (−3.70) | −0.0384*** (−3.95) | −0.0401*** (−3.20) |
| Trade/Tariff | −0.00034 (−0.30) | 0.0114*** (3.25) | 0.00007 (0.07) | 0.0107*** (3.02) |
| GDP per capita (Square) | 6.06e-10** (2.41) | 4.11e-10 (1.48) | ||
| Constant | 4.285*** (19.91) | 4.167*** (19.67) | 4.267*** (19.90) | 4.190*** (19.81) |
| Observations | 314 | 266 | 314 | 266 |
| F-test | 19.26 | 19.85 | 34.95 | 32.99 |
| R-squared | 0.22 | 0.25 | 0.24 | 0.25 |
Note: ***Significant at 1% level, **5% level, and *10% level, respectively; t values in parentheses (with robust standard errors); lower values of the Theil diversification index imply higher diversification, and negative coefficients indicate positive effects on diversification. Regressions reported exclude outliers, which have been identified in terms of trade concentration/specialization indicators relative to GDP; countries excluded from the regressions are Hong Kong, Singapore, Equatorial Guinea, Guyana, Maldives, and Lesotho.
OLS results.
The dependent variable is Exports Diversification (Theil Index): 1970–2010.
| (1) | (2) | (3) | (4) | |
|---|---|---|---|---|
| With trade | With tariff | With trade | With tariff | |
| GDP per capita | 0.00001** (2.19) | 0.00001** (2.37) | −0.00002 (−1.58) | −0.00001 (−0.71) |
| Human capital | −0.0135*** (−6.74) | −0.0134*** (−5.90) | −0.0112*** (−5.14) | −0.0118*** (−4.81) |
| Remoteness | 0.00001 (1.04) | 0.00001 (0.13) | 0.00001 (0.64) | −0.00003 (−0.33) |
| Infrastructure | −0.00115 (−0.59) | −0.00110 (−0.49) | −0.0009 (−0.47) | −0.00113 (−0.50) |
| Institutions | −0.0412*** (−4.47) | −0.0431*** (−3.70) | −0.0384*** (−3.95) | −0.0401*** (−3.20) |
| Trade/Tariff | −0.00034 (−0.30) | 0.0114*** (3.25) | 0.00007 (0.07) | 0.0107*** (3.02) |
| GDP per capita (Square) | 6.06e-10** (2.41) | 4.11e-10 (1.48) | ||
| Constant | 4.285*** (19.91) | 4.167*** (19.67) | 4.267*** (19.90) | 4.190*** (19.81) |
| Observations | 314 | 266 | 314 | 266 |
| F-test | 19.26 | 19.85 | 34.95 | 32.99 |
| R-squared | 0.22 | 0.25 | 0.24 | 0.25 |
Notes: ***Significant at 1% level, **5% level, and *10% level respectively; t values in parenthesis (with robust standard errors); lower values of the Theil index diversification imply higher diversification, and negative coefficients indicate higher diversification. Regressions reported exclude outliers, which have been identified in terms of trade concentration/specialization indicators relative to GDP; countries excluded from the regressions are Hong Kong, Singapore, Equatorial Guinea, Guyana, Maldives, and Lesotho.
OLS results including regional dummy for SSA countries.
The dependent variable is Exports Diversification (Theil Index): 1970–2010.
The findings from the cross-country regressions in Table 4 show that higher GDP per capita is associated with exports specialization in the long run (Columns 1 and 2). The estimated coefficient for human capital, measured by secondary school enrollment, is negative and statistically significant across specifications, which implies that higher human capital is associated with greater exports diversification. The literature suggests that geography is exogenous to an economy, with the geographical distance to main trade partners as an important variable in the analysis of exports diversification and trade, although the results are not statistically significant. Also, institutions, as measured by Polity2, are positively associated with exports diversification.
On average, the impact of trade intensity on exports diversification is not confirmed. However, the findings show that trade liberalization, measured by lower tariffs, tends to lead to exports diversification. Access to electricity, used as a proxy for infrastructure, is not statistically significant but has the expected sign. We also test for a non-linear impact of GDP on exports diversification in the long run, but the expected inverted-U hypothesis of the relationship between income and exports diversification is supported only when controlling for the impact of trade intensity.9
The evidence established so far has been for the total sample of developing countries. The question arises if the impact of trade on diversification holds for the sub-sample of Sub-Saharan African countries. Thus, further estimations were performed, using a dummy variable for SSA countries, to gauge the extent to which the estimated coefficients differ for this group compared with the other countries in the sample. Table 5 extends the estimations reported in Table 4, also controlling for the impact of trade and trade policy on SSA countries. The findings of the augmented models provide support for those in Table 4 concerning structural factors as well as the indicators of trade and trade policy, confirming that more restrictive trade regimes lead to higher specialization of exports. This result echoes an important strand of the theoretical and empirical literature suggesting that trade liberalization is positively associated with exports diversification (e.g., Cadot et al., 2011; Schott, 2004; Xiang, 2007 for related discussions). A direct impact of trade and tariffs on SSA countries is statistically confirmed. Using tariffs as an indicator of trade liberalization, we find that liberalization leads to exports diversification, and the results are stronger for SSA countries. In the case of trade intensity, the results are not significant, but for SSA countries, it leads to exports concentration; the latter result is consistent with the findings of Agosin et al. (2012) for their more global sample.
To examine the robustness of the long-run results yielded by the cross-country estimates, we account for the endogenous regressors by undertaking dynamic panel estimations using GMM estimators, with robust standard errors. It should be noted that the consistency of the GMM estimator depends on the validity of the assumption that the second-order error term is not serially correlated, and on the validity of the instruments. The diagnostics statistics reported in Table 6 generally support the empirical validity of the estimates. The null hypothesis of no second-order serial correlation is maintained; meanwhile the Sargan test results fail to reject the null hypothesis of over-identifying restrictions, though with rather low p-values.
| (1) | (2) | (3) | (4) | |
|---|---|---|---|---|
| With trade | With tariff | With trade | With tariff | |
| L. Theil (IMF) | 0.949*** (46.00) | 0.953*** (44.22) | 0.951*** (48.55) | 0.956*** (47.01) |
| GDP per capita | 0.000001 (1.33) | 0.000002** (2.15) | 0.000003 (1.07) | 0.000006* (1.79) |
| Human Capital | −0.002* (−1.88) | −0.002** (−2.10) | −0.002** (−2.29) | −0.002** (−2.46) |
| Remoteness | 8.88e-08 (0.04) | 4.23e-06 (0.15) | 4.04e-06 (0.18) | 5.68e-06 (0.22) |
| Infrastructure | 0.0004 (0.89) | 0.0005 (1.02) | 0.0004 (0.96) | 0.0005 (1.14) |
| Institutions | −0.003 (−1.04) | −0.0003 (−0.12) | −0.002 (−0.83) | −0.0002 (−0.08) |
| Trade/Tariff | −0.0002 (−0.99) | 0.001* (1.85) | −0.0004* (−1.75) | 0.001* (1.75) |
| SSA countries*Trade/SSA countries*Tariff | −0.0003 (−1.01) | 0.0004 (0.11) | −0.0003 (−0.82) | −0.0003 (−0.08) |
| GDP per capita (Square) | −3.21e-11 (−0.79) | −6.21e-11 (−1.41) | ||
| Constant | 0.261** (1.97) | 0.177 (1.40) | 0.264** (2.12) | 0.169 (1.49) |
| Observations | 314 | 266 | 314 | 266 |
| Arellano-Bond AR(1) | 0.018 | 0.028 | 0.018 | 0.028 |
| Arellano-Bond AR(2) | 0.792 | 0.794 | 0.781 | 0.784 |
| Sargan (p values) | 0.112 | 0.072 | 0.158 | 0.110 |
Notes: t statistics in parentheses: *p < 0.10, **p < 0.05, ***p < 0.01. Lower values of the Theil index diversification imply higher diversification, and negative coefficients indicate positive effects on diversification. Regressions reported exclude outliers, which have been identified in terms of trade concentration/specialization indicators relative to GDP; countries excluded from the regressions are: Hong Kong, Singapore, Equatorial Guinea, Guyana, Maldives, and Lesotho. The test statistics and standard errors (in parentheses) are asymptotically robust to heteroskedasticity. The Sargan statistic is a test of the over-identifying restrictions, distributed as chi-square under the null of instrument validity.
GMM results including regional dummy for SSA countries.
The dependent variable is Exports Diversification (Theil Index): 1970–2010.
In all the reported results, the positive and significant lagged dependent variable suggests persistence of export diversification. As in the OLS estimates, higher human capital leads to greater exports diversification. This is in line with the findings in the literature (e.g., Hausmann et al., 2007; Agosin et al., 2012) that countries with abundant human capital specialize in differentiated manufactured products. The GDP per capita is positively associated with exports concentration, contrary to the finding of Elhiraika and Mbate (2014) for African countries; however, the non-linear impact of GDP per capita on exports diversification cannot be confirmed. The impact of other structural variables cannot be statistically verified, although the reported signs are in the expected direction. For the focus of the present study, the results show that trade intensity and trade liberalization both lead to exports diversification for all developing countries, and similarly for SSA countries as a group.
6. Conclusion
Over the past few decades, developing countries have increased their dependence on trade and adopted more liberal trade policies. Yet vulnerable countries such as LDCs and SSA countries continue to account for an insignificant percentage of global trade and have highly concentrated export structures. Against this backdrop, this paper examines the role of trade and trade policy in exports diversification in developing countries using both parametric and non-parametric techniques.
The non-parametric analyses indicate that developing countries that are more open to trade, as measured by trade intensity, tend to have more diversified exports structures than those less open to trade. However, for SSA countries, the non-parametric test shows the reverse, that is, the countries that are more open to trade have less diversified exports structures.
The findings from the parametric analysis provide further evidence that trade liberalization, in the form of lower tariffs, contributes to exports diversification in developing countries, and the results for the long term are even stronger for SSA countries. With regard to trade intensity, the parametric estimations also confirm the results that trade is associated with diversification in developing countries and in SSA countries in the short term; however, for SSA countries, it actually leads to concentration in the long term, consistent with the non-parametric results. Finally, the empirical analyses provide evidence that institutions, human capital, and GDP per capita also influence the diversification prospects.
Acknowledgments
The authors are grateful to the Editor, Prof. Augustin Fosu, and anonymous referees for insightful comments and suggestions. Participants at the expert meeting on “Export Diversification and Employment” at the 5th Africa Think Tank Summit in Accra also provided useful comments on an earlier draft of the paper. The views expressed herein do not represent those of UNCTAD or its member states.
Appendix A
| Variable | Indicator | Source |
|---|---|---|
| Trade and trade policy | Trade (% of GDP) | World Development Indicators (WID) http://databank.worldbank.org/data/reports.aspx?source=World-Development-Indicators |
| Tariff (weighted) | World Integrated Trade Solutions (WITS) https://wits.worldbank.org/ | |
| Export diversification measures | Manufacturing exports (% of total exports) | Authors’ own calculation based on data from WID |
| IMF Theil diversification index. A lower value of the index indicates greater diversification. | IMF https://www.imf.org/external/np/res/dfidimf/diversification.htm | |
| Herfindahl export concentration index. The index takes values between 0 and 1, and a value closer to 1 indicates greater concentration. | UNCTAD Statistics http://unctadstat.unctad.org/wds/TableViewer/tableView.aspx?ReportId=120 | |
| Human Capital | Secondary school enrolment (net, %) | World Development Indicators (See above) |
| Remoteness | Distance major trade partner | COMTRADE-WITS (for bilateral trade partners), and CEPII database (for distance). https://wits.worldbank.org/ http://www.cepii.fr/CEPII/en/bdd_modele/bdd_modele.asp |
| Infrastructure | Access to electricity (% of population) | World Bank World Development Indicators (see above) |
| Institutions | Polity2 index. The index takes values between −10 and + 10. Higher values indicate higher levels of democracy. | Polity IV database http://www.edac.eu/indicators_desc.cfm?v_id=63 |
Variables definition and data sources.
| Variables | Obs. | Mean | Median | Standard deviation | Min | Max |
|---|---|---|---|---|---|---|
| Structural determinants of diversification | ||||||
| Manufacturing exports (% of Total exports) | 3530 | 14.46 | 6.87 | 18.00 | 0 | 110.49 |
| Manufacturing (% of GDP) | 4625 | 13.21 | 12.15 | 7.41 | 0.15 | 45.66 |
| IMF Theil index | 5130 | 3.96 | 3.94 | 1.06 | 1.53 | 6.44 |
| School enrolment, secondary (% net) | 1531 | 52.25 | 55.33 | 26.55 | 0.09 | 99.42 |
| GDP per capita | 5484 | 5291.67 | 2200.58 | 9734.53 | 115.43 | 115,003.00 |
| Remoteness | 3986 | 5676.75 | 4341.88 | 4265.55 | 60.77 | 19,079.88 |
| Institutions | 4880 | − 0.71 | − 2.00 | 6.77 | − 10 | 10 |
| Access to electricity | 3443 | 78.23 | 96.16 | 30.14 | 0.01 | 100 |
| Trade and economic reforms | ||||||
| Tariff rate | 2450 | 9.89 | 8.90 | 7.58 | 0.00 | 88.43 |
| Total trade (% of GDP) | 5503 | 81.27 | 71.36 | 53.59 | 0.02 | 531.74 |
| Exports (% of GDP) | 5503 | 36.35 | 29.81 | 27.25 | 0.01 | 230.27 |
| Imports (% of GDP) | 5503 | 44.92 | 38.06 | 31.17 | 0 | 424.82 |
Summary statistics, complete sample.
| N | SSA countries | N | Other developing countries (excl SSA countries) | |||||||
|---|---|---|---|---|---|---|---|---|---|---|
| Mean (Std. dev.) | Median | Min | Max | Mean (Std. dev.) | Median | Min | Max | |||
| Structural determinants of diversification | ||||||||||
| Manufacturing exports (% of Total exports) | 941 | 7.18 (8.99) | 3.40 | 0 | 48.95 | 2589 | 17.106 (19.65) | 8.99 | 0 | 110.49 |
| Manufacturing(% of GDP) | 1568 | 11.20 (6.71) | 9.87 | 0.24 | 45.67 | 3057 | 14.28 (7.548) | 13.94 | 0.16 | 40.45 |
| Theil Index | 1594 | 4.33 (0.95) | 4.37 | 1.78 | 6.34 | 3536 | 3.79 (1.07) | 3.75 | 1.53 | 6.44 |
| School enrolment, secondary (% net) | 424 | 26.114 (20.19) | 20.39 | 0.099 | 89.64 | 1107 | 62.26 (21.39) | 66.47 | 3.58 | 99.43 |
| GDP per capita | 1903 | 1823.22 (2889.71) | 793.25 | 115.44 | 25,732.70 | 3581 | 7134.86 (11,441.29) | 3449.02 | 161.89 | 115,003.00 |
| Remoteness | 1068 | 6087.32 (3452.45) | 5541.32 | 105.18 | 15,270.32 | 2918 | 5526.48 (4518.01) | 3569.32 | 60.77 | 19,079.88 |
| Institutions | 1999 | − 1.57 (6.05) | − 4 | − 10 | 10 | 2881 | −0.116 (7.176) | − 1 | − 10 | 10 |
| Access to electricity (% of population) | 1113 | 81.13 (27.25) | 94.86 | 0.01 | 100 | 2330 | 76.84 (31.34) | 96.63 | 0.02 | 100 |
| Economic reforms | ||||||||||
| Tariff rate | 776 | 11.09 (5.27) | 10.63 | 0.50 | 39.16 | 1674 | 9.35 (8.24) | 7.79 | 0 | 88.43 |
| Total trade (% of GDP) | 1854 | 75.99 (47.50) | 63.39 | 6.32 | 531.74 | 3649 | 83.94 (56.24) | 76.51 | 0.02 | 455.28 |
| Exports (% of GDP) | 1854 | 30.79 (20.08) | 24.95 | 2.52 | 124.39 | 3649 | 39.16 (29.86) | 32.64 | 0.01 | 230.27 |
| Imports | 1854 | 45.20 (33.87) | 36.47 | 2.98 | 424.82 | 3649 | 44.78 (29.71) | 39.32 | 0 | 227.35 |
Summary statistics for SSA and other developing countries (excluding SSA countries).
| Afghanistan * | Dominica | Lebanon | St. Lucia |
| Algeria | Dominican Republic | Lesotho * ǂ | St. Vincent and the Grenadines |
| Angola * ǂ | Ecuador | Liberia * ǂ | Saudi Arabia |
| Antigua and Barbuda | Egypt, Arab Rep. | Libya | Samoa |
| Argentina | El Salvador | Macao SAR, China | Senegal * ǂ |
| Armenia | Equatorial Guinea * ǂ | Madagascar * ǂ | Seychelles ǂ |
| Aruba | Eritrea * ǂ | Macedonia | Sierra Leone * ǂ |
| Azerbaijan | Eswatini ǂ | Malawi * ǂ | Singapore |
| Bahamas | Ethiopia * ǂ | Malaysia | Solomon Islands * |
| Bahrain | Faroe Islands | Maldives | Somalia * ǂ |
| Bangladesh * | Fiji | Mali * ǂ | South Africa ǂ |
| Barbados | French Polynesia | Mauritania * ǂ | South Sudan * ǂ |
| Belize | Gabon ǂ | Mauritius ǂ | Sri Lanka |
| Benin * ǂ | Gambia ǂ | Mexico | Sudan * |
| Bhutan * | Ghana ǂ | Mongolia | Suriname |
| Bolivia | Grenada | Moldova | Syria |
| Botswana ǂ | Guatemala | Morocco | Tajikistan |
| Brazil | Guinea * ǂ | Mozambique * ǂ | Tanzania * ǂ |
| Brunei Darussalam | Guinea-Bissau ǂ | Myanmar * | Thailand |
| Burkina Faso * ǂ | Guyana | Namibia ǂ | Timor-Leste * |
| Burundi * ǂ | Haiti * | Nepal * | Togo * ǂ |
| Cabo Verde ǂ | Honduras | New Caledonia | Tonga |
| Cambodia * | Hong Kong | Nicaragua | Trinidad and Tobago |
| Cameroon ǂ | India | Niger * ǂ | Tunisia |
| Central African Republic * ǂ | Indonesia | Nigeria ǂ | Turkey |
| Chad * ǂ | Iran | Oman | Turkmenistan |
| Chile | Iraq | Pakistan | Uganda * ǂ |
| China | Jamaica | Palau | United Arab Emirates |
| Colombia | Jordan | Panama | Uruguay |
| Comoros * ǂ | Kazakhstan | Papua New Guinea | Uzbekistan |
| Congo, Rep. ǂ | Kenya ǂ | Paraguay | Vanuatu * |
| Congo, Dem. Rep. * ǂ | Kiribati * | Peru | Venezuela |
| Costa Rica | Korea, Rep. | Philippines | Vietnam |
| Cote d’Ivoire ǂ | Kuwait | Qatar | Yemen |
| Cuba | Kyrgyzstan | Rwanda * ǂ | Zambia * ǂ |
| Djibouti * ǂ | Lao | St. Kitts and Nevis | Zimbabwe ǂ |
Note: * and ǂ denote Least Developed Countries (LDC) and Sub-Saharan African (SSA) countries, respectively.
Sample of countries (n = 144).
Footnotes
Peer review under responsibility of Afreximbank.
In the LDCs for example, total trade as a percentage of GDP increased from an average of about 61% in the period 1970–1974 to 83% in the period 2006–2010. However, the diversification of their exports (measured by the Theil index) changed marginally from 4.6 to 4.4 over the same period.
The Dutch disease refers to the negative impact the expanding primary-commodity sector may have on other tradable sectors. It also might lead to deindustrialization as industries other than commodities or resources exploitation transfer to cheaper locations due to higher costs from inflation and currency appreciation.
We also used manufactures value added share to GDP as an alternative proxy for diversification, but the results were not statistically significant.
Note that a higher value of the index represents a lower level of export diversification.
This notion holds particularly for small samples where the Central Limit Theorem may not be applicable.
The cut-off point used for determining which countries are more or less open to trade is the sample mean of 81.3%. In other words, countries with trade ratios below 81.3% were classified as less open to trade and those with trade ratios above this threshold as more open to trade. For SSA countries the sample mean used for the threshold is 75.9%.
The null hypothesis is that the medians of both groups are equal for each indicator (i.e., that exports diversification is the same across groups), and the alternative hypothesis is that the medians are not equal. It should be borne in mind that this method provides one data point per country. Thus, the small data size is not appropriate for distributional assumptions.
The reported results in Tables 5 and 6 exclude outliers in the sample and appear to be empirically more robust than with the inclusion of such countries.
Other explanatory variables were included in the analysis to gauge the impact of macroeconomic conditions, including various measures of exchange rates and volatility, investment, FDI, capital account openness, measured by the Chinn-Ito de Jure controls, but the results are also mixed and statistically inconclusive.
References
Cite this article
TY  - JOUR
AU  - Patrick N. Osakwe
AU  - Amelia U. Santos-Paulino
AU  - Berna Dogan
PY  - 2018
DA  - 2018/11/27
TI  - Trade dependence, liberalization, and exports diversification in developing countries☆
JO  - Journal of African Trade
SP  - 19
EP  - 34
VL  - 5
IS  - 1-2
SN  - 2214-8523
UR  - https://doi.org/10.1016/j.joat.2018.09.001
DO  - 10.1016/j.joat.2018.09.001
ID  - Osakwe2018
ER  -