
Trade facilitation and social welfare in Africa☆
- DOI
- 10.1016/j.joat.2018.08.001How to use a DOI?
- Keywords
- F13; F14; I30; C33
- Abstract
Improving social welfare in the developing world remains a top priority on the global development agenda, as policymakers and international development partners worldwide strive to meet the Sustainable Development Goals by 2030. Using data on 40 African countries over the period 2010–2015, this paper investigates the extent to which trade facilitation contributes to improving social welfare in Africa. To do so, we construct three indices of trade facilitation capturing infrastructure, institutions, and market efficiency from several primary indicators. With regard to social welfare, we use education (net primary school enrollment rate), child health (under-5 mortality rate), population health (life expectancy), and human development (human development index). The system-GMM estimation technique is employed in order to address the problem of endogeneity. The main finding is that better trade facilitation results in improved social welfare outcomes. Our findings suggest that effective trade facilitation reforms, targeted particularly at improving infrastructure, institutions, and market efficiency, will likely be associated with improvements of social welfare in Africa.
- Copyright
- © 2018 Afreximbank. Production and hosting by Elsevier B.V. All rights reserved.
- Open Access
- This is an open access article under the CC BY-NC license (http://creativecommons.org/licences/by-nc/4.0/).
1. Introduction
The benefits of international trade to economies cannot be overemphasized. Trade has been upheld as one of the key drivers of economic growth and development of countries because of its effect of integrating economies across the globe, generating foreign exchange, increasing technological transfer, generating efficiency among firms due to competition, increasing employment, and alleviating poverty (see Krueger, 1980; Frankel and Romer, 1999; Dollar, 2002; Dollar and Kraay, 2004; Herzer, 2013; Viet, 2015; Sakyi et al., 2015; Agrawal, 2015; Were, 2015; Le Goff and Singh, 2014; Zahonogo, 2017) among several other benefits. Regardless, trade statistics in Africa for the immediate past decades have been disappointing when compared with other regions of the world. For instance, statistics for the average of the following periods, 1990–1999, 2000–2009, and 2010–2016, show that Africa has woefully lagged behind America, Asia, and Europe, and has only marginally outperformed Oceania (which is made up of just a handful of countries).1 Portugal-Perez and Wilson (2009) and Sakyi et al. (2017) attribute this outcome to the poor trade facilitation mechanism that has resulted in high trade cost.
The success and effectiveness of trade are highly dependent on how it is facilitated. It is therefore not surprising that, in recent times, spearheaded by the World Bank, World Trade Organization (WTO), and United Nations Conference on Trade and Development (UNCTAD), much attention has been devoted to issues related to effective trade facilitation reforms. UNCTAD and WTO define trade facilitation as the simplification and harmonization of international trade procedures, aimed at reducing transaction costs and arrangements associated with trade. It includes activities involved in collecting, presenting, communicating, and processing data required for the movement of goods and services across borders. According to Moïsé et al. (2011), wider definitions of trade facilitation may include issues of customs, transport and transit, banking and insurance, business practices, and telecommunications among others. Recently, the meaning of trade facilitation has been widened to include transparency, professionalism of customs authorities, synchronization of various standards, and conformity to international or regional regulations (Buyonge and Kireeva, 2008). Though reduction/elimination of tariffs on some or all goods for some countries has contributed substantially to the reduction of trade cost, the essence of trade facilitation surpasses the elimination of tariffs alone (Portugal-Perez and Wilson, 2009).2 In a broader sense, trade facilitation relates to improvements in transportation (of goods and services), energy, judiciary (business), customs regulations, telecommunication, banking and insurance, and trade transparency (Narayanan et al., 2016; Portugal-Perez and Wilson, 2009; Rippel, 2011).
The crux of trade facilitation is that it ensures trade at relatively lower trade (transaction) costs through the simplification of trade regulations and procedures. The WTO for example reports that the enforcement of a trade facilitation agreement3 is expected to reduce global trade costs by more than 14, 15, and 13% for low-income, lower middle-income, and upper middle-income countries respectively. Hufbauer and Schott (2013) also recount the benefits of trade facilitation and estimate that it could increase export gains, export related jobs, and GDP by $1043 billion, 20.6 million, and $960 billion respectively globally. The World Bank (2011) in its trade strategy has emphasized that tackling trade costs is crucial as they have direct bearing on reducing poverty and hence improving social welfare. Along this line, the World Bank is working to reduce costs associated with transporting goods, in relation to time, money, or reliability. The implication of this outcome is that high trade costs emanating from poor trade facilitation can have adverse effect on the economy and deteriorate the wellbeing of individuals in a number of ways. For instance, a country with comparatively high trade costs suffers from lower consumer welfare through higher prices of imported goods (Portugal-Perez and Wilson, 2009). With this, the World Bank (2011) stresses that trade facilitation improves the wellbeing of individuals, particularly the poor, as it lowers trade costs and hence directly reduces the final prices people pay for goods that they consume. Besides, high trade cost in a country renders its domestic firms less competitive as they tend to import inputs at relatively higher costs, and this can have negative repercussions on their production and employment (Rippel, 2011), which are crucial for social welfare.
In essence, it can be argued that trade facilitation could lead to improvements in social welfare outcomes (Narayanan et al., 2016) as it creates opportunities for trade; trade facilitation increases competitiveness of firms, and this helps improve trade (mainly export performance). More trade has the effect of generating jobs, and this has positive social welfare improvement outcomes (Winters et al., 2004; Rippel, 2011; Narayanan et al., 2016). Another channel that we could consider trade facilitation affecting social welfare of individuals is through the inflows of foreign direct investment. Since trade facilitation may be associated with improvements in infrastructure, institutions, and market efficiency among others, this makes a country with effective trade facilitation more attractive for foreign direct investment with its associated positive employment and social welfare effects.
Though trade facilitation is largely trumpeted in the literature to boost trade, capital inflows, and economic improvement — as a result of lower transaction costs — its implementation and effectiveness can also pose some challenges particularly for developing countries. In essence the effects of trade facilitation on the economy and social welfare of people can be ambiguous; i) trade facilitation can improve a country’s degree of openness, and in a less competitive country, this can increase imports more than exports. There is also the potential for dumping. This can have the negative effect of chasing some domestic firms out of business by way of exporting employment to other countries (Moosa, 2002; Adams et al., 2016); ii) excessive imports and inflows of foreign direct investment emanating from effective trade facilitation can pose problems of national security and excessive foreign control (Moosa, 2002; Duval, 2006; Kurtishi-Kastrati, 2013).4 Moreover, some developing countries are of the view that the implementation of trade facilitation measures is associated with huge infrastructural and human resource cost. Others fear that not all trade facilitation measures will serve their needs and priorities. They are therefore caught in a dilemma as to the extent to which they should commit their scarce financial resources to trade facilitation programs (Perera, 2016).
An extensive body of literature has analyzed, with resounding positive results, the effects of trade facilitation on trade flows and/or economic growth/gains; among the recent ones, Wilson et al. (2005), Iwanow and Kirkpatrick (2007), Njinkeu et al. (2008), Portugal-Perez and Wilson (2012), Hoekman and Shepherd (2015), Narayanan et al. (2016),and Sakyi et al. (2017) stand out. However, not much attention has been given to the impact of trade facilitation on social welfare outcomes. Through the lens of the United Nations’ Sustainable Development Goals (SDGs), which encompass economic, social, environment, and political aspects of development, this study proposes that beyond the widely studied but narrow set of economic indicators, trade facilitation can affect broader dimensions of social welfare, including education, health and human development outcomes. This is crucial because as often argued, trade facilitation indicators “…. make economic activities more transparent and accountable, promote good governance, generate better quality employment, strengthen information technology capabilities, and generally help modernize societies by bringing benefits related to administrative efficiency” (UNCTAD, 2016 pp. 6). These benefits coupled with the associated capacity building effect of trade facilitation go a long way in improving and making life better for people, hence promoting human development. Therefore, improving trade facilitation in the long run is a useful step towards the promotion of social welfare and human development.
We are only aware of two studies, Viet (2015) and Cabote (2014), which examine the impact of trade facilitation on social welfare outcomes for developing countries. Both studies, however, consider social welfare by focusing only on monetary-based measures, and unlike Viet (2015), Cabote (2014) did not address potential concerns of endogeneity. In this regard, our paper differs significantly from existing ones on trade facilitation for at least two reasons. First, we focus only on African countries. To the best of our knowledge, this paper presents the first analysis of trade facilitation–social welfare nexus for African countries. Our focus on Africa is primarily informed by the facts that i) it is home to a majority of the world’s poor; and ii) despite the enormous benefits that may be derived from effective trade facilitation, Africa’s level of trade facilitation remains inadequate relative to other regions of the world (Sakyi et al., 2017).5 It is therefore imperative to examine the extent to which trade facilitation affects social welfare in Africa; improvement of which has been a top priority on the 2030 Sustainable Development Agenda (United Nations, 2015). Second, in studies as this, how trade facilitation and social welfare outcomes are measured is very important as the use of broader measures will better inform policy. We measure both trade facilitation and social welfare in a broader sense, by considering a number of important indices. We construct three indices of trade facilitation, which capture infrastructure, institutions, and market efficiency from several primary indicators. In addition, we use broader indicators of social welfare, namely, education (net primary school enrollment rate), child health (under-5 mortality rate), population health (life expectancy), and human development (human development index). From estimation point of view, the system Generalized Method of Moments (GMM) panel data estimation technique is employed, in order to address potential endogeneity concerns.
The rest of the paper is organized as follows: the next section provides the theoretical framework, model, and empirical strategy. Section 3 presents the data and measurement issues. Section 4 presents the results and discussion. The last section concludes the paper with some policy suggestions.
2. Theoretical framework, model, and estimation strategy
2.1. Theoretical framework and empirical model
The theoretical premise for studying the effects of trade facilitation on social welfare outcomes can be gleaned from the Heckscher–Ohlin (H–O) model. As engagement in trade leads developing countries to concentrate on the production and export of commodities that make intensive use of their relatively abundant factors (apparently, unskilled workers, agricultural, and mineral resources), the H–Omodel predicts that freer trade would be beneficial to unskilled workers, smallholder farmers, and land owners. Given that owners of these resources form the vast majority of the poor and vulnerable in developing countries, of which Africa is not an exception, trade if effectively facilitated will serve as one of the instrumental pathways to improve the social welfare and plight of these individuals.
As earlier argued, the prevalence of high trade costs in Africa arising mainly from poor transportation infrastructure, ill-developed institutions, excessive documentation, and burdensome custom procedures, have been shown to constrain trade more than tariffs do (Limao and Venables, 2001; Anderson and Marcouiller, 2002; Portugal-Perez and Wilson, 2009). This may constrict the potential contributions of trade to employment and improvement of social welfare. Hence, we investigate the social welfare effects of trade facilitation in Africa. Aside the fact that trade facilitation enables countries to have access to domestic and external markets for tradable goods, the availability of good quality transport infrastructure, for instance, also improves access to education and health facilities (Jouanjean et al., 2015). This in turn promotes (improves) both school enrolment and attendance, and overall population health, which are crucial for human capital formation and improvement of social welfare.
Based on these theoretical considerations, we specify our empirical model, which relates social welfare outcomes to trade facilitation and other explanatory variables as follows:
2.2. Estimation strategy
The effect of trade facilitation on social welfare is captured by β, our coefficients of interest. Because of potential concerns for endogeneity, obtaining unbiased estimates of β is usually challenging. Such concerns may arise from the potential feedback effects from the social welfare measures to trade facilitation. For instance, countries with better welfare outcomes such as high levels of education, life expectancy are often more productive, wealthier, and better able to afford better trade facilitation reforms to boost trade with a resulting positive social welfare outcomes. In addition, trade facilitation measures may also be correlated with unobserved variables captured in the error term. These concerns of trade facilitation indicators being potentially endogenous threaten the identification of the effects of trade facilitation on social welfare. Another important concern regarding the consistent estimation of dynamic panel models (like Eq. (1)) is the presence of the lagged dependent variable among the regressors on the right-hand side. As Nickell (1981) and Anderson and Hsiao (1982) pointed out, in fixed dynamic models with small T and large N, the first-order autoregressive term, SWt−1, may also be correlated with unobserved country-specific variables absorbed in the error term. This renders the ordinary least squares and within-group estimates of α biased and inconsistent.
A standard way to address these concerns is to find valid instrumental variables for the trade facilitation measures, but these are not readily available. Therefore, we resort to the system-GMM-type instruments (see Arellano and Bover, 1995; Blundell and Bond, 1998; Roodman, 2009). Firstly, the system-GMM estimator eliminates unobservable individual-specific effects and its inherent omitted-variable bias by first-differencing Eq. (1):
Secondly, the system-GMM estimator simultaneously combines both the differenced and level equations, and uses suitably lagged level and differenced variables as instruments in estimating the parameters. The instruments for the explanatory variables in the level equation are the respective lagged differences, and those for the differenced equation are the respective lagged level variables. This technique permits the estimation of the ‘true’ effects in the presence of potentially endogenous explanatory variables.7 While the exogeneity of the GMM-type instruments is often disputed, the system-GMM estimator is widely used because of its superior small sample properties, particularly, when the series are persistent (Blundell et al., 2001). For the lagged endogenous variables to be appropriate instruments for their current values, the system-GMM estimator relies on the assumption that idiosyncratic disturbances do not exhibit significant second-order serial correlation in the differences. Hence, the validity of the internally generated instruments is verified using Arellano–Bond test for second-order correlation in the differenced residuals, along with the Hansen test for over-identification restrictions.
3. Data and measurement issues
The results reported in this paper are based on data on correlates of social welfare indicators, trade facilitation indices and other control variables for 40 African countries over the period 2010–2015.8 A short summary of all of these variables, data sources, how social welfare and trade facilitation measures are constructed, and summary statistics are presented in Tables 1–3. Table A1 in Appendix presents the list of countries.
| Variables | Definition | Source |
|---|---|---|
| Social welfare indicators | ||
| Education | Primary education enrolment, net % | WEF GCI |
| Under-5 mortality | Mortality rate, under-5 (per 1000 live births) | WB WDI |
| Life expectancy | Life expectancy at birth, total (years) | WB WDI |
| Human development | Human Development Index (a composite statistic of life expectancy, education, and per capita income indicators) | HDR UNDP |
| Trade facilitation indices | ||
| Infrastructure | Transport infrastructure (based on quality of roads, seaports, and airports) | Authors’ construct based on WEF GCI |
| Institutions | Institutions (based on irregular payments and bribes, favoritism in decisions of government officials, transparency of government policymaking, public trust in politicians, and burden of government regulation) | Authors’ construct based on WEF GCI |
| Market efficiency | Ease of trading across borders (based on prevalence of trade barriers and Burden of customs procedures) | Authors’ construct based on WEF GCI |
| Controls | ||
| Population density | People per sq. km of land area | WB WDI |
| Inflation | Change in annual consumer price index | WB WDI |
Note: WEF GCI is World Economic Forum Global Competitiveness Index; WB WDI is World Bank World Development Indicators; and HDR UNDP is Human Development Report of the United Nations Development Programme.
Definition of variables and data source.
| Trade facilitation index | Eigenvalue | Proportion explained | Primary variables | Eigenvectors | Correlation coefficients | Bartlett (p-value) |
|---|---|---|---|---|---|---|
| Infrastructure index | 2.371 | 0.791 | Quality of roads | 0.559 | 0.861 | 0.000 |
| Quality of airports | 0.592 | 0.912 | ||||
| Quality of seaports | 0.581 | 0.894 | ||||
| Institutions index | 3.836 | 0.767 | Payment of bribes | 0.443 | 0.867 | 0.000 |
| Favoritism | 0.470 | 0.921 | ||||
| Transparency | 0.441 | 0.864 | ||||
| Regulatory burden | 0.408 | 0.800 | ||||
| Trust in government | 0.471 | 0.922 | ||||
| Market efficiency index | – | – | Prevalence of trade barriers | – | – | – |
| Burden of custom procedures | – | – | ||||
| Composite trade facilitation index | 5.949 | 0.595 | Quality of roads | 0.316 | 0.803 | 0.000 |
| Quality of airports | 0.283 | 0.753 | ||||
| Quality of seaports | 0.278 | 0.746 | ||||
| 1.547 | 0.155 | Payment of bribes | 0.365 | 0.878 | ||
| Favoritism | 0.331 | 0.738 | ||||
| Transparency | 0.368 | 0.881 | ||||
| Regulatory burden | 0.277 | 0.601 | ||||
| Trust in government | 0.327 | 0.727 | ||||
| Prevalence of trade barriers | 0.238 | 0.623 | ||||
| Burden of custom procedures | 0.354 | 0.859 |
Note: The principal component scores were normalized to a scale of 0–1 using min–max transformation with higher values corresponding to better outcomes. The correlation coefficients show the degree of correlation between the constructed index and the corresponding primary variables used. The number of principal components was selected by the Kaiser criterion of eigenvalue greater than one. The trade facilitation index for market efficiency is constructed as the simple average of the two primary indicators. The null hypothesis of the Bartlett test of sphericity is that, the variables are not intercorrelated.
Construction of trade facilitation indices from primary indicators.
| Variable | Obs., N | Mean | Std. Dev. | Min | Max |
|---|---|---|---|---|---|
| Social welfare indicators | |||||
| Net primary (education) enrolment rate (%) | 229 | 83.655 | 12.677 | 37.690 | 99.416 |
| Under-5 mortality rate (%) | 240 | 71.558 | 37.873 | 13.400 | 182.500 |
| Life Expectancy (years) | 240 | 60.914 | 7.608 | 47.483 | 74.808 |
| Human development | 200 | 0.534 | 0.116 | 0.371 | 0.77 |
| Trade Facilitation Indices | |||||
| Infrastructure | 240 | 0.427 | 0.225 | 0 | 1 |
| Institutions | 240 | 0.339 | 0.182 | 0 | 1 |
| Market efficiency | 240 | 0.576 | 0.195 | 0 | 1 |
| Composite trade facilitation index | 240 | 0.459 | 0.213 | 0 | 1 |
| Controls | |||||
| Population density | 240 | 99.555 | 125.845 | 2.664 | 621.973 |
| Inflation (%) | 231 | 6.214 | 5.333 | −3.704 | 33.224 |
Summary statistics.
3.1. Social welfare and trade facilitation measures
We follow Srinivasan (2012) and use net primary school enrolment rate, under-5 mortality rate, life expectancy (years), and human development index as proxies for social welfare. Aside the data on human development index, which is sourced from Table 2 of the 2016 Human Development Report (United Nations Development Programme: UNDP, 2016), the data on the other social welfare measures are sourced from the World Bank’s World Development Indicators (WDI).
With regard to trade facilitation measures, we construct three indices from several primary indicators which capture infrastructure, institutions, and market efficiency. The primary variables are taken from the World Economic Forum’s (WEF) Global Competitiveness Index (GCI) database. The composite indices for infrastructure and institutions are constructed as the first principal component scores of the underlying variables; quality of roads, quality of airports, quality of seaports for infrastructure, and payment of bribes, favoritism, transparency, regulatory burden, and trust in government for institutions. The index for market efficiency is constructed as the simple average of two primary indicators (prevalence of trade barriers and burden of customs procedures). Additionally, a composite trade facilitation index is constructed from the first two component scores of primary indicators, namely, quality of roads, quality of seaports, quality of airports, irregular payments and bribes, favoritism in decisions of government officials, transparency of government policymaking, public trust in politicians, burden of government regulation, prevalence of trade barriers, and burden of customs procedures. All the underlying variables were originally reported on a scale of 1 to 7, with higher values signifying better outcomes. To facilitate comparison and interpretation, we normalized the newly constructed trade facilitation indicators on a continuous scale of 0 (worst) to 1 (best) using the min–max transformation method. As a priori, we expect that improvement in trade facilitation measures will translate into positive social welfare outcomes. Details of the primary trade facilitation indicators and the results of the principal component analysis (PCA) are provided in Table 2. Fig. 1 shows the change in the trade facilitation measures, capturing infrastructure, institutions and market efficiency, over the period 2010–2015. Alarmingly, the graphs show that apart from a handful of countries, which have experienced marginal improvements between 2010 and 2015, most African countries have seen a deterioration in the quality of infrastructure, the quality of institutions and the efficiency with which customs procedures facilitate trade across borders. However, the scatterplots in Fig. 2 clearly shows that improvements in trade facilitation are strongly associated with better social welfare outcomes.

Change in trade facilitation measures between 2010 and 2015. Source: Authors’ own elaboration based on the WEF Global Competitiveness Index dataset. Note: Countries with bars above (below) zero have experienced an improvement (deterioration) in the trade facilitation measures between 2010 and 2015. See Appendix for list of countries.
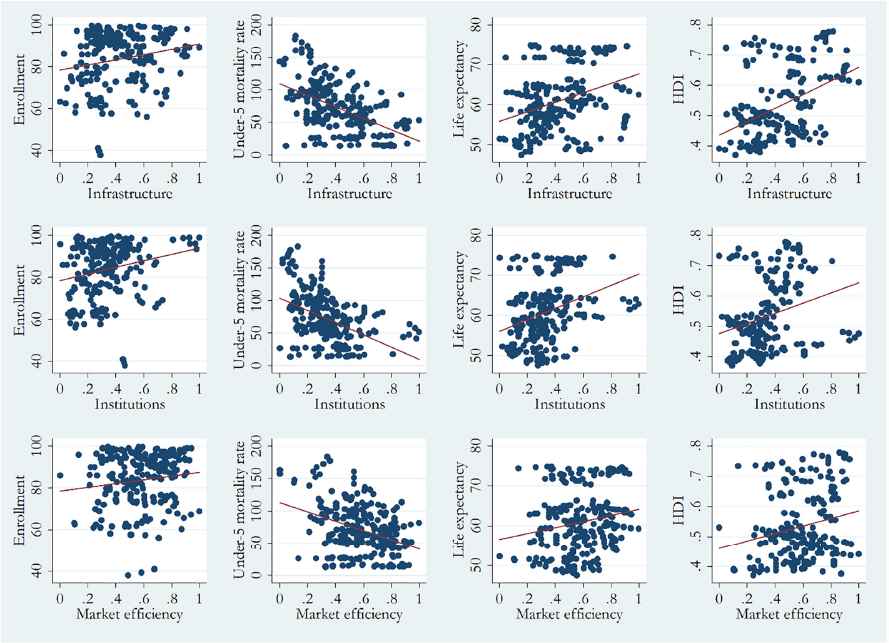
Scatterplots of trade facilitation measures against social welfare measures. Note: Linear trends are fitted values. Enrollment and HDI stands for net primary school enrollment rate and Human Development Index respectively. The trade facilitation indices are normalized between 0 and 1, with higher values indicating better trade facilitation outcomes. Source: Authors’ own elaboration based on data from World Development Indicators, Human Development Report, and Global Competitiveness Index.
3.2. Control explanatory variables
Population density and inflation rate serve as control variables and are taken from the World Bank’s WDI. As Angrist and Pischke (2008) note, these variables are strictly exogenous and do not correlate with trade facilitation. We expect increments in population density, due to rapid population growth, to result in increased pressure on land, which may in turn lead to lower land per capita, landlessness, environmental degradation, and inevitably, increased rates of poverty and deterioration in social welfare outcomes (Ahlburg, 1996). Inflation rate is a proxy for macroeconomic conditions. High inflationary pressures can negatively affect social welfare by substantially reducing the purchasing power of the populace, especially when increments in nominal wages do not keep pace with increases in the price levels of consumer goods.
4. Empirical results and discussion
This section of the paper reports and discusses the empirical results obtained from the system-GMM estimation method. These results are reported in Tables 4–7. In each Table, we report five estimation results distinguished by the trade facilitation measure used: infrastructure (Model 1), institutions (Model 2), market efficiency (Model 3), a composite trade facilitation index (Model 4), and infrastructure, institutions, and market efficiency captured in the same model (Model 5).9 The dependent variables of the results reported in Tables 4–7 are indicators of social welfare, namely, education (measured as net primary school enrollment), child health (measured as under-5 mortality rate), population health (measured by life expectancy), and human development (measured by human development index) respectively.
| Variables | Model 1 | Model 2 | Model 3 | Model 4 | Model 5 |
|---|---|---|---|---|---|
| Education (−1) | 0.889 *** (0.011) | 0.972 *** (0.007) | 0.990 *** (0.006) | 0.940 *** (0.012) | 0.944 *** (0.010) |
| Population density | 0.002 (0.005) | −0.005 (0.003) | 0.006 ** (0.002) | 0.007 * (0.003) | 0.005 (0.007) |
| Inflation | −0.103 *** (0.024) | −0.105 ** (0.049) | 0.016 (0.030) | −0.085 ** (0.039) | 0.069 (0.081) |
| Infrastructure | 0.064 *** (0.014) | 0.157 *** (0.033) | |||
| Institutions | 0.050 *** (0.012) | −0.065 * (0.035) | |||
| Market efficiency | −0.005 (0.008) | −0.045 (0.033) | |||
| Composite trade facilitation index | 0.018 * (0.010) | ||||
| Constant | −0.021 (0.021) | 0.023 * (0.012) | −0.024 ** (0.010) | −0.038 *** (0.012) | −0.035 (0.026) |
| No. of Observations | 182 | 182 | 182 | 182 | 182 |
| No. of Countries | 40 | 40 | 40 | 40 | 40 |
| AR(2) | −0.539 | −0.514 | −0.602 | −0.492 | −0.829 |
| AR(2) p-value | 0.590 | 0.607 | 0.547 | 0.623 | 0.407 |
| Hansen Stat | 25.052 | 32.670 | 22.403 | 26.326 | 20.838 |
| Hansen p-value | 0.723 | 0.337 | 0.839 | 0.658 | 0.998 |
Dependent variable: net primary school enrollment. Composite trade facilitation index is a PCA constructed from quality of roads, seaports, and airports, irregular payments and bribes, favoritism in decisions of government officials, transparency of government policymaking, public trust in politicians, and burden of government regulation, prevalence of trade barriers and burden of customs procedures. Robust standard errors in parentheses.
p < 0.10.
p < 0.05.
p < 0.01.
System-GMM estimates of the effect of trade facilitation on education.
| Variables | Model 1 | Model 2 | Model 3 | Model 4 | Model 5 |
|---|---|---|---|---|---|
| Child health (−1) | 0.987 *** (0.001) | 0.976 *** (0.002) | 0.986 *** (0.001) | 0.975 *** (0.002) | 0.986 *** (0.003) |
| Population density | −0.006 *** (0.001) | −0.003 * (0.001) | −0.004 *** (0.001) | −0.001 (0.001) | −0.007 *** (0.002) |
| Inflation | −0.098 *** (0.013) | −0.081 *** (0.015) | −0.091 *** (0.020) | −0.080 *** (0.016) | −0.055 *** (0.017) |
| Infrastructure | −0.028 *** (0.003) | 0.002 (0.010) | |||
| Institutions | −0.120 *** (0.006) | −0.034 *** (0.012) | |||
| Market efficiency | −0.043 *** (0.005) | −0.013 (0.008) | |||
| Composite trade facilitation index | −0.088 *** (0.005) | ||||
| Constant | 0.037 *** (0.006) | 0.069 *** (0.006) | 0.032 *** (0.004) | 0.109 *** (0.007) | 0.044 *** (0.011) |
| No. of Observations | 191 | 191 | 191 | 191 | 191 |
| No. of Countries | 40 | 40 | 40 | 40 | 40 |
| AR(2) | −0.581 | −0.579 | −0.785 | −0.877 | −0.695 |
| AR(2) p-value | 0.561 | 0.562 | 0.433 | 0.381 | 0.487 |
| Hansen Stat | 32.769 | 35.663 | 27.394 | 34.249 | 28.638 |
| Hansen p-value | 0.333 | 0.219 | 0.603 | 0.271 | 0.984 |
Dependent variable: under-5 mortality rate. Composite trade facilitation index is a PCA constructed from quality of roads, seaports, and airports, irregular payments and bribes, favoritism in decisions of government officials, transparency of government policymaking, public trust in politicians, and burden of government regulation, prevalence of trade barriers and burden of customs procedures. Robust standard errors in parentheses.
p < 0.10.
p < 0.01.
System-GMM estimates of the effect of trade facilitation on child health.
| Variables | Model 1 | Model 2 | Model 3 | Model 4 | Model 5 |
|---|---|---|---|---|---|
| Life expectancy (−1) | 0.950 *** (0.002) | 0.951 *** (0.003) | 0.957 *** (0.003) | 0.949 *** (0.004) | 0.963 *** (0.006) |
| Population density | 0.001 ** (0.000) | 0.001 *** (0.000) | 0.001 ** (0.000) | 0.001 (0.001) | 0.002 ** (0.001) |
| Inflation | 0.030 *** (0.005) | 0.025 *** (0.006) | 0.028 *** (0.003) | 0.028 *** (0.004) | 0.020 *** (0.005) |
| Infrastructure | 0.007 *** (0.001) | 0.001 (0.003) | |||
| Institutions | 0.016 *** (0.001) | 0.001 (0.004) | |||
| Market efficiency | 0.008 *** (0.002) | 0.006 ** (0.002) | |||
| Composite trade facilitation index | 0.011 *** (0.003) | ||||
| Constant | 0.207 *** (0.008) | 0.202 *** (0.013) | 0.181 *** (0.011) | 0.209 *** (0.016) | 0.152 *** (0.027) |
| No. of Observations | 191 | 191 | 191 | 191 | 191 |
| No. of Countries | 40 | 40 | 40 | 40 | 40 |
| AR(2) | 1.018 | 1.144 | 1.101 | 1.053 | 1.163 |
| AR(2) p-value | 0.309 | 0.253 | 0.271 | 0.292 | 0.245 |
| Hansen Stat | 32.253 | 29.087 | 30.288 | 33.971 | 26.014 |
| Hansen p-value | 0.356 | 0.513 | 0.451 | 0.282 | 0.994 |
Dependent variable: Life expectancy. Composite trade facilitation index is a PCA constructed from quality of roads, seaports, and airports, irregular payments and bribes, favoritism in decisions of government officials, transparency of government policymaking, public trust in politicians, and burden of government regulation, prevalence of trade barriers and burden of customs procedures. Robust standard errors in parentheses.
p < 0.05.
p < 0.01.
System-GMM estimates of the effect of trade facilitation on life expectancy.
| Variables | Model 1 | Model 2 | Model 3 | Model 4 | Model 5 |
|---|---|---|---|---|---|
| Human development | 0.985 *** (0.004) | 0.974 *** (0.004) | 0.980 *** (0.002) | 0.978 *** (0.005) | 0.976 *** (0.002) |
| (−1) | |||||
| Population density | −0.003 *** (0.001) | −0.002 ** (0.001) | −0.003 *** (0.001) | −0.003 *** (0.001) | −0.002 *** (0.000) |
| Inflation | −0.030 ** (0.012) | −0.013 (0.015) | −0.036 *** (0.013) | −0.021 (0.013) | −0.034 *** (0.009) |
| Infrastructure | −0.002 (0.006) | −0.000 (0.003) | |||
| Institutions | 0.023 *** (0.007) | 0.029 *** (0.004) | |||
| Market efficiency | 0.009 *** (0.002) | −0.008 ** (0.003) | |||
| Composite trade facilitation index | 0.011 * (0.005) | ||||
| Constant | 0.010 *** (0.003) | 0.005 ** (0.002) | 0.005 ** (0.002) | 0.012 *** (0.003) | 0.008 *** (0.002) |
| No. of Observations | 159 | 159 | 159 | 159 | 159 |
| No. of Countries | 40 | 40 | 40 | 40 | 40 |
| AR(2) | 0.256 | 0.273 | 0.171 | 0.112 | 0.561 |
| AR(2) p-value | 0.798 | 0.785 | 0.864 | 0.911 | 0.575 |
| Hansen Stat | 20.005 | 17.089 | 21.042 | 14.238 | 23.417 |
| Hansen p-value | 0.458 | 0.647 | 0.395 | 0.818 | 0.798 |
Dependent variable: Human development. Composite trade facilitation index is a PCA constructed from quality of roads, seaports, and airports, irregular payments and bribes, favoritism in decisions of government officials, transparency of government policymaking, public trust in politicians, and burden of government regulation, prevalence of trade barriers and burden of customs procedures. Robust standard errors in parentheses.
p < 0.10.
p < 0.05.
p < 0.01.
System-GMM estimates of the effect of trade facilitation on human development.
The estimated coefficients measuring the impact of infrastructure (Model 1) on education, child health, and life expectancy are consistent with our a-priori expectations: improvement in the quality of transport infrastructure holds significant potential for enhancement of social welfare in Africa. The magnitude of the coefficients suggests that for every 1% improvement in the quality of infrastructure, net primary school enrollment increases by 6.4% (Table 4), life expectancy at birth increases by 0.7% (Table 6), and under-5 mortality rate declines by 2.8% (Table 5). As evident from the results, these coefficients are all statistically significant at 1% level. These results lend empirical support to our hypothesis that the impact of infrastructural development — be it roads, airports, or seaports — transcend intermediary indicators like trade flows and income to broader dimensions of social welfare.
The beneficial impact of infrastructure on education, child health and population health can be seen from a number of angles including, affordability and accessibility. Good infrastructure stimulates economic activities and employment, and boosts income (Esfahani and Ramírez, 2003; Démurger, 2001; Pradhan and Bagchi, 2013). With higher incomes, people are better positioned to enroll their children in schools, invest in their education, as well as afford to pay out-of-pocket healthcare expenses in the event of illness of household members. Besides the fact that infrastructure improves economic activities and employment, government revenue is also enhanced. The government is therefore able to provide more and better education and health services, which will be reflected in the building of more schools/hospitals (and training of more teachers/health practitioners). In addition to the income effects on education and health, improved transport infrastructure also increases access to educational institutions and health facilities (Jouanjean et al., 2015). Improved infrastructure reduces distance (and transport costs) to schools, health centers, as well as markets for social welfare-enhancing goods and services. With increased accessibility, not only are children of school going age encouraged to attend school on regular basis, but households are also able, with little or no difficulty, to seek ante-natal/post-natal care and medical attention in the event of illness. To a large extent, these contribute to reduction in infant mortality (better child health) and improvements in education (better human capital development) and life expectancy (better population health). These findings are consistent with Galiani et al. (2002), Leipziger et al. (2003),and Calderon and Servén (2004), who in their studies, recount how beneficial infrastructure is for education and health improvement especially in developing countries.
Surprisingly, we find infrastructure to have an insignificant impact on human development, an overall measure of social welfare. Plausibly, this outcome can be attributed to the fact that transport infrastructure in many poor regions of Africa is in a deplorable state. Given that most of these economies have recently started increasing investment in infrastructural access and improvement, the effect of infrastructure may not have fully trickled down to all areas of livelihood of the populace.
In all the estimated models, we find that institutions (Model 2), aimed at easing trade within and across countries in Africa, may also be good for improving social welfare. Specifically, we find the coefficients of institutions to be positive and highly statistically significant (at 1% level) for regressions where we use education, life expectancy and human development as social welfare measures. In the case where we use child health as a correlate of social welfare, the impact of institutions is found to be negative and highly statistically significant. All other things being equal, the size of the coefficients imply that net primary school enrollment increases by 5% (Table 4), life expectancy at birth rises by 1.6% (Table 6), overall human development increases by 2.3% (Table 7), and child health improves by 12% (Table 5), when institutions improves by 1%. These results are consistent with our a-priori expectation and imply that improvement in institutions leads to improvement in education, child health, life expectancy, and human development.
It has largely been argued that institutions remain the major underlying factor explaining the disparity that exist between the prosperity of countries that is why some countries are rich and others are poor (Acemoglu and Robinson, 2010; Acemoglu et al., 2001). Considering how beneficial institutions are to human wellbeing, it is not surprising that in this paper, we find that improvement in institutions is good for enhancing social welfare. Our results are largely supported by the empirical literature (see Acemoglu and Robinson, 2010; Cheema and Maguire, 2001; Knack and Keefer, 1995; Vollmer, 2009). This implies that as institutions (control of bribery and corruption, transparency of government policymaking, regulatory quality rule of law among others) improve, education, life expectancy, child health, and human development enhance in Africa. Since a number of countries in Africa are generally in the formative stages of institutional acceptance and development, the results of the study imply that these countries are potentially poised to benefit in many areas of economic and social concern as they remain on a smooth path of good governance.
With regard to the market efficiency variable (Model 3), we find a positive and statistically significant coefficient in the regression results where we use life expectancy (Table 6) and human development (Table 7) for social welfare, and a significant negative coefficient of market efficiency on child health (Table 2). Market efficiency is however found to have insignificant impact on education (Table 4). We find that, a 1% improvement in the index for market efficiency is associated with a 4.3% improvement in child health, 0.8% increment in life expectancy at birth, and 0.9% improvement in the index of human development. The impact of market efficiency on child health, life expectancy, and human development shows that the greater the ease of trading across borders, the better the state of child health, life expectancy, and human development. Reduction in trade barriers and burden of custom procedures facilitates enormous movement of goods and services among countries (Baldwin and Gu, 2004; Estevadeordal and Taylor, 2013). The associated increased trade leads to economies of scale and capacity utilization, technology spillovers, and prudent management as a result of global competition and increased employment opportunities for labor (Agrawal, 2015; Feder, 1982). The increased trade also enables a country gain foreign exchange that it could use to import supplementary services, capital equipment, and other materials that make life better for its people. Essentially, easing trade and increasing trade would enable the government get more financial resources required to improve the wellbeing of its people.
In Model 4 of Tables 4–7, we report the impact of the composite index of trade facilitation on the social welfare measures. The essence is to find the overall impact of trade facilitation on these measures. As evident, the results are largely found to be consistent with those reported in Models 1–3 of Tables 4–7. The coefficient for this variable is positive and statistically significant for the estimations in which education, life expectancy, and human development are used as measures of social welfare (see Tables 4, 6–7), and negative when child health is the measure of social welfare (Table 5). The result indicates that trade facilitation is associated with improvement of social welfare in Africa. In Model 5 of Tables 4–7,we include all the three trade facilitation indicators — infrastructure, institutions, and market efficiency — in the same equation. In these estimations, we find the impact of infrastructure on education, institutions on child health and human development, and market efficiency on life expectancy to be consistently and robustly associated with improvement of social welfare. These outcomes, though should be interpreted with caution because of the moderate level of correlation among infrastructure, institutions and market efficiency measures of trade facilitation, provide additional support for why trade facilitation matter for improvement of social welfare in Africa.
It is important to note that in all the estimated models, the coefficients of the lagged dependent variables, which capture the initial levels of social welfare indicators are positive and statistically significant. This result substantiates the persistence of social welfare over time. With respect to the impact of population density and inflation on our social welfare measures, we find inconclusive results. Individually, increment in population density is found to be significantly associated with improvement in child health and life expectancy. However, considering human development index as a holistic measure of social welfare, we find the coefficient of the population density variable to be negative and statistically significant. This is not surprising as increasing population without corresponding increase in resources (e.g., land, infrastructure, and social amenities among others) puts pressure on the existing scarce ones, which tends to lower the quality of life and overall wellbeing. Similarly, inflation is found to worsen education and improve child health (reduce under-5 mortality) and life expectancy. On the one hand, where most people (especially, the poor) are net buyers, higher and increasing prices increase the cost of living, reduce their purchasing power, and limit their capacity to invest in education and access other basic needs of life. On the other hand, where the people are net sellers, they tend to benefit from high inflationary pressures in the form of increased revenues (incomes) and this potentially translates into increased investment in child health (reflected in reduced under-5 mortality). However, we find that in general, inflation is detrimental to human development, as most of the world’s poor are net buyers, and the negative effects outweigh the beneficial effects.
5. Concluding remarks
This paper has examined the extent to which trade facilitation contributes to improvement of social welfare in a sample of 40 African countries over the period 2010–2015. We constructed three measures of trade facilitation, which capture infrastructure, institutions, and market efficiency from several primary indicators. In addition, we created a composite measure of trade facilitation from these primary indicators. We employed broader measures of social welfare, namely, education (net primary school enrollment rate), child health (under-5 mortality rate), population health (life expectancy), and human development (human development index). Using the system-GMM estimation technique, we find that trade facilitation is associated with improvement of social welfare in Africa. Our findings suggest that, improving education, child health, population health, and human development, effective trade facilitation reforms, targeted particularly at improving infrastructure, institutions, and market efficiency, is likely to be associated with enhanced social welfare in Africa.
Notwithstanding this outcome, it is important to note that the scope of the results of this paper is reduced significantly in the following two ways. First, the paper argues that trade facilitation can affect social welfare through boosting competitiveness of domestic firms, increasing trade and trade revenues, enhancing employment, reducing prices of imported products, and increasing inflows of foreign direct investment among others. However, in this paper, we do not test the effect of trade facilitation on these intermediate channels, and how these in turn affect social welfare. Second, the paper considered only limited sample informed by the lack of data for a substantial number of African countries over a longer time period. This short-time period can affect the variability in trade facilitation and social welfare measures used. Consequently, as data become available for a reasonable time period for a significant number of African countries, further research on the effects of trade facilitation on social welfare, aside from dealing with issues related to intermediate channels in detail, can consider extending the sample period as well. All in all, the paper has shown that improving trade facilitation in Africa to transform the trade environment is a promising avenue to enhance social welfare.
Acknowledgments
Earlier version of the paper was presented at the 8th Annual Ibadan Sustainable Development Summit held at the Centre for Sustainable Development, University of Ibadan, Ibadan, Nigeria, August 21–24, 2017. Authors thank participants of this summit, two anonymous reviewers, and the editor of this journal, Augustin Fosu, for the helpful comments and suggestions. All remaining errors are those of the authors.
Funding
This work was supported by Volkswagen Foundation within its Postdoctoral Fellowship Program in sub-Saharan Africa [Grant Number: 89867].
Appendix A
| Code | Country | Code | Country |
|---|---|---|---|
| DZA | Algeria | MDG | Madagascar |
| AGO | Angola | MWI | Malawi |
| BEN | Benin | MLI | Mali |
| BWA | Botswana | MRT | Mauritania |
| BFA | Burkina Faso | MUS | Mauritius |
| BDI | Burundi | MAR | Morocco |
| CMR | Cameroon | MOZ | Mozambique |
| CPV | Cape Verde | NAM | Namibia |
| TCD | Chad | NGA | Nigeria |
| CIV | Cote d’Ivoire | RWA | Rwanda |
| EGY | Egypt | SEN | Senegal |
| ETH | Ethiopia | SYC | Seychelles |
| GAB | Gabon | SLE | Sierra Leone |
| GMB | Gambia, The | ZAF | South Africa |
| GHA | Ghana | SWZ | Swaziland |
| GIN | Guinea | TZA | Tanzania |
| KEN | Kenya | TUN | Tunisia |
| LSO | Lesotho | UGA | Uganda |
| LBR | Liberia | ZMB | Zambia |
| LBY | Libya | ZWE | Zimbabwe |
List of countries.
Footnotes
Peer review under responsibility of Afreximbank.
For the period 1990–1999, the average export share of Africa was 2.4%, compared with that of 20.3, 29.1, 46.8, and 1.4% in America, Asia, Europe, and Oceania respectively. For the period 2000–2009, Africa did 2.7% relative to 18.4, 33.5, 44, and 1.3% for America, Asia, Europe, and Oceania respectively. Also, for the 2010–2016 period, the average export share of Africa was 3% as compared with 16.8, 40.2, 38.4, and 1.6% for America, Asia, Europe, and Oceania respectively. These statistics are computed with data from UNCTAD; http://unctadstat.unctad.org/wds/TableViewer/tableView.aspx
In their study on why trade facilitation matters for Africa, they found that the benefits of reducing trade cost in Africa by half to the level of Mauritius improves trade performance significantly compared to a reduction in tariff barriers.
The trade facilitation agreement adopted in 2014 sets forth measures aimed at expeditiously moving goods across borders.
Duval (2006) in his work, for example, argues that despite the many benefits trade facilitation may come with, some countries especially the developing ones may still be unwilling to embrace it.
According to Portugal-Perez and Wilson (2012) trade facilitation in Africa is inadequate because of frequent customs delays, many documentations, corruption, unreliable and inadequate energy supply, telecommunication, and transportation problems among several other trade impediments.
The composite indices are constructed from the following primary trade facilitation indicators; quality of roads, seaports, and airports, irregular payments and bribes, favoritism in decisions of government officials, transparency of government policymaking, public trust in politicians, and burden of government regulation, prevalence of trade barriers and burden of customs procedures. Details on how these indices are constructed are discussed in Section 3.
Readers are referred to Arellano and Bover (1995), Blundell and Bond (1998), Roodman (2009), Wooldridge (2010), and Baltagi (2013) for additional information on the system-GMM estimator.
The limited sample size employed in this study is largely informed by availability of trade facilitation indicators for African countries. Many studies using trade facilitation variables have encountered this challenge (see for example Portugal-Perez and Wilson, 2012; Viet, 2015; Sakyi et al., 2017).
Time dummies, capturing time-specific effects, are included in all specifications but are not reported in the tables to conserve on space.
References
Cite this article
TY  - JOUR
AU  - Daniel Sakyi
AU  - Isaac Bonuedi
AU  - Eric Evans Osei Opoku
PY  - 2018
DA  - 2018/11/04
TI  - Trade facilitation and social welfare in Africa☆
JO  - Journal of African Trade
SP  - 35
EP  - 53
VL  - 5
IS  - 1-2
SN  - 2214-8523
UR  - https://doi.org/10.1016/j.joat.2018.08.001
DO  - 10.1016/j.joat.2018.08.001
ID  - Sakyi2018
ER  -