
Oil prices and African stock markets co-movement: A time and frequency analysis
- DOI
- 10.1016/j.joat.2018.03.002How to use a DOI?
- Keywords
- F3; C1; G1
- Abstract
This paper examines the co-movement between OPEC (Organization of Petroleum Exporting Countries) oil prices and the six largest African stock markets. We used wavelet coherence to analyze the evolution of this relationship both in time and by frequency. Our results show that the co-movement between African stock markets and oil prices is relatively low, with the exception of emerging stock markets such as South Africa and Egypt. For most of the African stock markets, the co-movement takes place over large time scales and both during and after the U.S. financial crisis. At small scales, African stock markets could represent a means of capital diversification for active investors in the oil market.
- Copyright
- © 2018 Afreximbank. Production and hosting by Elsevier B.V. All rights reserved.
- Open Access
- This is an open access article under the CC BY-NC license (http://creativecommons.org/licences/by-nc/4.0/).
1. Introduction
For several decades, oil has been one of the most widely used commodities. Oil is used in different forms in all sectors and at almost all levels of the world economy. Even the recent advent of renewable and alternative energies has not really changed the level of world oil consumption. According to IEA1, world oil consumption continues to grow. Developed and industrialized countries are by far the major oil consumers. However, the low consumption of this commodity in Africa does not mean that this continent is on the margins of the world oil market.
Since the 1970s, the African continent has been known internationally as a significant producer of oil. African countries, such as Algeria, Nigeria, Libya, and Angola, are all OPEC’s members who have become key players in world oil production. Gabon, Congo, and Chad, all of which are countries in whose economies oil production plays a very important role, are among the main producers at the African level. South Africa, despite its low oil production compared with the major oil-producing countries in Africa, is nevertheless, one of the largest oil importers in Africa. The discovery of oil wells off the Ivory Coast and Ghana has allowed them to enter the restricted circle of African oil-producing countries. Very recently, oil was detected in Sénégal. In 1987, the intergovernmental organization APPA2 was founded in Lagos, Nigeria, to serve as a platform for cooperation, collaboration, and sharing of knowledge and expertise for all African oil producers. This association reflects the importance of the oil market in African economies.
Nowadays, oil prices depend on market demand, quantity produced, available reserves, the geopolitical situation, and many other factors. For several years, the impact of oil prices on various economic and financial variables has been a very popular topic.
Moreover, the stock markets are more or less defined as either the barometer or the mirror of a country’s economic activity. They play a prominent role in capital accumulation, productivity of capital, financing of technological innovation, and economic development (see Hicks, 1969; Schumpeter, 1912; Levine, 1997). In addition, oil is one of the most important commodities and has a significant impact on country’s economic activity, whether it is an importer or an exporter of oil.
Regarding the theoretical relationship between oil prices and stock markets, the International Monetary Fund (2000) argues that oil price shocks influence stock markets through their impact on economic activity, corporate income, inflation, and monetary policy.
According to the Discounted Cash Flows (DCF) approach3 of Huang et al. (1996), oil price shocks can affect the stock prices in different ways. First, oil is a commodity used at almost all economic levels, and a change in future oil prices has a direct impact on the expected cash flows of most companies, especially those that are heavily dependent on oil prices. Then, depending on whether a country is an oil exporter or an oil importer, a change in oil prices leads to a change in the trade balance of the country. These shocks to the trade balance then affect the exchange rate, which, in turn, influences the country’s inflation rate. As the expected inflation rate and the discount rate are positively related, this has a direct impact on stock prices (see Huang et al., 1996). Thus, the impact of oil prices on stock markets varies according to the nature of countries or firms4 listed on the stock market.
The relationship between oil prices and stock markets was illustrated during the financial crisis in the United States (US). Redoulès (2009) showed that the economic recession in the US, a direct consequence of the financial crisis, has led to a decline in oil consumption. Dupuis and D’Anjou (2008) found that fear and lack of confidence that spread in the financial system caused investors to withdraw their capital from the oil market. In addition, Mba (2009) noted a reduction in demand for oil from the main oil companies due to the lack of funds, which results in lower oil prices. All these circumstances have led to a fall in oil prices.
The analysis of this relationship, for an African continent in full financial growth and with many oil resources, is relevant. This would help to better understand and prevent financial crises and oil prices shocks through various economic and financial measures. A better knowledge of this co-movement could also be beneficial for investors who are more or less linked to the oil market and are seeking to diversify their capital because of a weakly integrated African stock market (Collins and Biekpe, 2003a, 2003b).
Most studies on this relationship usually focus on the Nigerian stock market.5 We can cite Asaolu and Ilo (2012), Babatunde et al. (2013), Adebiyi et al. (2009), and Ogiri et al. (2013), who studied the impact of oil prices on the Nigerian stock market. Chisadza et al. (2013) were interested in the influence of oil prices on the South African stock market. In Kenya, Gatuhi and Macharia (2013) examined the relationship between diesel prices and stock market returns. Maghyereh (2004) analyzed the link between oil prices and 22 emerging stock market returns, including South Africa, Egypt, and Morocco.
However, these papers are limited in scope. They study the relationship between stock markets and oil prices without taking the many time scales into account. The stock market is a complex structure composed of agents with many investment horizons that together form the dynamics of the operation of the market. According to Candelon et al. (2008), heterogeneous investors make decisions based on their investment horizon (scale). Taking these different horizons into account could provide more information on the co-movement between stock markets and oil prices, which varies according to time scales. Even, the Co-integration and Error Correction Model6 (see Engle and Granger, 1987), despite its success in dynamic analysis, considers only time scales (short and long run).
Wavelet methods provide a unified framework for measuring dependencies between variables over time and frequencies. These methods allow the analysis of the relationship between stock markets and oil prices over many time scales. This approach provides a better understanding of the dynamic relationship between variables.
The applications of the wavelet methods in this relationship are illustrated in the world’s major stock markets in studies such as those of Jammazi and Aloui (2010), Jammazi and Aloui (2012), Vavr̃ina (2012), Vo (2011), and Martín-Barragán et al. (2013). In GCC7 and Islamic stock markets, we can cite works of Akoum et al. (2012), Abdullah et al. (2014), and Rithuan et al. (2014). These papers, in the main, neglect a growing African stock market.
In our present paper, we apply the Wavelet Coherence method to study the co-movement between the six major African stock markets and the OPEC oil prices, both in time and by frequency. The contribution of our work is twofold. First, to our knowledge, this study on different time scales is the first on the African stock markets. Second, it is the first study comparing the oil prices and African stock markets that extends the analysis to so many African stock markets simultaneously.
The rest of the study is structured as follows. Section 2 presents a brief review of the literature on the relationship between stock markets and oil prices. Section 3 details the methodology used to study the co-movement between stock markets and oil prices. Section 4 examines the data and empirical results, and Section 5 concludes.
2. Literature review
Many authors have been interested in the nexus between stock markets and oil prices. Papapetrou (2001) found that the rise of oil prices negatively affected stock prices in Greece. Sadorsky (1999) showed that changes in oil prices and stock returns were opposite. Kilian and Park (2009) demonstrated that the impact of oil prices shocks on US stock markets varied according to shocks on oil supply or demand. Malik and Hammoudeh (2007) found that the volatility of world oil prices generally affected almost all GCC stock markets and that the impact was greater on the Saudi Arabian stock market. In their study on the co-movement between oil prices, US, and 13 European stock markets, Park and Ratti (2008) found a negative relationship between oil prices fluctuations and stock markets in oil exporting countries apart from Norway. Talukdar and Sunyaeva (2012) analyzed the impact of oil prices shocks on the stock markets returns of 11 OECD member countries. The authors found that the effects of rising oil prices on the stock markets varied depending on the characteristics of the country. The effects were negative when countries were oil importers and positive when they were oil exporters. Wang et al. (2013) demonstrated that oil-exporting countries and countries in which oil played an important role, whether they were importers or exporters, were those whose stock markets were most affected by changes in oil prices. This impact varied depending upon whether the shock was caused by demand or supply. Ono (2011) first showed that the Brazilian stock market, unlike other BRICs stock markets, which responded positively to changes in oil prices, showed no statistically significant response to oil prices. They then found an asymmetric effect of oil prices on the Indian stock market, and also that the volatility of oil prices strongly affected the Chinese and Russian stock markets. Jones and Kaul (1996) found that, for the US and Canada (world’s largest oil producers), oil price shocks in the post-war period had an impact on real cash flows, which then had an impact on stock prices.
In African stock markets, Asaolu and Ilo (2012) showed that an increase in oil prices resulted in a decline in Nigeria stock returns. However, the authors pointed out that given the status of Nigeria as a major oil producer, the government should ensure that oil revenues have a positive impact on stock markets. Adebiyi et al. (2009) demonstrated that oil prices had a negative impact on stock returns in Nigeria and that the variation in the markets was explained by the volatility of oil prices. In Kenya, Gatuhi and Macharia (2013) showed a positive relationship between diesel prices and stock market returns. Chisadza et al. (2013) demonstrated that South African stock market returns positively responded to an increase in oil prices caused by a positive shock to demand and reacted negatively to supply shocks. Ogiri et al. (2013) found that oil prices had a significant impact on the formation of Nigerian stock market prices. In his study on 22 emerging stock markets, including Egypt, Morocco, and South Africa, Maghyereh (2004) showed a low impact of oil price shocks on emerging stock markets. Babatunde et al. (2013) showed that the Nigerian stock market reacted insignificantly to changes in oil prices, but suffered the negative effects over time depending on the nature of the shock.
The application of wavelet methods to the co-movement of stock markets and oil prices is a relatively recent development. One of the pioneer studies in this framework is that of Jammazi and Aloui (2010). The authors, by combining the wavelet and MSVAR8, found that the impact of oil prices in developed stock (France, Japan, and US) markets was asymmetric, but the relationship was negative overall, especially in the short run. Vo (2011) has shown that the oil prices and the OECD stock markets had a lead/lag relationship with each other. At low frequencies (long run), the OEDC’s stock markets led oil prices. Vavr̃ina (2012) applied wavelet tools to the relationship between four major global stock markets and four major commodities during the US financial crisis. The results showed that oil prices co-moved with all stock markets in the second half of 2009 at medium and large scales. Jammazi and Aloui (2012) used Haar9 à trous wavelet transform to explain the relationship between oil prices and 5 developed stock markets in terms of both time and frequency. The wavelet correlation analysis showed that oil prices and stock market returns did not move together at intermediate scales (medium run). The cross correlation at short and medium term presented no sign of co-movement between stock markets and oil prices at the short and the medium run, despite the large variations in oil prices during this period. At large scales, the correlation was negative for Canada and two oil-importing countries (United Kingdom and Germany). Using the wavelet coherence, Akoum et al. (2012) analyzed the relationship between the GCC stock markets and oil prices. The authors found that the co-movement was strong in the long run, even for countries that did not produce oil. The correlation increased after the US financial crisis. Martín-Barragán et al. (2013) demonstrated that the relationship between the world’s major stock markets and oil prices was not sensitive to stock markets shocks, but was sensitive to oil price shocks. This relationship tended to be negative, except for peaks in oil prices in 2008, where it was positive. Abdullah et al. (2014) has combined the Dynamic Conditional Correlations Analysis and the wavelets methods to analyze the co-movement between Islamic Stock Indexes (ISIR) and commodities. The result showed that the correlation between ISIR and oil prices was low at both small and medium time scales but was strong at large time scales. Rithuan et al. (2014) deduced, by means of an analysis based on MODWT10, that oil prices led Saudi Arabian stock markets in the short run, but the trend was reversed in the long run. The Oman stock market was led by oil prices in both the short and the long run. The CWT11 analysis showed that the ISIR were not strongly correlated to the oil prices, except in long run, for Kuwait, Bahrain and Qatar.
3. Methodology
We favor both a time and a frequency analysis. This allows the co-movement between African stock markets and OPEC oil prices to be studied at different time scales. The Wavelet Coherence uses the Continuous Wavelet Transform (see Percival and Walden, 2000), which allows us to decompose time series at different time scales. It is presented as follows.
Let X and Y be, two multivariate stochastic processes with Xn =(X1, X2, …, Xn) and Yn = (Y1, Y2, …, Yn).
First the Cross Wavelet Transform introduced by Hudgins et al. (1993) is calculated as follows:
Then, the Cross Wavelet Power defined by Liu (1994) is determined by
Finally, we calculate the wavelet coherence (see Grinsted et al., 2004). It is defined as the ratio of the cross-spectrum to the product of the spectrum of each series, and is also called local correlation, both in time and frequency of X and Y. It is obtained as follows:
S is a smoothing operator. The consideration of smoothing is important; without smoothing, the coherence is specifically 1 for all time scales. Smoothing is achieved by convolution in time and scale. Finally, the phase difference presented by Torrence and Webster (1999) and Bloomfield (2004) is used to analyze the different cycles of the correlation between the two series with more details. It is defined as follows:
4. Data and empirical results
The data are composed of the main indexes of the six largest African stock markets in terms of capitalization, these are South Africa (TOP40), Egypt (EGX30), Morocco (MADEX), Nigeria (NGSE), Kenya (NSE20), and the West African Economic and Monetary Union12 (BRVM10). As oil price series, we used OPEC oil prices. The variables are defined in Table 1. We used daily data. The data sample covers the period from January 6, 2003 to October 3, 2012 (1739 observations). The choice of this period is justified by the fact that it covers two major financial crises of recent years: the US financial crisis, which affected the levers of recent growth in Africa through a decline in demand for African commodities and reduction in aid; and the European debt crisis, because of the strong economic relations between Africa and Europe. Finally, the study period takes into account both the recent and the rapid development of the African stock markets. We note the presence of missing data, because of the lack of data available at certain times, and the difference in working days between the different stock exchanges. The data were obtained from the Bloomberg and Quandl database. The stock markets and OPEC oil price returns were calculated as follows:
| Variable | Definition |
|---|---|
| TOP40 | The 40 largest companies listed on the Johannesburg Stock Exchange (JSE). |
| EGX30 | The 30 largest companies in terms of liquidity and activity listed on the Egyptian Exchange (EGX). |
| MADEX | The Moroccan Most Active Shares Index includes the most active shares listed on the Casablanca Stock Exchange (CSE). |
| NGSE | The Nigerian Stock Exchange All Shares index includes the largest companies listed on the Nigerian Stock Exchange (NSE) in terms of capitalization. |
| NSE20 | The 20 largest companies in terms of capitalization listed on the Nairobi Stock Exchange (NSE). |
| BRVM10 | The 10 largest companies listed on the Bourse Régionale des Valeurs Mobilières (BRVM). |
| OPEC Oil Prices | The oil price series from Organization of Petroleum Exporting Countries (OPEC). |
Definition of variables.
Several summary statistics of returns are reported in Table 2. All returns have a positive mean. The African stock markets and the OPEC oil prices are profitable and generate profits. The largest standard deviation of EGX30 (Egypt) means that it is the most volatile stock market of the panel. The MADEX (Morocco), which has the lowest standard deviation, is the least volatile stock market. The analysis of skewness shows a negative value13 for half of all the stock returns. These results indicate that there are more negative returns than positive returns in these series. The Jarque–Bera normality test confirms the skewness and kurtosis results, with a p-value < 0.05 for all the returns.
| TOP40 (South Africa) | EGX30 (Egypt) | MADEX (Morocco) | NGSE (Nigeria) | NSE20 (Kenya) | BRVM10 (WAEMU) | Oil Prices (OPEC) | |
|---|---|---|---|---|---|---|---|
| Mean | 0.0007465 | 0.002157 | 0.0006595 | 0.0004339 | 0.0005950 | 0.000396 | 0.0007186 |
| Median | 0.0013186 | −0.009167 | 0.0003421 | 0.0000000 | 0.0001264 | 0.0000000 | 0.0014432 |
| Maximum | 0.1157054 | 0.270457 | 0.0667500 | 0.1175836 | 0.1226793 | 0.1091000 | 0.1732352 |
| Minimum | −0.1108063 | −0.201026 | −0.0826294 | −0.1094187 | −0.1536887 | −0.110334 | −0.1482591 |
| Standard deviation | 0.01727041 | 0.02357086 | 0.01147604 | 0.01488382 | 0.01416611 | 0.01256833 | 0.02189757 |
| Skewness | −0.1245803 | −0.04788301 | −0.2018168 | 0.3737232 | 0.4053332 | 0.5638438 | −0.3610772 |
| Kurtosis | 7.700966 | 19.66901 | 9.706388 | 14.30699 | 26.71967 | 18.7383 | 10.57585 |
| Jarque–Bera | 1604.838 | 20,122.07 | 3268.784 | 9298.784 | 40,790.87 | 18,029.28 | 4194.013 |
| (p-value) | (2.2e-16) | (2.2e-16) | (2.2e-16) | (2.2e-16) | (2.2e-16) | (2.2e-16) | (2.2e-16) |
Descriptive statistics of the daily returns of the stock markets and OPEC oil prices from January 6, 2003 to October 3, 2012 (all variables defined in Table 1).
Table 3 shows Pearson’s correlation between stock markets and OPEC oil prices returns. The South African stock market is most correlated with OPEC oil price returns. The WAEMU and Kenya stock markets even show negative correlations. The WAEMU stock market shows the lowest correlation with oil prices. The Nigerian stock market, despite Nigerian’s status as an African leading oil producing country, shows a weak correlation with OPEC oil prices, compared with that of the South African stock market. However, it should be noted that South Africa is the largest African oil importer. The Egyptian stock market is in third place. The Moroccan stock market, despite a low correlation with the oil prices, is more correlated than the Kenyan and WAEMU stock markets. African stock markets generally show a low linear correlation with OPEC oil prices.
| OPEC oil prices | TOP40 | EGX30 | MADEX | NGSE | NSE20 | BRVM10 | |
|---|---|---|---|---|---|---|---|
| OPEC oil prices | 1 | ||||||
| TOP40 | 0.168 ** | 1 | |||||
| EGX30 | 0.011 | 0.221 ** | 1 | ||||
| MADEX | −0.044 | 0.113 ** | 0.142 ** | 1 | |||
| NGSE | 0.037 | 0.055 | 0.107 ** | 0.098 ** | 1 | ||
| NSE20 | −0.016 | 0.111 ** | 0.162 ** | 0.081 ** | 0.078 ** | 1 | |
| BRVM10 | −0.031 | 0.019 | 0.057 ** | 0.100 ** | 0.031 ** | 0.090 ** | 1 |
Significance code: (5%).
Pearson linear correlations between stock markets and OPEC oil price returns (all variables defined in Table 1).
The analysis of Fig. 1 shows that oil prices and African stock returns are generally more or less correlated at large time scales (low frequency). In South Africa, the largest African oil importer, the co-movement is mainly located at scales 7 and 8 over the periods between 2006 and 2011. The South African stock market generally co-moves with oil prices, except in some places, at the beginning of the scale 8 from 2007 to 2008. There are some strong co-movement points, especially after 2007, at scale 3 and scale 6. It should be noted that the co-movement between the South African stock market and the oil prices is stronger than in all other African stock markets in the study.
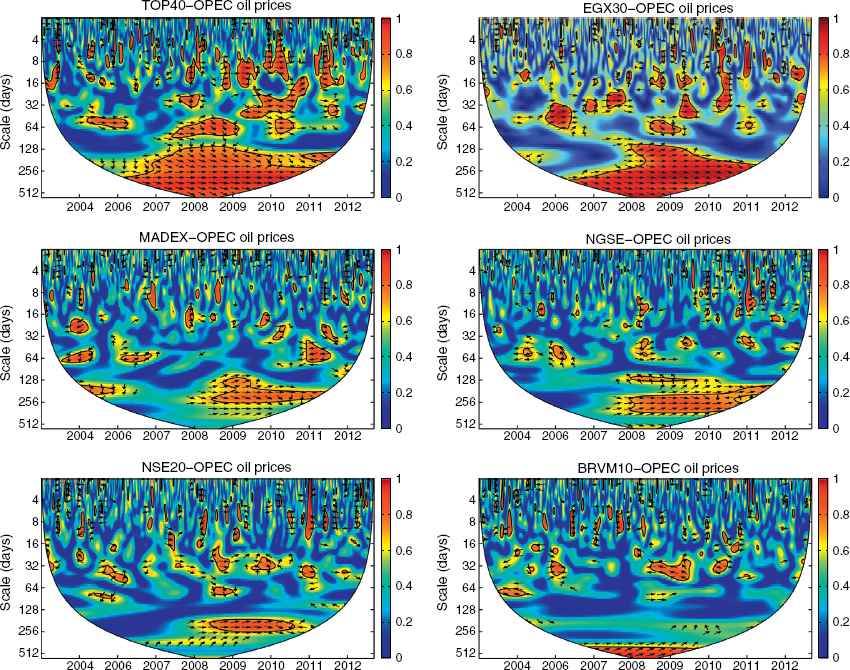
Wavelet coherence between TOP40, EGX30, MADEX, NGSE, NSE20, BRVM10, and OPEC Oil prices (all variables defined in Table 1).Time is defined on the horizontal axis; the scale is represented in abscissa and is defined the following way: scale 1:(0–4 days), scale 2:(4–8 days), scale 3:(8–16 days), scale 4:(16–32 days), scale 5:(32–64 days), scale 6:(64–128 days), scale 7:(128–256 days), and scale 8:(256–512 days), i.e., it varies from the high frequencies to the low frequencies. The thick black line that surrounds the colored part of the plot designates the 5% significance level based on Monte Carlo simulations estimated from using phase randomized surrogate series. The level of correlation is measured by the color from blue (low correlation) to dark red (high correlation). The black line represents the cone of influence that delimits the region affected by the edge; the outside of the cone does not affect the study. When an arrow points to the right, the time series is in phase, and is anti-phase when it points to left. When the arrow is pointing up, the first series leads the second, and the opposite is the case when the arrow is pointing down.
In the Egyptian stock market, the co-movement is over large scales. From 2006 to 2008, at scale 8, and from 2008 to 2011 at scales 7 and 8, the oil prices and the EGX30 are in phase. Oil prices usually lead the EGX30, except at the beginning of the scale 8 from 2008 to 2010. At scales 4 and 5, the co-movement is strong in some places, but it generally remains low.
In Morocco, the second largest African oil importer, we see that the co-movement between MADEX and oil prices is relatively strong, at scale 7 from 2008 to 2012. Generally they are notin phase except from 2008 to 2011 at scale 7 where they are in phase. Each leads the other at a given moment. There are some small areas of strong correlation dispersed at different time scales.
The co-movement between the oil prices and the Nigerian stock market appears low, in view of the country’s status as Africa’s leading producer and exporter of oil. NGSE and oil prices are in phase. At scales 6 and 7, NGSE and oil prices co-move between 2008 and 2012, and the NGSE generally leads oil prices.
The NSE20, Kenya’s main stock index, shows a relatively weak co-movement with oil prices. The correlation is located at scale 7 from 2008 and 2011. They are in phase, and the NSE20 generally leads oil prices. At scales 4 and 5, we note small areas of strong co-movement distributed over time. Finally, in WAEMU, BRVM10 and oil prices co-movement is only strong at scale 8 from 2006 to 2010, and the oil prices are led by the BRVM10.
The strong long-run co-movement between oil prices and the South African stock market can be interpreted by the fact that South Africa is the largest importer of oil in Africa.14 Moreover, the South African stock market is the largest African stock market by far but also the more integrated into the world finance. As for the Egyptian stock market, the co-movement can be explained by the fact that Egypt also has an emerging financial market and is, therefore, more or less linked to the world finance (Boamah, 2013), which is subject to fluctuations in oil prices. In addition, Egypt used to be a major exporter of oil at African level but has recently exported less because of strong local demand for oil.
The low co-movement between the Nigerian stock market and the oil prices is likely due to the fact that the Nigerian stock market, despite its recent expansion, remains poorly integrated with global finance. Another reason might be that, like the Nigerian economy (despite its oil production status, the oil and gas industry accounts for only 15% of the GDP15), the Nigerian stock market is quite diversified. Indeed, oil companies listed on the NGSE index only represent 10% of the total capitalization.
The stock market of Morocco, the second largest African oil-importing country, has a weak relationship with oil prices. The small representation of oil companies listed on the MADEX (Afriquia Gas and very recently Total Morocco16) could be the cause. However, like Nigeria and other African stock markets, the Morocco stock market is weakly integrated into world finance and, therefore, into the oil market. For the WAEMU and Kenya stock markets, the low correlation with the oil prices is the consequence not only of stock markets being weakly integrated into the global finance market, but also of a recent lack of representations of oil companies on the main indices of these stock markets, respectively the BRVM10 and the NSE20.17
The results obtained by the Pearson coefficient and the wavelet coherence method give different conclusions. The analysis of the Pearson coefficient shows that the Nigerian stock market is the second most correlated with oil prices while for the wavelet coherence analysis, it is the Egyptian stock market. These differences are explained by the fact that the Pearson correlation is static and does not take into account the evolution at different time scales of the correlation, contrary to the wavelet coherence, which is dynamic. The wavelet coherence allows a more detailed analysis and provides more information on the co-movement between variables than does the Pearson coefficient.
There is also an increase in the correlation between the stock markets and the oil prices both during and immediately after the US financial crisis. This is explained by the phenomenon of contagion arising from the stock markets in times of crisis, which is illustrated by the spread of financial instability among stock markets causing a strong co-movement between them (Forbes and Rigobon, 2002; McAleer and Nam, 2005). This strong correlation obviously extends to oil prices through their contiguous relationship and leads to a strong co-movement between stock markets and oil prices during periods of crisis.
We finally note that the co-movement between the African stock markets and OPEC oil prices is low. The moments of strong correlation usually occur over the long run and are significant only for the Egyptian and South African stock markets.
5. Conclusion and policy implications
This study has examined the relationship between the six largest African stock markets and OPEC oil prices. We used a time and frequency analysis based on the wavelet coherence to study this relationship at different time scales (horizons). The results of the wavelet coherence show that the co-movement between OPEC oil prices and the African stock markets is very low, with the exception of the two emerging African stock markets, Egypt and South Africa, and generally occurs at large scales for all stock markets (128–512 days). We note that most stock markets show a strong correlation generally both during and after the US financial crisis. We can conclude that the co-movement of oil prices and African stock markets is generally weak in the short and medium run but is particularly strong in the long run for most stock markets.
The results from this study are relevant for optimal portfolio diversification strategies and policy makers. Firstly, the integration in the long run, and sometimes in the medium run, with oil prices means that African stock markets do not react immediately to oil price shocks. This long run integration presents an opportunity for capital diversification for financial agents linked to the global oil market in the short and medium run and, in some cases, for all time horizons. Secondly, the fact that financial markets are not immediately affected by oil price shocks is a certain advantage for African stock markets. This latency period could enable African authorities to better react to the volatility of oil prices and their possible negative effects on stock markets and therefore on trade finance. Indeed, the US financial crisis has shown the likely negative effects of a stock market crash on access to finance trade (see Timothy et al., 2010; Thomas, 2009).
However, if the shocks persist, the stock markets, although not reacting automatically, will eventually feel these effects. Indeed, the Nigeria stock index (NGSE) has been declining since the end of 2014 while the South Africa (TOP40) and Egypt (EGX30) indexes are increasing, thus providing support for the theoretical relationship between oil prices and stock markets.18
Nevertheless, in recent years, African financial authorities have implemented various regional and global financial reforms and policies to take advantage of the benefits of having a well-integrated stock market that remain substantial (Hicks, 1969; Levine, 1997; Calderón and Kubota, 2009). This openness, and the integration into global stock markets, could enhance the relationship between African stock markets and oil prices (short- and medium-run co-movement) given the sensitivity of major world stock markets to oil prices shocks (Sadorsky, 1999; Kilian and Park, 2009; Park and Ratti, 2008). To anticipate this, African authorities and governments should implement measures to diversify energies sources and promote renewable energy in primary, industrial, and domestic sectors; this could make stock prices more independent of oil prices changes and avoid their impact on the trading volume of listed companies in African stock markets (see Dupuis and D’Anjou, 2008). In addition, the authorities should also strengthen local financial institutions in Africa, which are key players in promoting trade finance on the continent, particularly promoting intra-African financial and trade integration in order to be less sensitive to global oil and financial shocks.
Acknowledgments
We would like to thank the Editor-in-Chief of the Journal of African Trade (JAT), Augustin Fosu, and the two anonymous reviewers for their constructive comments and remarks, which helped us to greatly improve the manuscript. The financial support of the Embassy of Ivory Coast in Sénégal is appreciated. The content, views, and the recommendations in this paper are those of the authors and do not necessarily reflect the views of the different African exchanges and OPEC, their boards of directors or their operating policy. Errors remain our responsibility.
Footnotes
International Energy Agency.
African Petroleum Producers Association.
Stock prices are equal to the sum of expected future cash flows of a company discounted by the discount rate.
Exporter (producer) or importer (consumer).
Major African Oil Producer.
Methods used in some of these papers.
Gulf Cooperation Council.
Markov Switching Vector AutoRegressive.
Haar Wavelet (see Graps, 1995).
Maximal Overlap Discrete Wavelet Transform.
Continuous Wavelet Transform.
WAEMU.
The thickest portion of their distributions is to the left.
Note that South Africa and Nigeria are, respectively, net-importing and net-exporting countries, and thus contrasting responses to the declining oil prices.
References
Cite this article
TY  - JOUR
AU  - Grakolet Arnold Zamereith Gourène
AU  - Pierre Mendy
PY  - 2018
DA  - 2018/11/04
TI  - Oil prices and African stock markets co-movement: A time and frequency analysis
JO  - Journal of African Trade
SP  - 55
EP  - 67
VL  - 5
IS  - 1-2
SN  - 2214-8523
UR  - https://doi.org/10.1016/j.joat.2018.03.002
DO  - 10.1016/j.joat.2018.03.002
ID  - Gourène2018
ER  -