
Foreign Direct Investment and Export Competitiveness in Africa: Investigating the Channels
- DOI
- 10.2991/jat.k.191115.001How to use a DOI?
- Keywords
- Export competitiveness; export sophistication; Foreign direct investment; channels
- Abstract
Foreign Direct Investment (FDI) into Africa has surged in recent years. At the same time, international trade has increased, exposing African countries to international competition. This raises the question of whether FDI plays a role in enhancing export competitiveness. This study investigates the impact of FDI on export competitiveness in countries in Sub-Saharan Africa, focusing on the channels of influence. It uses the system generalized method of moments technique, and considers an index of export sophistication as a measure of competitiveness. The study shows that FDI stimulates export competitiveness. Several other factors also enhance export competitiveness, such as human capital, export demand, macroeconomic environment, and the quality of institutions. However, unit labor costs and reduced foreign market access lower export competitiveness. The key channels through which FDI affects export competitiveness are human capital, technological spillovers in the form of forward linkages, and enhancement of domestic productivity. The study also confirmed the possible competition and domination effects of FDI on export competitiveness, which works to crowd out local producers by foreign firms. The results are robust to sensitivity tests including alternative estimation methods and alternative measures of competitiveness. Policy reforms should focus on building human capital and strengthening economic linkages in order to catalyze technological transfers and enhance productivity and competitiveness.
- Copyright
- © 2019 African Export-Import Bank. Publishing services by Atlantis Press International B.V.
- Open Access
- This is an open access article distributed under the CC BY-NC 4.0 license (http://creativecommons.org/licenses/by-nc/4.0/).
1. INTRODUCTION
The rise in globalization over the past 30 years has resulted in rapid changes and mobility of technologies and internationalization of production of goods and services through Foreign Direct Investment (FDI) and trade. In line with these trends, Africa has witnessed a surge in FDI in recent years. For instance, FDI increased from US$5 billion in 1995 to US$48 billion in 2015 United Nations Conference on Trade and Development (UNCTAD, 2016). At the same time, the rise in globalization has exposed many African countries to the pressures of international trade competition. This has raised the question of whether FDI could play a role in enhancing export competitiveness in Africa.
The recent literature on trade highlights the importance of the composition and structure of exports in driving economic growth, by emphasizing that ‘what you export matters’ (Hausmann et al., 2007; Lederman and Maloney, 2012). Hausmann et al. (2007) showed that countries that produce higher productivity goods and export sophisticated or ‘high-tech’ goods are more competitive in international markets and they grow faster. Notwithstanding these observations, Africa’s share of global exports of high technology products remains low. For instance, while developing countries accounted for 52% of global exports of high technology products in 2014, African countries accounted for only 0.3% (UNCTAD, 2015). Thus, African policy makers are confronted with a challenge of igniting export growth and enhancing export competitiveness.
Export competitiveness is important in Africa for several reasons. First, a large strand of the literature, especially on export-led growth hypothesis, suggests that exports are the main determinants of a country’s Gross Domestic Product (GDP) growth (see, e.g., Fosu, 1990; Jordaan and Eita, 2007; Anwar and Nguyen, 2011; Eryigit, 2012). As such, African countries need to diversify their export sectors and improve competitiveness of their exports to sustain their growth rates. Second, export diversification and increased high technology exports play an important role in reducing vulnerability of exports to external shocks, and thus help reduce volatility of economic growth. Third, a stronger export sector helps to drive job creation, especially in manufacturing sectors. Lastly, growth in export of sophisticated products is key to reducing external imbalances, and macroeconomic stability, without creating debt, given the wide current account deficits of most African countries.1
In this view, African economies require policies that invigorate export competitiveness to steer economic growth. To increase the competitive ‘high-tech’ exports, Africa needs to invest significantly in research and development, as well as in technology and innovation. Developing countries, faced with insufficient domestic savings, have over the years emphasized attracting FDI as a way of bridging the gap between insufficient savings and desired investment. Studies on FDI suggest that FDI can play a role in driving productivity and competitiveness of exports by facilitating technological and knowledge transfers, promoting innovation, bringing more efficient production systems, accelerating the upgrading of production technologies, and improving access to new markets (see, e.g., Harrison and Aitken, 1999; Markusen and Venables, 1999; Moran, 2005; Zhang, 2015). The literature on export-led growth also suggests that FDI contributes to growth in countries that promote outward-looking trade (export) policies (see, e.g., Balasubramanyam et al., 1996; Zhang, 2001). This seems to be the case for some East Asian economies such as China, Hong Kong, Taiwan, and South Korea, in which rapid increases in FDI were accompanied by strong export performance and economic growth.
Despite the strong growth of FDI and international trade in Africa, little attention has been paid to the potential role of FDI in promoting export competitiveness. Much of the literature has largely focused on the role of FDI in driving economic growth (see, e.g., Liu et al., 2002; Adams, 2009; Sakyi and Egyir, 2017). Some studies which utilized firm-level data analyzed the role of FDI in promoting firm productivity (see, e.g., Greenaway et al., 2004; Javorcik, 2004; Blalock and Gertler, 2008; Liu, 2008; Pham, 2016). The few studies that analyzed the link between FDI and export performance or competitiveness used either export growth measures or less comprehensive measures of export competitiveness (see, e.g., Lall et al., 2006; Wang and Wei, 2010; Zhang, 2015). In the African context, Mijiyawa (2016) explored the relationship between FDI and exports, but did not consider export competitiveness, which reflects the ability to produce and sell goods competitively in global markets. This leaves a gap in the literature, which calls for deeper analysis.
This paper assesses the role of FDI in driving export competitiveness in Sub-Saharan Africa (SSA). It uses a dynamic panel framework based on Arellano and Bond (1991) and Blundell and Bond (1998) System Generalized Method of Moments (S-GMM) technique on 43 SSA countries for the period 1995–2015. The study focuses on the possible channels through which FDI can impact competitiveness. The study hypothesizes that FDI helps economies to improve competitiveness of their exports by increasing productivity and efficiency through technological transfers, spillovers, human capital development, and augmenting domestic productivity.
The paper contributes to the literature in two ways. First, it evaluates the role of FDI on export competitiveness in SSA using a dynamic panel estimation technique (S-GMM method) and a comprehensive measure of export competitiveness. The S-GMM approach accounts for potential simultaneity bias or endogeneity that may arise because of the potential dual linkages between FDI and export competitiveness and reduces the biases. The dynamic panel approach also controls for country-specific effects. The paper constructs and uses the Expy, a comprehensive measure of export sophistication or competitiveness proposed by Hausmann et al. (2007). The commonly used measures of competitiveness such as real effective exchange rates and export market shares do not capture a country’s export structure and productivity, which are important indicators of competitiveness. The Expy measure captures a country’s export structure and competitiveness as portrayed by the productivity level associated with the country’s exports, based on the greater sophistication of products, rather than merely price effects. It also captures the country’s comparative advantage and the level of demand in the global economy, which provides the basis for specialization. Moreover, the Expy measure has been found to be a strong and robust predictor of economic growth in many countries (Hausmann et al., 2007).
Second, the paper tests for the possible channels through which FDI affects export competitiveness. While some channels have been established in other regions such as Asia and Latin America, Africa’s peculiarities such as low financial sector development, low human capital, and large informal markets make the importance of these channels less obvious. Our approach uses interaction effects to explicitly analyze the channels through which FDI can affect export competitiveness. This enhances our understanding of the role of FDI in driving export competitiveness.
The paper finds that FDI contributes positively to export competitiveness. Human capital, export demand, macroeconomic environment, and regulatory efficiency also enhance export competitiveness. At the same time, higher unit labor costs and restricted access to foreign markets reduce export competitiveness. The study establishes that FDI impacts export competitiveness through human capital, technological spillovers in the form of forward linkages, and enhancement of domestic productive capacities. The findings suggest that SSA countries need to improve their business and macroeconomic environments to attract FDI, as this will enhance the competitiveness of their exports. Policies that support the building of human capacity to augment technological transfer and enhance productivity need to be implemented or strengthened. Attracting FDI brings benefits for the host economy in terms of higher investment, new technologies, as well as innovation, which enhances productivity and competitiveness.
The rest of this paper is organized as follows: Section 2 analyses stylized facts, Section 3 explores the relevant literature on the link between FDI and export competitiveness, and Section 4 presents the econometric methodology used in the study. Section 5 presents the empirical results and discusses the findings, while Section 6 concludes and provides policy implications.
2. STYLIZED FACTS
2.1. FDI Trends in SSA
Foreign direct investment inflows to SSA have risen significantly over the past three decades. Data from UNCTAD (2016) show an increase in FDI inflows from an average of about US$950 million in the 1970s to US$43 billion between 2001 and 2014. This increase helped to support a high average GDP growth of about 5%. Figure 1 shows that FDI inflows as a percentage of total exports averaged 7% in the 1990s and peaked at 17% in 2001, reflecting increasing economic liberalization and improving macroeconomic conditions in SSA countries. These improvements provided incentives to foreign investors. The high FDI inflows recorded from 2006 to 2014 may be a reflection of the significant increase of South–South FDI, especially with the emergence of new partners such as China, India, and Brazil. Intraregional FDI, led by South Africa, also accelerated during the period. However, FDI inflows to SSA still lag behind those of other regions of the world. Data from UNCTAD (2016) indicate that the share of FDI inflows to SSA in the world has fluctuated within a very narrow range (1% and 3%) between 1990 and 2014, the lowest in the world. Comparatively, the FDI-to-exports ratio declined between 2001 and 2006 as well as between 2009 and 2010, possibly reflecting an improvement in exports during the same period.
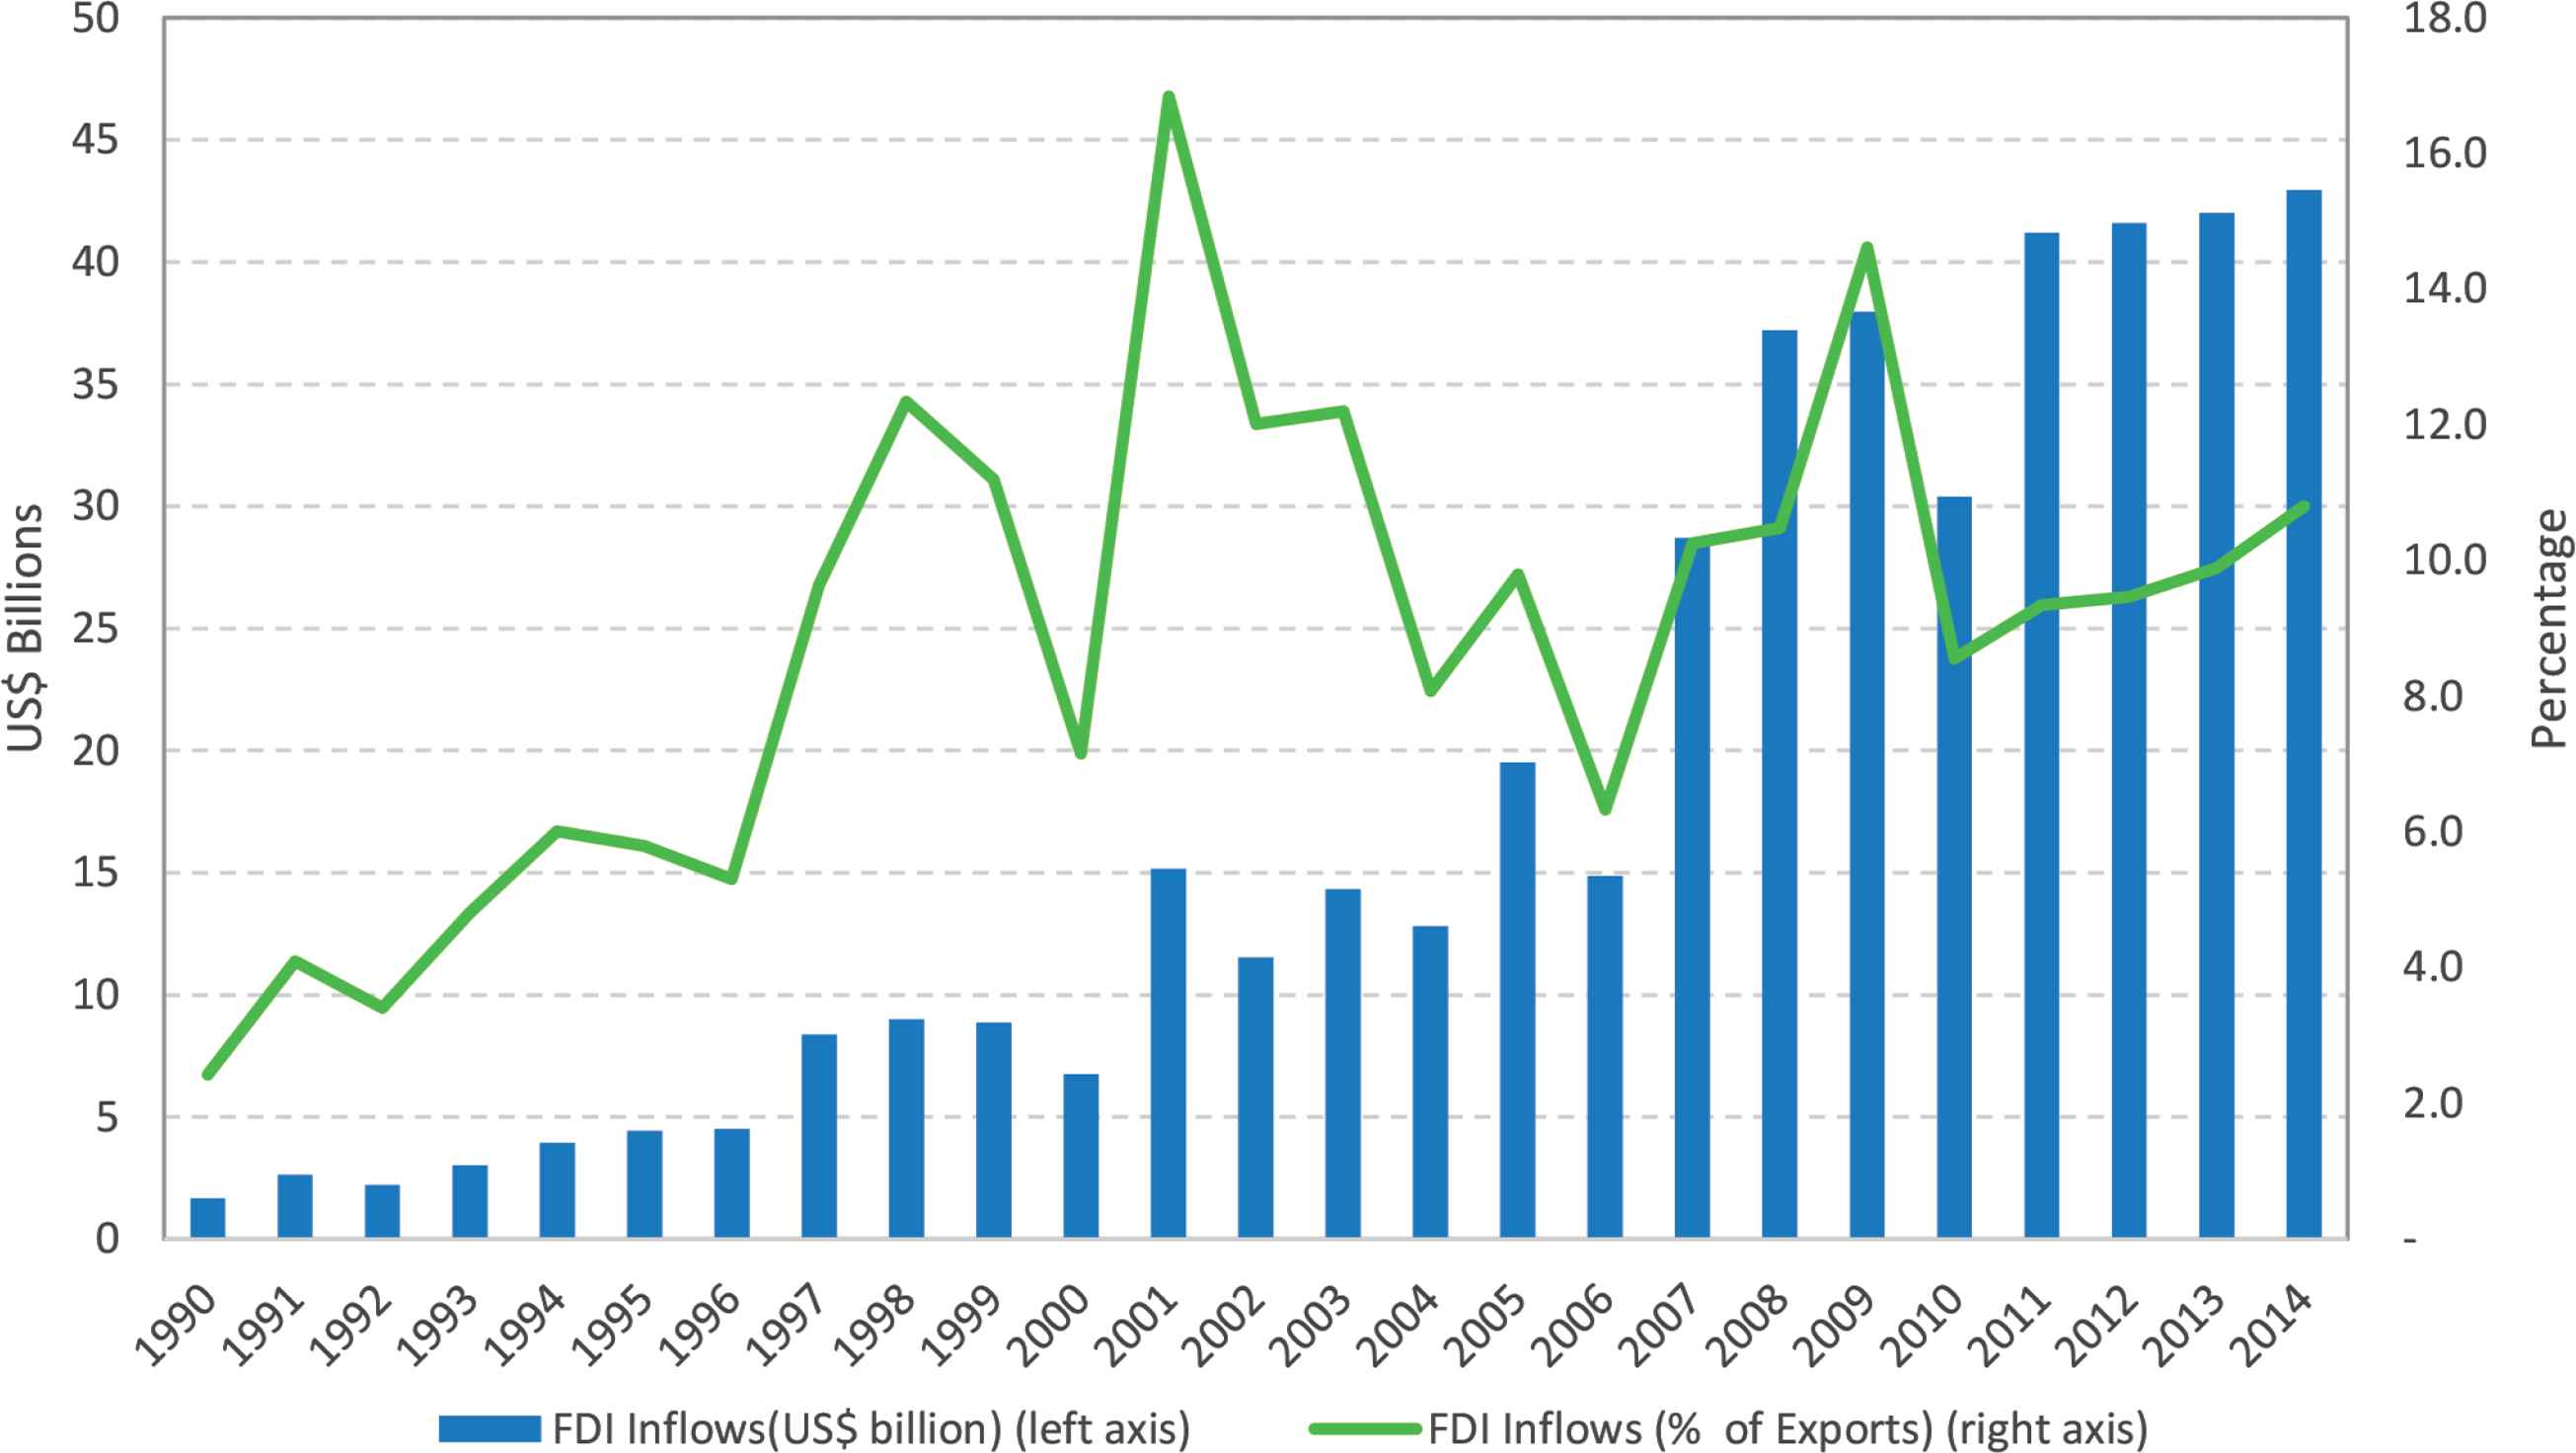
Foreign Direct Investment (FDI) inflows to Sub-Saharan Africa (US$ billion) and as a percentage of total exports, 1990–2014. Source: UNCTAD (2016).
Table 1 shows that during the 1991–2014 period, the regional share of the top 10 FDI recipients reached a peak of 84% between 1996 and 2000, before decreasing to 73% over the 2011–2014 period. This possibly reflects the general constriction in the global economy during that period. South Africa and Nigeria have accounted for more than 50% of total inward FDI stock to SSA between 1991 and 2010, although it marginally declined to 48% between 2011 and 2014. Table 1 also reveals that a large share of FDI inward stock to countries in SSA has been received in resource-endowed countries such as Nigeria, South Africa, and Angola for the greater part of the period between 1991 and 2014. Furthermore, Table 1 shows that the distribution of FDI inflows to the SSA region has not evened out over the years, with only 18 of the 49 SSA countries making it to the top 10 FDI recipients between 1991 and 2014. At least 70% of the major FDI recipients for each 5-year period from 1991 to 2005 consistently remained in the top 10.2
| 1991–1995 | 1996–2000 | 2001–2005 | 2006–2010 | 2011–2014 | |||||
|---|---|---|---|---|---|---|---|---|---|
| Country | % | Country | % | Country | % | Country | % | Country | % |
| Nigeria | 27 | South Africa | 34 | South Africa | 39 | South Africa | 43 | South Africa | 32 |
| South Africa | 25 | Nigeria | 26 | Nigeria | 18 | Nigeria | 15 | Nigeria | 16 |
| Zambia | 6 | Angola | 6 | Angola | 9 | Angola | 6 | Mozambique | 4 |
| Liberia | 6 | Zambia | 4 | Côte d’Ivoire | 3 | Sudan | 4 | Ghana | 4 |
| Angola | 5 | Liberia | 4 | Sudan | 3 | Ghana | 2 | Sudan | 4 |
| Namibia | 4 | Côte d’Ivoire | 2 | Zambia | 3 | Equatorial Guinea | 2 | Tanzania | 3 |
| Côte d’Ivoire | 3 | Tanzania | 2 | Cameroon | 2 | Côte d’Ivoire | 2 | Equatorial Guinea | 3 |
| Botswana | 2 | Namibia | 2 | Equatorial Guinea | 2 | Congo | 2 | Congo | 3 |
| Gabon | 2 | Congo | 2 | Liberia | 2 | Zambia | 2 | Angola | 2 |
| Cameroon | 2 | Cameroon | 2 | Tanzania | 2 | Tanzania | 2 | Zambia | 2 |
| Total contribution | 82 | 84 | 83 | 80 | 73 | ||||
Source: Authors’ calculations using the UNCTAD (2016) FDI database. FDI, foreign direct investment; SSA, Sub-Saharan Africa.
Distribution of FDI inward stock of top 10 countries in SSA: 1991–2014 (% of total SSA FDI inward stock)
2.2. Export Structure and Competitiveness
Total exports from SSA countries have increased considerably over the years, from US$11 billion in 1970 to US$94 billion in 2010, before surging to US$285 billion in 2015 (UNCTAD, 2016).3 Countries from SSA experienced strongest growth of exports (17.4%) between 2001 and 2010, largely benefiting from the commodity super cycle during this period. However, the share of merchandise exports from SSA countries in the world has been decreasing steadily from 3.6% in 1970 to 1.7% in 2015. By contrast, UNCTAD (2016) data show that shares of exports from Asia, especially China and India, have been on the surge. Because the export shares are relative to global shares, the decline in exports from SSA countries could reflect the increases in shares in Asia. By 2008, SSA countries captured the smallest share of world exports of any region, exporting just US$200 billion worth of goods to international markets.
The region’s composition of merchandise exports could partly account for the small share of exports in global exports. Economies from SSA heavily depend on primary commodities as a source of export earnings which makes them vulnerable to supply shocks and fluctuations of commodity prices. Figure 2 shows that 81% of exports from SSA to the European Union were in nonprocessed primary products and raw materials (excluding energy products). Progress in moving to manufactures has been slow in SSA countries; from about 4% in 1980, to 15% in 1990, to 19% in 2015. The growth of exports to the developing world, particularly over the past two decades, can be explained by the expansion of South–South trade. Since 2000, the overall growth of exports from SSA countries to China, Brazil, and India, and to countries in the region, has surpassed that to developed markets. It is interesting to note that SSA countries’ largest market for manufactured goods is Africa (Figure 2). Exports from SSA remain fairly concentrated on a few products compared with other regions. In 2014, SSA (excluding South Africa) recorded a concentration index of 0.52, up from 0.34 in 1995, compared with the world average of 0.08 and 0.12 for developing countries in 2014.4

Structure of Sub-Saharan Africa exports (averages): 1995–2015. EU, European Union. Source: UNCTAD Trade Statistics. Primary Commodities excluding energy products: Standard International Trade Classification (SITC) 0, 1, 2, 4, 68; Energy Products: SITC 3; Manufactured Products: SITC 5–8 less 667 and 68.
With respect to export competitiveness, Figure 3 shows an improvement in Expy between 1995 and 2014, with a moderate increase between 1995 and 2012 and a slide in 2013/2014 (see below for the exact definition and computation of Expy). The moderate increase in Expy indicates an overall improvement in the technological sophistication level of exports from SSA over the period. Relative to FDI inflows, Figure 3 indicates that exports from SSA maintained an overall improvement in competitiveness despite the fluctuations in FDI inflows over the period 1995–2014.
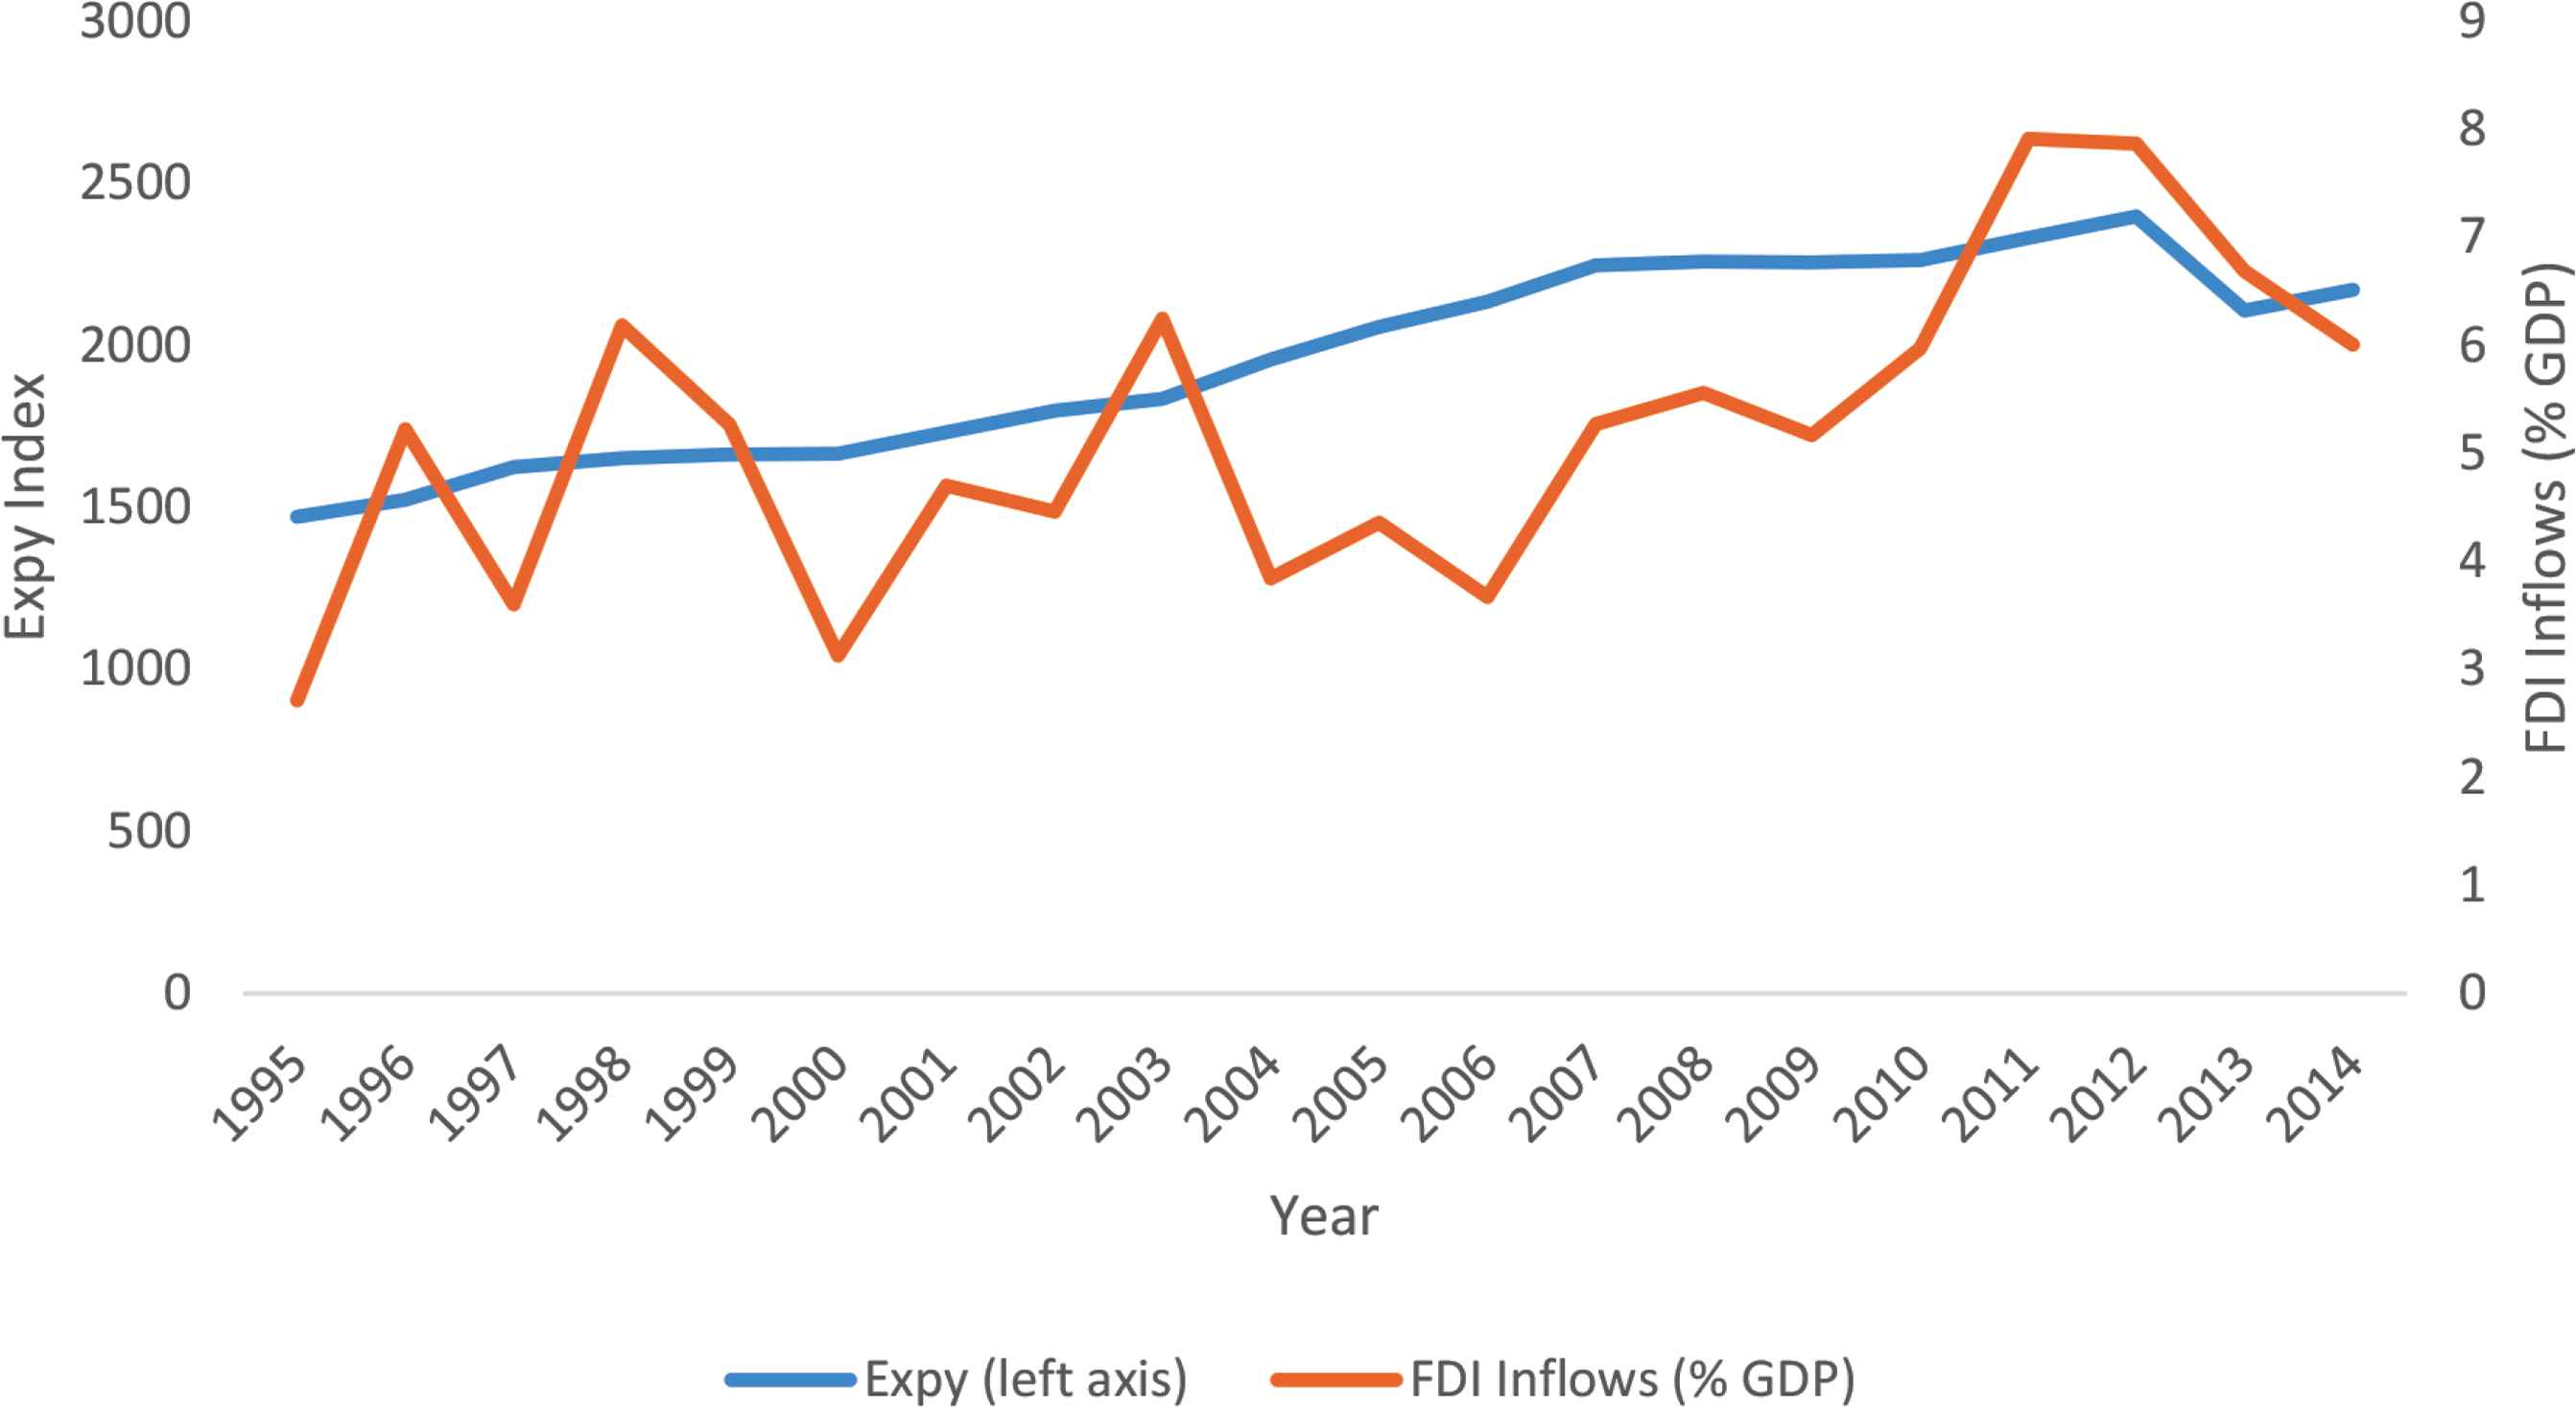
Export competitiveness (Expy) and Foreign Direct Investment (FDI) inflows in Sub-Saharan Africa (1995–2014). Source: Authors’ calculations using the UNCTAD Export Database 2016. GDP, gross domestic product.
At the country level, Angola, Nigeria, and Kenya display higher Expy indices above 2015 points, which reflect their capital intensity and embodiment of technology content and higher per capita incomes (Figure S1 in the Supplementary material online). Mauritania, Central Africa Republic, and Mozambique have lower values of Expy, reflecting the low technology content of their main exports which are mainly primary commodities with low Prody values.5 There are notable declines in the Expy indices for Liberia, Guinea Bissau, Mauritania, and Mozambique around 2000–2005, suggesting declining export competitiveness during this period. The correlation matrix in (Table S4 Supplementary material online) shows a positive correlation between Expy and FDI, possibly suggesting that FDI could be playing an important role in enhancing export competitiveness. Export sophistication is also positively correlated with GDP growth, human capital, and technological progress. By contrast, Expy is negatively correlated with unit labor cost, as expected.
3. REVIEW OF THE LITERATURE
3.1. Theoretical Literature
Different scholars have defined export competitiveness differently. Sharples and Milham (1990) considered export competitiveness as the ability of a country to produce and sell goods in qualities required by foreign buyers, and at prices equal to or better than those of other potential suppliers.6 Lotfi and Karim (2016) viewed export competitiveness from a globalization perspective, as the ability of countries to successfully integrate into the global economy. FDI can affect export competitiveness through several channels. These may include enhancing productivity and efficiency through technology diffusion and knowledge spillovers, augmenting domestic capital, introduction of new export products, and facilitating access to new and large foreign markets.
Early trade theories explain export competitiveness with respect to comparative cost advantages or price competitiveness and underscore relative labor productivity and factor endowments as the key determinants of cost differentials across nations. Ricardo (1817), in his classical trade theory, argues that a country has a comparative advantage in trade if it can produce a good at a lower relative cost than its trade partners. Ricardo stresses that relative labor productivity differentials are the basis of differences in production costs. An extension of the Ricardo model, the Heckscher–Ohlin model posits that differences in relative factor endowments are the basis of cost differentials instead. Unlike early theories, proponents of the neotechnology trade theory emphasized the role of innovation in conferring cost advantages on the innovating nation. In this case, differences in levels of innovation and technologies become the basis of cost differentials and hence a crucial determinant of international trade. Posner (1961) and Vernon (1966) predicted that technologically advanced nations export newer products and import standardized ones.
Romer (1990) proposed a model which shows that productivity growth is driven largely by technological change that arises from intentional investment decisions made by profit-maximizing agents. This technology is labor augmenting, and increases with research and development, providing incentives for continued capital accumulation. Together, they account for much of the increase in output per worker (labor productivity), which is important for strengthening the competitiveness of the tradable sectors. Building on Romer’s model, Grossman and Helpman (1991) showed that the interaction between the processes of research and development and innovation in the industrialized and low-income countries, through FDI, facilitates the transfer of technology, which could enhance productivity. They also contended that the process of economic development is one in which firms are required to continuously upgrade their production to produce more advanced products.
Borensztein et al. (1998) argued that higher productivity of FDI holds only when the host country has a minimum threshold stock of human capital to absorb the advanced technologies. FDI helps to accelerate human capital development as Multinational Enterprises (MNEs) often bring along training of workers, technical assistance, interactions, and managerial capacity building. This conjecture is supported by Wang (1990), whose model showed that technological progress improves productivity and competitiveness of capital goods introduced by MNEs.
The literature on technology diffusion highlights the role of FDI in technological progress in developing countries. For instance, Findlay (1978) postulated that FDI increases the rate of technical progress in the host country through spillovers from the more advanced technologies used by the foreign firms. Technology diffusion involves the transmission of ideas and new technologies through either vertical or horizontal spillovers, at the country, sector (industry), or firm level. Vertical spillovers arise if local firms benefit from interaction with foreign firms up- or down-stream in the production chain. These can be backward spillovers (e.g., a foreign firm intentionally assists local subsuppliers to deliver high-quality inputs and shares with them superior technology) or forward spillovers (e.g., higher quality inputs produced by foreign firms used in the production chain by the local firms).
Markusen and Venables (1999) showed that strengthening the supply industries may benefit the domestic producers in the MNEs, through forward linkages, and that this positive side effect can be stronger than the competition effect in the tradable sector. Zhang (2001) asserted that FDI provides competitive assets for export-oriented production and the transfer of such assets through forward spillovers, for example, training, as well as skills and knowledge diffusion, enhances operational efficiency and productivity. Horizontal spillovers arise because of the interaction of plant-level activities and firm-specific activities (research and development), marketing, managerial and skills transfers, demonstrations, industry best practices, technical audits, etc. Moran (2005) showed that parent companies often monitor their local affiliates and ensure that they maintain the best technology, management practices, and quality control systems so that they remain competitive in the international markets. As FDI often targets export sectors, provision of the best technology and the necessary support and controls enhances the competitiveness of their export products.
Export competitiveness can also be enhanced by improving access to world markets for local exporters. Through a model which was tested using Indonesian manufacturing data, Blalock and Gertler (2008) showed that FDI has a strong effect in augmenting supplier’s productivity. They also found that technology transfer to local firms lowers prices, increases output, raises profitability, and increases access to markets. By providing the export distribution networks and the information needed to enter foreign markets, FDI can establish a niche for domestic firms to export (Markusen and Venables, 1999).
Harrison and Aitken (1999) proposed the market-stealing hypothesis, which postulates that the presence of MNEs may have two opposing effects on domestic firms operating in the same industry. On the one hand, knowledge transfer may be taking place as local producers observe technologies and marketing techniques used by foreigners or hired workers trained by multinationals, and in this way increase their own productivity. On the other hand, if domestic firms fail to adopt the new efficient production methods, foreign firms entering the same industry may take the market share away from local companies, crowd them out, and reduce their ability to operate at an economically efficient scale. The market stealing effect arises because the entry of foreign firms decreases the productivity in domestic firms by forcing them to cut production or to reduce prices which may result in the displacement of local firms. The negative effect is likely to be prominent in the interindustry context because foreign and local firms compete directly as suppliers of foreign-owned entrants.
Foreign direct investments may create potential Dutch disease effects, which affects competitiveness of other tradable sectors. As foreign capitals may target tradable sectors, they may generate Dutch disease effects, as large capital inflows lead to the appreciation of the real exchange rate, which may reduce competitiveness of manufacturing sectors (Sachs and Warner, 1997; Botta et al., 2015). It is also possible that in the long run, balance of payments position of the host economy may be affected. Once the initial investment starts to turn profitable, profits will be repatriated back to foreign investors, affecting the capital account and worsening the balance of payments. In some African countries, increased foreign ownership has sometimes raised nationalist sentiments and concerns over increased foreign business ownership and control of the economy and political influences by foreigners (Moss et al., 2004). This has often led to restrictions on foreign investments, for example, through nationalizations, expropriations, ownership restrictions, rate of return restrictions, project approval requirements, as well as trade and financial restrictions.
3.2. Empirical Studies
A larger proportion of empirical literature on FDI concentrates on its impact on economic growth or export volumes, rather than export competitiveness per se. A few empirical studies have analyzed the impact of FDI on export competitiveness, with the majority of these studies focusing on the impact of FDI on productivity, and implicitly on export competitiveness. Blomström and Kokko (1996) found that global companies played an important role in export growth and competitiveness in their host countries. They contend that FDI improves productivity and competitiveness of manufacturing firms, as local firms enter strategic alliances with leading foreign MNEs to expand their technology bases. Moran (1998) suggested that increased competitiveness and efficiency in the Mexican automobile export industry was a result of increased FDI in the sector. Similarly, Prasanna (2010) found that FDI inflows in India led to significant increases in export competitiveness, proxied by total and high technology-manufactured exports.
Using firm-level data, Liu (2008) showed a positive effect of FDI on firm productivity and export competitiveness in China. Similarly, Zhang (2006) estimated a log-linear model of the FDI–export linkage for 186 industries in China and showed that FDI has a predominant influence on China’s export performance and its effects are much larger than that of domestic capital. In another study, Zhang (2015) analyzed the role of FDI on industrial competitiveness in a large-panel data set of 21 manufacturing sectors for 31 regions in China from 2005 to 2010. The study finds that FDI has larger positive effects on China’s low-tech manufacturing than on medium and high-tech industries, which are proxies for export competitiveness. In this case, the contribution of FDI is enhanced by its interaction with local human capital.
Empirical literature on export productivity identifies a strong positive influence of FDI on export productivity through technological diffusion and spillovers. Using Indonesian manufacturing data, Blalock and Gertler (2008) found that FDI has a strong effect in augmenting supplier’s productivity. Similarly, Javorcik (2004) tested for productivity spillovers through backward and forward linkages using Lithuanian firm-level panel data. The analysis confirms the presence of productivity spillovers taking place through backward linkages, suggesting that FDI enhances firm productivity. In a study of Zambian firms, Bwalya (2006) found little evidence in support of intraindustry productivity spillovers, but significant interindustry knowledge spillovers, which occur through linkages. Greenaway et al. (2004) analyzed UK firm-level data and confirmed positive spillover effects from MNEs on the decision of UK-owned firms to export, as well as on their export propensity. The study confirms that FDI significantly increases the probability of exporting for domestically owned firms operating in the same industry. Lipsey and Sjöholm (2001) found statistically significant industry spillovers which are highest in industries with vigorous competition.
Other studies emphasize trade policy regimes and ownership structure of exporting firms. For instance, Balasubramanyam et al. (1996) used cross-sectional data from 46 developing economies and found that growth-enhancing effects of FDI are stronger in countries that pursue a policy of export promotion rather than import substitution. This result suggests that the trade policy regime is an important determinant of the effects of FDI. Rădulescu and Şerbănescu (2012) showed that FDI in the tradable sector is associated with higher exports in Central and Eastern European countries from 1990 to 2010. Mijiyawa (2016) used data on African countries to test the FDI–exports linkage and found that higher FDI inflows positively and significantly influence exports of goods and services. The study also showed that a large part of the FDI effect is driven by its spillover effects on exports.
The literature reviewed suggests that, to a greater extent, the effects of FDI on a country’s competitiveness largely depends on factor endowments; innovation; research and development capacity that drives technological progress and hence productivity; level of human capital; technological diffusion and spillovers; and government policies promoting linkages between domestic and foreign firms. While the theoretical literature reviewed earlier endorses FDI as a driver of export competitiveness, the empirical literature does not present clear evidence of the FDI effects in SSA countries. Furthermore, what is less well understood is the precise channels through which FDI affects export competitiveness in SSA countries.
4. METHODOLOGY
4.1. Theoretical Framework
The theoretical literature reviewed earlier provides the framework from which we draw the hypothesis that FDI affects export competitiveness. From the trade paradigms, the role of FDI on export competitiveness is deduced through its effects on the key determinants of cost differentials (relative labor productivity, factor endowments, technology, and innovation). FDI affects labor productivity through knowledge transfers as domestic firms adopt better technical and management skills of MNEs and gains from local workforce trained by MNEs. By augmenting domestic capital, FDI enhances capital productivity and contributes to the introduction of new export products, and facilitates access to new and large foreign markets. FDI increases the rate of technological progress in the host countries through research and development as well as vertical and horizontal spillovers from the more advanced technologies used by MNEs. As such, FDI indirectly enhances export productivity and competitiveness. External forces such as macroeconomic environment, demand, suppliers, institutions, as well as the government are crucial enablers of firms, and hence product competitiveness.
A simple theoretical model of export competitiveness as a function of FDI and other determinants as reviewed in the literature is specified as follows:
4.2. Empirical Model
To test the hypothesis that FDI affects export competitiveness, we employed the S-GMM methodology for dynamic panel data model, proposed by Arellano and Bond (1991) and Blundell and Bond (1998). This method allows controlling for unobserved variables as well as potential endogeneity of explanatory variables. The GMM procedure also gains efficiency by exploiting additional moment restrictions and uses all available lagged values of the dependent variables and lagged values of the exogenous regressors as instruments.
We consider the following model:
Yit−1 is correlated with the country-specific effects ηi. As such, the ordinary least squares estimator is biased and inconsistent. A common issue that arises when estimating model (2) is whether to treat the unobservable country-specific effect ηi as ‘fixed’ or as ‘random’ parameter. The random effects model assumes that the individual-specific effects are uncorrelated with the independent variables, whereas the fixed effects assumption considers individual-specific effects to be correlated with the independent variables. As T → ∞, the random effects estimator is biased and inconsistent, rendering the model no longer robust to estimate the determinants of export competitiveness, while the fixed effects estimator becomes consistent. The fixed effects control for the unobserved country-specific time-invariant effects in the data and correct for the possible correlation between these effects and some of the independent variables, conditioning them out by taking deviations from time-averaged sample means (Doytch and Uctum, 2011). To eliminate country-specific effects, we take first differences of Equation (2).
This eliminates the potential bias associated with unobserved fixed country effects. However, the transformed error term, εit – εit−1, is correlated with the transformed lagged dependent variable Yit−1 – Yit−2. Thus, the true underlying structure has a dynamic nature and time-averaging cross-section techniques introduce a bias that cannot be removed by controlling for fixed effects. Instruments are required to deal with this problem. Thus, we stress the need to use GMM methodologies for dynamic panel estimation. These are the dynamic panel GMM estimators, such as Arellano and Bond (1991) Difference GMM (D-GMM) and the Blundell and Bond (1998) system GMM, which are specifically designed to capture the joint endogeneity of some explanatory variables through the creation of a matrix of ‘internal’ instruments and deal with the correlation between lagged dependent variable and the error term. The Arellano and Bond (1991) D-GMM dynamic panel estimator uses lagged-level observations as instruments for differenced variables. It uses the following moment conditions:
The use of instruments allows the parameters to be consistently estimated, while solving the problem of the measurement errors in the right-hand side variables and taking care of the omitted variable problem, thus resulting in unbiased parameter estimates.
Blundell and Bond (1998) showed that when the series are persistent (high value of α), the instruments for the first difference panel model may be weak and may fail to identify the parameters of interest. This is because they affect the asymptotic and small sample performance of the difference estimator, raise the variance of the estimator, and can bias the coefficients. To deal with this weakness, they proposed combining the equation in first differences with the equation in levels to form a system estimator, which can perform better in terms of finite sample bias and precision of the estimates. The additional assumption in this system estimator is that the first-differences Δxit are uncorrelated with the unobserved individual effects ηi. In this case lagged values of Δyi and Δxit can be used as instrumental variables in the levels equation. Hence, the following additional moment conditions are used:
The system estimator combines the first difference Equation (3) and the levels Equation (2) using the initial moment conditions for the first difference models (4 and 5) and additional moment conditions (6) and (7) to generate consistent and efficient parameter estimates.
The estimation of Equation (3) could encounter endogeneity and simultaneity bias. This could arise from the fact that, while FDI can affect export competitiveness, competitiveness of the export sector can also help to attract FDI—the possibility of reverse causality. Furthermore, it is possible that an unobserved factor may affect both FDI and export competitiveness, as well as other variables such as human capital, productivity, domestic private investment, and import of capital goods. In this case, FDI, export competitiveness, and other variables can be potentially endogenous. The GMM approach addresses possible endogeneity, autocorrelation, and simultaneity bias by exploiting properly the within and between variations in the data (Arellano and Bond, 1991; Blundell and Bond, 1998; Sakyi and Egyir, 2017). Arellano and Bond (1991) noted that if the error term is found to be nonpersistent, a standard GMM will be both consistent and efficient. Both lagged levels and lagged differenced observations are used as instruments in estimating parameters of the export competitiveness equation. Heteroscedasticity-consistent standard errors (robust) are considered to deal with possible heteroscedasticity in the regressions.
The consistency of the GMM estimator depends on the validity of the instruments as well as on the assumption that the error term does not exhibit any serial correlation. To address these issues, we consider two specification tests suggested by Arellano and Bond (1991), Arellano and Bover (1995), and Blundell and Bond (1998). The first is a Sargan test of over-identifying restrictions, which tests the overall validity of the instruments by analyzing the sample analog of the moment conditions used in the estimation process. The null hypothesis relates to instrument validity and failure to reject this null hypothesis means that the instruments are valid. The second test examines the hypothesis that the error term εit is not serially correlated. This test is essentially implemented to test for second-order serial correlation in the first-differenced residuals. The null hypothesis is that the residuals are serially uncorrelated. The acceptance of the null hypothesis shows that there is no second-order serial correlation and the GMM estimator is consistent.8
The baseline estimations are based on the system GMM. However, we also estimate the D-GMM as an alternative for comparative purposes as a robustness test, despite the possibility of weak instruments. We estimate the models using the Stata 13 (Stata Statistical Software: Release 13, StataCorp LP, College Station, TX, USA) econometric package.
4.3. Data and Variables
This study uses annual time series data of 43 SSA countries for the period 1995 to 2015. The choice of the study period is based on the availability of data on key variables such as trade and macroeconomic data. A list of countries in this study is presented in Table S1 (Supplementary material online). The summary statistics of the data are presented in Table S3 (Supplementary material online).
4.3.1. Export competitiveness
The dependent variable is export competitiveness (XC), which is proxied by the export sophistication index (Expy) proposed by Hausmann et al. (2007). In this case, export competitiveness is described by considering the productivity level associated with a country’s exports. Porter et al. (2008) noted that a country’s competitiveness is the foundation of the economy’s prosperity, and a nation’s prosperity in turn is determined by its productivity, which influences its ability to sell goods and services abroad.9
To calculate the Expy, a Prody index must be constructed first. Prody for product k in country i is calculated as:
Then, the Expy which measures the income or productivity level of country i’s export basket is calculated as follows:
The Expy of a country is thus the weighted average of the Prodys for that country, where the weights are the value shares of the products in the country’s total exports. Value weighting the Prodys of the entire export basket of country i gives the overall productivity/sophistication of its exports. This implies that the level of sophistication of a product is linked to incomes of countries that export the product. As such, when a poor country manages to export products similar to those exported by rich countries, then its Expy score increases, and competes better on the world markets. Trade data in SITC 4-digit level, which are used to construct the export competitiveness variables (Prody and Expy), are obtained from the United Nations Conference on Trade and Development (UNCTAD) 2016 database.11 Data for GDP per capita are obtained from the World Bank’s World Development Indicators.
The RCA and export value index are used as alternative measures of export competitiveness.12 The RCA index measures the comparative advantage of a nation from its past trade/export data and is calculated as a commodity’s share in the country’s total exports relative to its share in world exports:
Several studies in the literature have measured competitiveness with reference to price/cost competitiveness including relative prices of a country’s tradables to competing foreign tradables. The export value index measures the average value changes of different units of exports. The changes in value indices may be influenced by changes in both the composition of clusters of exports and prices of individual exports. The export value index as a proxy of export competitiveness has been used in other studies (see, e.g., King, 1993; Gehlhar and Pick, 2002). Data for export value index are obtained from the UNCTAD (2016) database.
4.3.2. Foreign direct investment
Foreign direct investment is defined as an investment by a resident entity in one economy (foreign direct investor) of an enterprise resident in another economy (FDI enterprise). According to UNCTAD (2016), FDI inflows comprise capital-provided, reinvested earnings, and intracompany loans by a foreign direct investor to an FDI enterprise.14 The data on FDI flows are presented on net bases. In this study, we use inward FDI as a percentage of GDP as the main regressor. FDI is expected to have a positive effect on competitiveness of exports by increasing productivity and efficiency through technological transfers, spillovers, human capital development, and augmenting domestic productivity. FDI data are obtained from the UNCTAD (2016) database.
4.3.3. Other variables
Other variables that may determine the level of export competitiveness are also included in the empirical estimations. Domestic Private Investment (dpi) controls for private investment in the economy while technological progress (Techp) controls for differences in innovation and technology. To allow differentials in productivity that contribute to cost differentials across firms, we control for firm productivity (Prod) by including a proxy for labor productivity. Furthermore, we include a measure of unit labor costs (Ulc) to control for cost differentials in production that may affect production costs and hence competitiveness of output. We also control for the effects of global export demand (XD), share of imported capital goods in total imports (cgiti), foreign market access (fma), human capital (hc), as well as the level of economic and institutional development (Macro and Inst, respectively). A summary of these explanatory variables, as well as the expected relationships between these variables and export competitiveness is presented in Table S2 (Supplementary material online).15
5. EMPIRICAL RESULTS
5.1. Baseline Results
To test the assertion that FDI boosts export competitiveness, Expy is regressed on FDI, in the S-GMM framework, controlling for various explanatory variables. Table 2 presents the baseline results from estimating Equation (2).
| Dependent variables: lexpy | ||||
|---|---|---|---|---|
| (1) | (2) | (3) | (4) | |
| Lexpy_1 | 0.653* (0.045) | 0.635* (0.047) | 0.661* (0.057) | 0.572* (0.056) |
| FDI | 0.001** (0.004) | 0.001** (0.000) | 0.002*** (0.001) | 0.002*** (0.001) |
| Lhc | 0.282* (0.066) | 0.27* (0.065) | 0.162** (0.031) | 0.157* (0.036) |
| Techp | 0.010 (0.04) | 0.003 (0.043) | 0.009 (0.032) | 0.022 (0.037) |
| Lxd | 0.24* (0.07) | 0.1** (0.05) | 0.098*** (0.053) | |
| Macro | 0.002** (0.001) | 0.002*** (0.001) | 0.003** (0.001) | |
| Ulc | −0.001*** (0.001) | −0.001*** (0.001) | ||
| fma | −0.004** (0.002) | −0.001 (0.012) | ||
| Inst | 0.002* (0.000) | |||
| cons | 1.374* (0.213) | 1.632 (0.322) | 2.361* (0.370) | 2.45* (0.375) |
| Wald Chi2a | 890.5* | 1025.63* | 708.9* | 558.04* |
| AR(1) (p-value)b | 0.001 | 0.004 | 0.005 | 0.006 |
| AR(2) (p-value)c | 0.326 | 0.310 | 0.194 | 0.197 |
| Sargan (p-value)d | 0.098 | 0.145 | 0.194 | 0.301 |
p < 0.01.
p < 0.05.
p < 0.1.
Wald statistic: H0: all coefficients are zero.
AR(1) and AR(2) tests for first- and second-order autocorrelation; H0, no autocorrelation of residuals.
Sargan test: H0, over-identifying restrictions; are valid/instruments not correlated with residuals.
Number of countries = 43. Robust standard errors in parentheses. GMM, generalized method of moments; SSA, Sub-Saharan Africa.
Export competitiveness and foreign direct investment in SSA: dynamic systems GMM estimation results
The regressions were done in a stepwise fashion from model (1) to model (4), where more variables were added at each stage. Model (4) is the complete baseline model. The results show that all coefficients exhibit expected signs and are statistically significant, except for technological progress and foreign market access which are not significant.
The results show that export competitiveness improves in host countries as more FDI flows in. Intuitively, high FDI inflows to a country translate to high trade-weighted income (Prody) for that country for a particular product (as the country’s GDP increases), which in turn improves the overall competitiveness of its entire exports. The results are in line with Hailu (2010), who argues that exports by FDI-financed firms in Africa are more competitive internationally mainly because these firms have a comparative advantage in their knowledge of international markets. Furthermore, UNCTAD (2002) shows that FDI inflows into Singapore and China have helped to increase the technological content and hence competitiveness of exports. Similar findings were reported by Rodrik (2006), who observed positive effects of FDI on Chinese export sophistication. Zhu and Fu (2013) also found that FDI has a positive impact on export sophistication in a sample of 171 countries across the world.
The coefficient on the one-period-lagged export competitiveness (Lexpy_1) is positive and significant in all of the regressions. The lagged measure of export competitiveness measures the speed of mean reversion, that is, the speed at which the dependent variable returns to its equilibrium after a shock. Values of the coefficient close to zero indicate that a change will persist for longer, whereas those closer to 1 show that the change will not persist. Thus, the positive and significant coefficient on Lexpy_1 of 0.65 suggests a positive impact of past competitiveness on current competitiveness with some persistence. The results are consistent with the assertion that previous trends have a direct bearing in future supply capacity and performance of exports. Fugazza (2004) found that improved supply capacity has been the driving force of export performance of some successful Asian countries compared with African countries.
Human capital also exhibits a positive effect on Expy, suggesting that it plays an important role in enhancing export competitiveness. Human capital enhances the transfer of knowledge and technical skills to the host economy, which in turn enhances competitiveness. The results are consistent with the theoretical assertion by Borensztein et al. (1998) on the role of education and training in driving productivity. Similarly, the coefficient on export demand is positive and highly significant in all regressions. This suggests that as the demand for exports increase globally, countries compete to meet this demand and in so doing thrive to offer the best products that compete on the international markets. As such, increased export demand is associated with exports that are more sophisticated.
The results in Table 2 also confirm the importance of macroeconomic stability and good institutions in enhancing the sophistication of exports in SSA. The coefficients for both macroeconomic environment and institutional quality are positive and significant at the 5% level in almost all specifications. UNCTAD (2005) finds that good institutional quality is an essential competitiveness ingredient because such institutions guarantee better protection of property rights, and provide more efficient regulation and administration.
Technological progress has a positive impact on export competitiveness as expected. However, the effect is not statistically significant. Wang and Wang (2015) also find that the contribution of FDI inflows to technology upgrading is relatively limited for Chinese manufacturing firms. The results seem to concur with the argument that although MNEs bring cutting-edge technology into host economies, which can enhance export productivity, their impact in SSA appears to be limited. Similarly, the result on foreign market access suggests a negative, albeit insignificant, relationship with export competitiveness.
Table 2 also reports diagnostic tests results. The Wald tests for the different regressions report statistics that reject the null hypothesis of joint insignificance of parameters, confirming that the estimated models fit the data well. Furthermore, the tests for serial autocorrelation based on the Arellano and Bond (1991) tests reject the null hypothesis of no-first-order autocorrelation in first-differenced errors, but accept no-second-order serial correlation. This confirms that the moment conditions used to identify parameters are valid and the model estimates are reliable. The Sargan tests do not reject the null hypothesis of over-identifying restrictions, suggesting that the instruments are valid.
5.2. Investigating the Channels
To investigate the channels through which FDI affects export competitiveness, we interacted FDI with key variables that drive export competitiveness. We considered human capital, share of imports of capital goods in total imports, domestic private investment, and productivity. The results are shown in Table 3.
| Dependent variables: lexpy | ||||
|---|---|---|---|---|
| S-GMM (1) | S-GMM (2) | S-GMM (3) | S-GMM (4) | |
| Lexpy_1 | 0.402* (0.106) | 0.362* (0.084) | 0.317*** (0.124) | 0.399 (0.104) |
| FDI | −0.004** (0.003) | −0.004 (0.002) | 0.006* (0.002) | 0.001** (0.001) |
| lhc | 0.0008** (0.041) | 0.129* (0.047) | 0.064 (0.042) | 0.097*** (0.042) |
| techp | 0.01 (0.04) | 0.045 (0.048) | 0.029 (0.045) | 0.171 (0.041) |
| lxd | 0.157* (0.046) | 0.149* (0.042) | 0.18* (0.053) | 0.154*** (0.052) |
| macro | 0.002* (0.001) | 0.003*** (0.001) | 0.002** (0.001) | 0.002** (0.001) |
| ulc | −0.001*** (0.001) | −0.001 (0.001) | −0.001 (0.001) | −0.001 (0.001) |
| fma | −0.02 (0.02) | −0.002 (0.002) | −0.001 (0.002) | −0.0003 (0.002) |
| Inst | 0.001* (0.00) | 0.001* (0.00) | 0.001*** (0.003) | 0.001*** (0.001) |
| cgiti | 0.067 (0.112) | |||
| dpi | −0.001 (0.01) | |||
| Prod | 0.001 (0.001) | |||
| fdi_hc | 0.001*** (0.00) | |||
| fdi_cgiti | 0.02*** (0.01) | |||
| fdi_dpi | −0.0002* (0.00) | |||
| fdi_prod | 0.0001 (0.0000) | |||
| cons | 2.86* (0.379) | 2.64* (0.364) | 2.96* (0.545) | 2.451* (0.421) |
| Wald Chi2a | 893.29* | 611.46* | 702.88* | 753.30* |
| AR(1) (p-value)b | 0.014 | 0.008 | 0.030 | 0.042 |
| AR(2) (p-value)c | 0.173 | 0.178 | 0.549 | 0.342 |
| Sargan (p-value)d | 0.148 | 0.141 | 0.143 | 0.169 |
p < 0.01.
p < 0.1.
p < 0.05.
Wald statistic: H0, all coefficients are zero.
AR(1) and AR(2) tests for first- and second-order autocorrelation; H0, no autocorrelation of residuals.
Sargan test: H0, over-identifying restrictions; are valid/instruments not correlated with residuals.
Number of countries = 43. Robust standard errors in parentheses. GMM, generalized method of moments; SSA, Sub-Saharan Africa.
Interaction effects: system GMM (S-GMM)
The coefficient of the FDI interacted with human capital (fdi_hc) was positive and statistically significant, suggesting that human capital reinforces FDI in promoting export competitiveness.16 This confirms that spillover effects through human capital are an important channel through which FDI drives export competitiveness in SSA. This could occur through managerial capacity building, training, and skills development, which enhances knowledge diffusion and hence productivity and competitiveness. This result concurs with Zhang (2015) who showed that sufficient absorptive capacity for the advanced technologies brought in by MNEs, through provision of training for the local workforce for instance, enhances productivity and hence positively impacts on export technology deepening.
Next, we interacted FDI and the share of imported capital goods in total imports and created a variable fdi_cgiti.17 The coefficient on the interacted variable was positive and significant at 5%, signifying that FDI inflows to SSA promotes export competitiveness through forward linkages. The impact is strengthened by the existence of linkages between domestic and foreign firms. Farole and Winkler (2014) reported that the supply of intermediate and capital goods by foreign firms to local producers may increase due to incentives used to attract export-oriented FDI in SSA countries. In turn, these capital imports help to augment and enhance efficient domestic export production, and hence improve the sophistication levels of exports in the region. This is consistent with the view that technology that is embodied in capital goods can be transferred to the domestic economy through interactions, demonstrations, and technical assistance, which enhance productivity and competitiveness. Furthermore, Javorcik and Spatareanu (2005) and Gorodnichenko et al. (2014) reported significant forward linkages for Lithuania and for 17 emerging and transition market economies, respectively.
The complementarity effect of FDI on domestic investment was tested by interacting FDI and domestic private investment (fdi_dpi). The effect is negative and significant, suggesting that FDI may inhibit the expansion of domestic exporting firms. According to Zhang (2015), this may happen through increased competition and too much focus on cheap labor and raw materials by foreign firms, without developing host countries’ dynamic comparative advantages. This possibly confirms the market-stealing hypothesis, where foreign firms entering the export sector may increase competition and take some market share away from local companies, forcing them to spread fixed costs over a smaller production scale and negatively affecting their productivity and competitiveness. According to Agosin and Mayer (2000), FDI is more likely to crowd out domestic investment in sectors where there exist many domestic firms or where domestic firms already have access to the technology that the MNE brings into the country. Alfaro (2003) found that FDI flowing into primary sectors has negative effects on growth and productivity, positive effects in the manufacturing sectors, and ambiguous effects in service sectors. Arguably, this could be the case for countries in SSA, where primary commodity exports dominate total exports.18
We also tested the productivity channel by interacting FDI and productivity variable. In this case the presumption is that FDI enhances domestic supplier productivity. The coefficient of the interacted variable fdi_prod is positive. However, the coefficient is not statistically significant, suggesting that the impact is weak.
5.3. Robustness and Sensitivity Tests
5.3.1. Alternative estimation methods
Table 4 shows the results derived from the D-GMM as an alternative estimation method.
| Dependent variables: lexpy | |||||
|---|---|---|---|---|---|
| D-GMM (1) | D-GMM (2) | D-GMM (3) | D-GMM (4) | D-GMM (5) | |
| Lexpy_1 | 0.177* (0.088) | 0.528*** (0.081) | 0.533*** (0.080) | 0.59*** (0.021) | 0.257*** (0.081) |
| FDI | 0.001** (0.001) | 0.001** (0.004) | 0.001** (0.002) | 0.03** (0.001) | 0.001** (0.002) |
| lhc | 0.029 (0.048) | 0.157*** (0.060) | 0.149*** (0.048) | 0.06* (0.06) | 0.120* (0.050) |
| techp | 0.0037 (0.025) | 0.015 (0.027) | 0.022 (0.027) | 0.03 (0.002) | 0.016 (0.66) |
| lxd | 0.235*** (0.036) | 0.048** (0.058) | 0.049** (0.058) | 0.001** (0.035) | 0.05** (0.04) |
| Macro | 0.001 (0.001) | 0.001 (0.001) | 0.002** (0.001) | 0.001** (0.002) | 0.01 (0.01) |
| Ulc | −0.0001 (0.001) | 0.003 (0.001) | 0.001 (0.001) | 0.003 (0.001) | 0.002 (0.08) |
| fma | −0.0003 (0.002) | −0.002 (0.001) | −0.002 (0.001) | −0.002 (0.025) | 0.001 (0.001) |
| Inst | 0.001** (0.001) | 0.002*** (0.003) | 0.002*** (0.003) | 0.02* (0.002) | 0.002*** (0.001) |
| cgiti | 0.005 (0.025) | ||||
| dpi | −0.002 (0.001) | ||||
| Prod | 0.003 (0.003) | ||||
| fdi_hc | 0.09** (0.001) | ||||
| fdi_cgiti | 0.004** (0.002) | ||||
| fdi_dpi | −0.001** (0.001) | ||||
| fdi_prod | 0.001 (0.000) | ||||
| cons | 3.582*** (0.430) | 2.80*** (0.503) | 2.790*** (0.520) | 2.67*** (0.53) | 2.58*** (0.530) |
| Wald Chi2a | 503.40*** | 239*** | 231*** | 203*** | 329*** |
| AR(1) (p-value)b | 0.004 | 0.018 | 0.011 | 0.034 | 0.042 |
| AR(2) (p-value)c | 0.189 | 0.224 | 0.162 | 0.601 | 0.612 |
| Sargan (p-value)d | 0.147 | 0.12 | 0.11 | 0.14 | 0.12 |
p < 0.05.
p < 0.1.
p < 0.01.
Wald statistic: H0, all coefficients are zero.
AR(1) and AR(2) tests for first- and second-order autocorrelation; H0, no autocorrelation of residuals.
Sargan test: H0, over-identifying restrictions; are valid/instruments not correlated with residuals.
Number of countries = 43. Robust standard errors in parentheses. GMM, generalized method of moments; SSA, Sub-Saharan Africa.
Difference GMM (D-GMM)
The results for D-GMM in Table 4 confirm that FDI positively influences export competitiveness as in the baseline case. Also important for competitiveness is past competitiveness, export demand, and institutional quality. An increase in export demand raises export competitiveness, while the strong effect of institutional quality reflects the extent to which the cost of doing business and regulations matter for export competitiveness. The effect of human capital and GDP growth is positive but not significant, while unit labor cost and foreign market access have an insignificant effect. The interacted variables FDI and human capital and FDI and import of capital goods show positive influences on export competitiveness, as in the baseline case. FDI interacted with domestic private investment still exhibits a negative sign, continuing to show the possible competition effects of FDI on domestic firms. By contrast, FDI augments domestic productivity possibly through supply chains, although the impact is somewhat weak.
5.3.2. Alternative measures of competitiveness
We also test the sensitivity of the results to alternative measures of competitiveness used. In this case, we consider the RCA index, and the log of the export value index. The results are shown in Tables 5 and 6, which were obtained from systems GMM estimation.
| Dependent variables: RCA | |||||
|---|---|---|---|---|---|
| (1) | (2) | (3) | (4) | (5) | |
| RCA_1 | 0.377* (0.084) | 0.73* (0.064) | 0.739 (0.06) | 0.808* (0.068) | 0.078* (0.058) |
| FDI | 0.003** (0.004) | 0.014** (0.150) | 0.013** (0.07) | 0.023** (0.06) | 0.003 (0.003) |
| lhc | 0.01 (0.106) | −0.035 (0.107) | 0.115 (0.085) | 0.169* (0.09) | 0.17*** (0.07) |
| Techp | 0.311* (0.005) | 0.134*** (0.057) | 0.139*** (0.057) | 0.145*** (0.072) | 0.09 (0.069) |
| lxd | 0.437* (0.103) | 1.03* (1.152) | 1.04* (0.157) | 1.27* (0.179) | 0.099* (0.099) |
| Macro | 0.005** (0.003) | 0.005 (0.004) | 0.01 (0.04) | 0.010 (0.006) | 0.002 (0.002) |
| Ulc | −0.001 (0.002) | −0.003** (0.002) | −0.003** (0.002) | −0.004** (0.03) | −0.001 (0.001) |
| fma | 0.003 (0.004) | 0.007*** (0.003) | 0.006** (0.001) | 0.003 (0.004) | −0.001 (0.003) |
| Inst | 0.0003 (0.001) | 0.02** (0.002) | 0.001** (0.001) | 0.001 (0.001) | 0.003*** (0.001) |
| cgiti | 0.17 (0.16) | ||||
| dpi | −0.005 (0.001) | ||||
| Prod | 0.001* (0.002) | ||||
| fdi_hc | 0.001** (0.001) | 0.001 (0.001) | |||
| fdi_cgiti | 0.001** (0.02) | ||||
| fdi_dpi | 0.001 (0.001) | ||||
| fdi_prod | 0.001 (0.977) | ||||
| cons | 5.501* (1.26) | 0.7 (0.21) | 1.06*** (0.46) | 1.22* (0.46) | 1.323 (0.001) |
| Wald Chi2a | 521.71* | 752* | 699* | 799* | 923* |
| AR(1) (p-value)b | 0.002 | 0.005 | 0.002 | 0.003 | 0.005 |
| AR(2) (p-value)c | 0.790 | 0.594 | 0.734 | 0.582 | 0.634 |
| Sargan (p-value)d | 0.216 | 0.125 | 0.161 | 0.300 | 0.120 |
p < 0.01.
p < 0.1.
p < 0.05.
Wald statistic: H0, all coefficients are zero.
AR(1) and AR(2) tests for first- and second-order autocorrelation; H0, no autocorrelation of residuals.
Sargan test: H0, over-identifying restrictions; are valid/instruments are not correlated with residuals.
Number of countries = 43. Robust standard errors in parentheses. RCA, revealed comparative advantage.
Alternative measures of competitiveness: RCA
| Dependent variables: levi | |||||
|---|---|---|---|---|---|
| (1) | (2) | (3) | (4) | (5) | |
| Levi | 0.556* (0.041) | 0.927* (0.036) | 0.927 (0.038) | 0.923* (0.046) | 0.967* (0.034) |
| FDI | 0.008** (0.003) | 0.01*** (0.028) | 0.002*** (0.013) | 0.005*** (0.009) | 0.005 (0.005) |
| lhc | 0.243** (0.131) | 0.553* (0.207) | 0.503* (0.187) | 0.519** (0.236) | 0.420** (0.003) |
| Techp | 0.098 (0.113) | 0.188 (0.159) | 0.183 (0.166) | 0.286*** (0.154) | 0.053 (0.169) |
| lxd | 0.935* (0.095) | 1.733* (0.237) | 1.721* (0.232) | 1.572* (0.245) | 1.647* (0.227) |
| Macro | 0.010** (0.003) | 0.005*** (0.004) | 0.005 (0.004) | 0.003 (0.006) | 0.008** (0.003) |
| Ulc | 0.0002 (0.002) | 0.004*** (0.002) | 0.004 (0.003) | 0.002 (0.002) | 0.003 (0.002) |
| fma | −0.003 (0.004) | −0.002 (0.003) | −0.002 (0.003) | −0.002*** (0.003) | −0.004 (0.004) |
| Inst | 0.002*** (0.001) | 0.001 (0.001) | 0.001 (0.001) | 0.001 (0.002) | −0.001 (0.001) |
| cgiti | 0.597 (0.385) | ||||
| dpi | 0.002 (0.001) | ||||
| Prod | 0.0001** (0.0002) | ||||
| fdi_hc | 0.001*** (0.002) | ||||
| fdi_cgiti | 0.001*** (0.031) | ||||
| fdi_dpi | −0.001*** (0.003) | ||||
| fdi_prod | 0.001* (0.000) | ||||
| cons | −0.83** (0.906) | −2.41 (0.908) | −2.152** (0.807) | −2.162 (1.014) | −0.181 (0.649) |
| Wald Chi2a | 1206* | 598* | 647* | 844* | 438* |
| AR(1) (p-value)b | 0.002 | 0.002 | 0.002 | 0.038 | 0.043 |
| AR(2) (p-value)c | 0.810 | 0.778 | 0.642 | 0.651 | 0.674 |
| Sargan (p-value)d | 0.169 | 0.176 | 0.180 | 0.281 | 0.591 |
p < 0.01.
p < 0.05.
p < 0.1.
Wald statistic: H0, all coefficients are zero.
AR(1) and AR(2) tests for first- and second-order autocorrelation; H0, no autocorrelation of residuals.
Sargan test: H0, over-identifying restrictions; are valid/instruments are not correlated with residuals.
Number of countries = 43. Robust standard errors in parentheses.
Alternative measures of competitiveness: log export value index (levi)
The results for the RCA measure of competitiveness show that FDI still matters for export competitiveness. Other explanatory variables such as technological progress, export demand, and the macroeconomic environment are significant and bear the expected positive signs. Unit labor cost has a dampening effect on competitiveness, albeit with a weaker impact. The interacted variables confirm the significance of human capital and technological spillovers through the import of capital goods.
The results for the export value index (levi) also display a strong effect of human capital and export demand on export competitiveness. The main difference is on unit labor costs, which unexpectedly come with a positive sign, although it has an insignificant effect on export competitiveness. The positive impact of interacted FDI with human capital, import of capital goods, and productivity also confirms the human capital spillover effects and enhancement of domestic productivity as key channels through which FDI drives export competitiveness. On balance, the results of alternative measures of export competitiveness are consistent with the baseline model. The diagnostic tests suggest a good fit of the models, no problem of autocorrelation, and that the instruments used in the model are valid.
6. CONCLUSION
This paper analyzed the impact of FDI on export competitiveness in SSA. It enhances our understanding of the channels through which FDI affects export competitiveness. The study employed the systems GMM to test the hypothesis and considered the D-GMM for robustness checks. Expy, a measure of export sophistication, is used as the main measure of export competitiveness. Other alternative measures of competitiveness: the RCA index and export value index are used in the robustness tests.
The analysis shows that FDI has a positive and significant effect on export competitiveness, suggesting that FDI enhances export competitiveness. Human capital, export demand, macroeconomic environment, and institutional quality also matter for export competitiveness. The importance of human capital highlights the extent to which FDI depends on human capital and learning efforts in order to assimilate foreign technologies. Rising unit labor costs and reduced access to foreign markets reduce export competitiveness. The analysis showed that FDI largely affects export competitiveness through human capital, technological spillovers, especially forward linkages, and to a lesser extent enhancement of domestic productivity. The study also confirmed the possible competition and domination effects of FDI on export competitiveness, which works to crowd out local producers by foreign firms. The results were largely confirmed by robustness tests.
The findings from this study suggest that SSA countries need to build more human capacity to support technological transfer and strengthen economic linkages in order to benefit more from FDI. Policy reforms to improve the investment and business climate and the macroeconomic environment are critical in attracting FDI, which in turn enhances export competitiveness and economic growth.
CONFLICTS OF INTEREST
The authors declare they have no conflicts of interest.
AUTHORS’ CONTRIBUTION
The authors contributed equally to the article.
ACKNOWLEDGMENTS
The authors would like to thank the anonymous referees and seminar participants at the Quantum Global Research Lab (QGRL), Switzerland, for helpful comments.
SUPPLEMENTARY MATERIALS
Supplementary data related to this article can be found at
Footnotes
FDI is a non-debt creating capital flow.
These countries include Angola, Cote d’Ivoire, Cameroon, Liberia, Zambia, Nigeria, and South Africa.
Between 1990 and 2013 Kenya’s export volumes increased almost fourfold from about US$3 billion in 1990 to US$11 billion, Tanzania from about half a billion to US$8 billion, and Mauritius from US$1.7 billion to US$6 billion; whereas for the oil exporting economies, Nigeria’s export values increased over sixfold (from US$14 billion to US$97 billion) and Cote d’Ivoire’s fourfold (US$3 billion to US$12 billion).
Concentration is measured by the Herfindahl–Hirschman Index (Product HHI). This measures the degree of export product concentration for a given number of exported products (UNCTAD, 2016). An index value closer to 1 indicates that a country’s exports are highly concentrated on a few products whereas values closer to 0 reflect that exports are more homogeneously distributed across a range of products.
Prody is the trade weighted income for a country [see Equation (8)].
According to this definition, export competitiveness encompasses both quantitative and qualitative factors such as quality of exports, capacity for technological innovation, and degree of product specialization. However, these factors are difficult to measure in quantitative terms.
This model is generalized to reflect the equations that are estimated in the paper and applies to equations with interactive terms as well. This a common practice in literature [see, e.g., Busse and Groizard (2008)].
A potential problem with system GMM estimator can arise if the instruments are too many, leading to overfitting of the model (Roodman, 2009). We address this issue by restricting the number of lags to one in the estimation, following Doytch and Uctum (2011) and Labra and Torrecillas (2018).
The World Economic Forum (WEF) defines competitiveness as the set of institutions, policies, and factors that determine the level of productivity of a country.
Note that the numerator of the weight, Xik/X, is the value share of the commodity in the country’s overall export basket. The denominator of the weight, ΣXik/X aggregates the value shares across all countries exporting the good.
Primary commodities, precious stones, and non-monetary gold comprise SITC 0 + 1 + 2 + 3 + 4 + 68 + 667 + 971, whereas manufactured products comprise SITC 5–8 less 667 and 68.
The RCA is also known as the Balassa index [see Balassa (1965)].
However, some studies have noted that the index reports large indicators in situations where a product’s share in domestic exports is huge, whereas its share in world exports is very small (see, e.g., Sabonienė, 2009; Mlangeni, 2000).
FDI stock is the value of the share of capital and reserves (including retained profits) attributable to the parent enterprise, plus the net indebtedness of FDI enterprise to the parent enterprise, and is approximated by the accumulated values of past FDI flows.
In empirical estimations, variables are expressed in logarithms, except where a variable contains percentages or has negative values. This is done to reduce the risk of heteroscedasticity as the variances are standardized. To this effect, the prefix l is added to the name of those variables to indicate that they are in logarithms.
The coefficient of the constitutive term for human capital is also positive and significant.
However, the coefficient of the constitutive term, imports of capital goods (cgiti) is positive but not significant.
The composition of FDI may be a critical determinant of its effectiveness in driving export competitiveness. For example, the finding that FDI’s effect wanes with the level of domestic investment, for instance, may simply be reflecting that a less favorable FDI is undertaken. We did not have sectoral data in FDI to determine the most important component.
REFERENCES
Cite this article
TY  - JOUR
AU  - Gladys Gamariel
AU  - Seedwell Hove
PY  - 2019
DA  - 2019/11/30
TI  - Foreign Direct Investment and Export Competitiveness in Africa: Investigating the Channels
JO  - Journal of African Trade
SP  - 30
EP  - 46
VL  - 6
IS  - 1-2
SN  - 2214-8523
UR  - https://doi.org/10.2991/jat.k.191115.001
DO  - 10.2991/jat.k.191115.001
ID  - Gamariel2019
ER  -