
Regional Integration and Trade: The Case of the Common Market for Eastern and Southern Africa (COMESA) Free Trade Area

- DOI
- 10.2991/jat.k.210311.001How to use a DOI?
- Keywords
- COMESA; free trade area; trade; regional integration; gravity
- Abstract
This paper examines the factors influencing intra-Common Market for Eastern and Southern Africa (COMESA) trade by empirically investigating whether the Free Trade Area (FTA) contributed to trade growth from 1997 to 2015. Gravity models for exports and imports were estimated to identify the factors influencing intra-COMESA trade. The results show that the FTA has bolstered trade in the region. The results further reveal that the presence of other regional blocs, such as the Southern African Development Community and the European Union, positively influences trade in the region. Positive and significant Linder coefficients were found in both models, indicating that similar underlying factors currently influence the direction of exports and imports. Based on comparative advantages, countries export commodities with little or no value addition. They import differentiated goods, however, consisting mainly of processed materials of the products that they initially exported. Thus, the COMESA FTA benefits are not fully exploited and that export diversification and the development of viable value chains within and among its member countries would appear to be the best policy options. Lastly, the results indicate positive returns to better economic infrastructure. Specifically, the positive and significant coefficient of the transport variable for both exports and imports highlights the importance of good transport infrastructure for enhanced trade in the region. With increased distance, however, the results suggest that information and communications technology in the reporting country is effective at enhancing exports. As such, prioritising investments in transport and information and communications infrastructure is important for COMESA to improve its export performance.
- Copyright
- © 2021 African Export-Import Bank. Publishing services by Atlantis Press International B.V.
- Open Access
- This is an open access article distributed under the CC BY-NC 4.0 license (http://creativecommons.org/licenses/by-nc/4.0/).
1. INTRODUCTION
Regional integration has been extensively debated in the literature and is forcefully advocated for, as its benefits cannot be underrated. These benefits range from unified forces in trade negotiations to increasing market access with the goal of enhancing the productivity and economic development of member countries. Before the founding of the Common Market for Eastern and Southern Africa (COMESA), the efforts of individual countries to influence trade were ineffective due to their limited individual production structures and markets, as well as their low bargaining power in international markets (COMESA Brief, 1994). Its establishment in 1994 was expected to address these challenges by providing an enlarged economic space and market, alongside increased collective bargaining power in international markets. Specifically, the bloc focused on strengthening the member states to achieve sustainable economic growth through a balanced development of its markets and production structures, as well as the promotion of regional cooperation in the areas of trade, investment, macroeconomic policies, and peace and security (COMESA Treaty, 1993). The establishment of a Free Trade Area (FTA) in 2000 and a Customs Union (CU) in 2009 further liberated the economic space for trade by harmonizing and removing tariffs and non-tariff barriers. It is against this background that this paper investigates whether COMESA countries have benefited from the deeper economic integration in terms of net trade volume, particularly after the establishment of the FTA.
Currently, COMESA has 19 member states: Burundi, Comoros, Democratic Republic of the Congo, Djibouti, Egypt, Eritrea, Ethiopia, Kenya, Libya, Madagascar, Malawi, Mauritius, Rwanda, Seychelles, Sudan, Swaziland, Uganda, Zambia, and Zimbabwe. In 2000, nine1 COMESA member states established an FTA that allowed them to trade on a full duty and quota-free status for all COMESA-origin products, among others. Overall, total intra-COMESA exports registered an increase of 82.95% from $1.7 billion in 2000 to $9.96 billion in 2013. According to a study done by COMESA, this was largely due to the establishment of the FTA in 2000 (COMESA, 2012). However, intra-COMESA exports as a percentage of its total exports have continued to lag behind exports to the Southern African Development Community (SADC) and the European Union (EU) in the same period, by 1.6% and 36.3%, respectively (Table 1). While intra-COMESA exports have been growing at an annual average of 16.7% since the establishment of the FTA, its exports to the SADC and EU have been growing at annual averages of 16.2% and 23.2%, respectively.2 Overall, intra-COMESA exports accounted for an average of 7.8% of the bloc’s total exports annually during the same period, while its exports to the SADC and EU accounted for 9.4% and 44.1%, respectively. On the other hand, intra-COMESA imports accounted for 5.5% of its total imports, while imports from the SADC and the EU accounted for 11.4% and 27.1%, respectively. This raises the question of whether intra-COMESA trade growth during this period was in fact due to the FTA.
| Year | % Of total exports | % Of total imports | ||||||||||||||
|---|---|---|---|---|---|---|---|---|---|---|---|---|---|---|---|---|
| COMESA | SADC | EU | ECOWAS | ASEAN | EAC | China | USA | COMESA | SADC | EU | ECOWAS | ASEAN | EAC | China | USA | |
| 2000 | 11.6 | 15 | 36.2 | 0.3 | 3.8 | 5.3 | 2.3 | 7.7 | 4.8 | 13.8 | 29.5 | 0.1 | 3.8 | 1.7 | 4.5 | 8.9 |
| 2001 | 12.4 | 13.5 | 34.1 | 0.3 | 4.1 | 7.5 | 7.3 | 6.6 | 6 | 14.9 | 27 | 0.1 | 4.2 | 2 | 4.5 | 10.5 |
| 2002 | 8.2 | 9.6 | 53.2 | 0.2 | 1.2 | 3.3 | 3.2 | 4.4 | 5.3 | 11.9 | 31.2 | 0.1 | 3.4 | 1.9 | 4.4 | 9.3 |
| 2003 | 6.1 | 11.7 | 50.5 | 0.3 | 1 | 3.1 | 6 | 4.3 | 5.5 | 12.8 | 29.6 | 0.1 | 3.5 | 1.8 | 5.3 | 6.1 |
| 2004 | 5.5 | 9.6 | 53.8 | 0.3 | 1.3 | 3.2 | 4.5 | 4.9 | 5 | 13.9 | 30.9 | 0.2 | 3.8 | 2 | 6.1 | 4.9 |
| 2005 | 5.8 | 6.1 | 53.2 | 0.2 | 0.9 | 2.8 | 6.2 | 6.4 | 4.9 | 10.5 | 27.9 | 0.2 | 3.7 | 1.9 | 7 | 5.1 |
| 2006 | 4.1 | 6 | 52.2 | 0.2 | 0.4 | 1.9 | 9.6 | 6.7 | 5.2 | 9.6 | 26.2 | 0.6 | 4.2 | 2.1 | 8.1 | 4.7 |
| 2007 | 6 | 8 | 50.2 | 0.2 | 1.1 | 2.4 | 4.1 | 6.9 | 5.1 | 10.8 | 25.3 | 0.2 | 3.5 | 2.1 | 8.9 | 5.1 |
| 2008 | 6 | 4.8 | 48.8 | 0.6 | 1 | 1.9 | 10.8 | 5.6 | 5.1 | 9.2 | 26.8 | 0.2 | 4.2 | 1.8 | 9.1 | 6.1 |
| 2009 | 7.8 | 6.5 | 40.9 | 0.4 | 1.2 | 2.5 | 13.7 | 5 | 5.2 | 9.1 | 28.7 | 0.1 | 4.6 | 2 | 10.6 | 6.4 |
| 2010 | 7.8 | 7 | 43.2 | 0.5 | 1.2 | 2 | 14.9 | 4.3 | 5.9 | 9.5 | 27.3 | 0.4 | 4.7 | 1.8 | 11.2 | 5.4 |
| 2011 | 10.5 | 11.1 | 32.3 | 0.4 | 1.2 | 3.1 | 14.4 | 3.8 | 5.7 | 12.2 | 22 | 0.1 | 4.5 | 2.1 | 11 | 6.5 |
| 2012 | 8.6 | 10.8 | 31.6 | 0.3 | 2.1 | 3 | 13.3 | 5.4 | 6.5 | 10.7 | 21.9 | 0.1 | 4.4 | 2 | 12.4 | 5 |
| 2013 | 8.8 | 11.1 | 37.5 | 0.4 | 1.3 | 2.9 | 10.5 | 4.2 | 6.4 | 11 | 25.6 | 0.1 | 4.1 | 2.4 | 12.4 | 4.7 |
| Average | 7.8 | 9.4 | 44.1 | 0.3 | 1.6 | 3.2 | 8.6 | 5.4 | 5.5 | 11.4 | 27.1 | 0.2 | 4.0 | 2.0 | 8.2 | 6.3 |
Source: Authors’ calculations based on COMSTAT Database.
ASEAN, Association of Southeast Asian Nations; EAC, East African Community.
Direction of COMESA exports and imports 2000–2013
However, there is very little empirical evidence available on the role of the FTA on the region’s trade. Except for the study by COMESA in 2012, other studies are general in their assessments of regional integration. They are not specific to the FTA or to the CU, focusing instead on the aggregate effects of the economic bloc on trade. This study, therefore, aimed to fill this gap by empirically investigating whether the FTA enhanced intra-region trade. To this end, it answers the following questions: (i) What factors determined the region’s exports and imports? (ii) Why has COMESA traded more with the EU and SADC than among its member states (Table 1)? (iii) To what extent has the region benefitted from the FTA?
The rest of the paper is organised as follows. Section 2 summarises the theoretical literature on FTA’s trade creation and diversion roles. Section 3 reviews the empirical models adopted in the literature for assessing the impact of regional integration (trade policy) on trade. Section 4 presents the methodology and data used in the analysis. The results are presented and discussed in Section 5. Finally, Section 6 concludes by highlighting policy implications from the key findings of this study.
2. THEORETICAL LITERATURE REVIEW
The concepts of trade creation and trade diversion are pivotal in analysing regional integration. In terms of trade creation, establishing an FTA shifts trade from high-cost producers to lower-cost producers within the FTA. In terms of trade diversion, trade is shifted from lower-cost producers outside the FTA to higher-cost producers within it—and hence a country may lose out by joining. With economic integration, production and even consumption are often relocated due to relative price changes in the domestic markets of the member countries (Schiff and Winters, 2003). Generally, prices within an FTA are lower than those outside it, following the removal of tariffs. As such, member states are expected to increase imports of each other’s goods while reducing imports from the Rest of the World. However, member countries do not always benefit from these arrangements, as the overall economic welfare effect on the domestic economy depends on the impact of the associated net trade creation and trade diversion (Viner, 1950; Cheong and Wong, 2007).
Traditional trade theory states that by opening to trade, countries benefit from the increased world output that comes from specialisation in production and hence increased efficiency (Salvatore, 2004). In addition to opening to trade benefits, countries also benefit from increased market size and economies of scale, among other things. However, as indicated above, such arrangements may result in either trade creation or trade diversion. When it results in trade creation, it is deemed an outright benefit to the member countries, as its net effect enhances welfare. In particular, production efficiencies within the bloc are enhanced, as members tend to specialise based on their comparative advantages, and they gain from economies of scale, as trade continues to move away from high-cost producers outside the bloc. This may result in losses to some producers in the domestic economy if their products cannot compete with cheaper ones from within the bloc as a result of the reduction in import prices following tariff removals. However, increased efficiency gains consisting mainly of advances and innovations in production are expected for domestic firms, owing to stiffer competition as a result of liberalised trade. Furthermore, efficient producers benefit even more, as they take advantage of the entire bloc when designing their value chains and thereby generate more income for the domestic economy. A nation receives overall economic gains through growth in the consumption of cheaper imports and increased exports of its most efficient products.
By contrast, when the creation of an FTA results in trade diversion, members are worse off, as they increase consumption from higher-cost producers with resultant losses from both consumption and production efficiencies. However, Cheong and Wong (2009) observed that it is not always the case that trade diversion is detrimental to member economies. They argued that the basis of trade is pertinent to the concerned economies. If it is based on traditional trade theory (i.e. inter-industry trade), moderate trade diversion may benefit domestic consumers and improve the overall welfare. However, this result does not generally hold with higher volumes of trade diversion. Also, there are uncertainties about the positive welfare impact of trade diversion if new trade theories (i.e. intra-industry trade) form the basis of trade for the concerned economies.
Whether an FTA creates or diverts trade to member economies, the overall net effect is largely positive for the individual economies involved and for the region in general. If changes in trade volume that follow from trade creation or diversion result in a decline in world prices, member economies further enjoy improvements in the Terms of Trade. As the removal of trade barriers paves the way for efficient producers to centralise production and penetrate markets where their prices were initially inflated with duties, stiffer competition is enhanced by the consequent improvement of the region’s resource allocation and production. These, among other benefits, positively contribute to the growth and development of the member economies, as well as of the entire region.
3. EMPIRICAL LITERATURE REVIEW
The empirical evidence on the role of FTAs or Regional Integration Agreements (RIAs) on trade is mixed. Some studies, such as Mevel and Karingi (2012), Amuli (2014), Karamuriro (2015), and Touitou (2016), substantiated the claim that FTAs and RIAs create trade. Other studies, including Muhammad and Yucer (2009) and Wengawenga and Ferdaus (2014), found little evidence or completely failed to find support for the claim that FTAs and RIAs bolster trade. Magee (2008) observed that different FTAs or RIAs have varying effects on trade in different countries, mainly due to their nature and level of integration. For example, while Common External Tariffs (CETs) are applied in a CU, member countries maintain their respective external tariffs in an FTA. These variations include setting CETs in a CU or rules of origin in an FTA, and they have been empirically confirmed to influence trade differently (Magee, 2008; Mattoo et al., 2017). Consistent with this argument, Musila (2005) observed that the intensity of trade creation or diversion varies across regions, and, specifically, that the intensity of trade creation in the Economic Community of West African States was much higher than in COMESA.
Focusing on COMESA data, Karamuriro (2015) compared the export performance before (1980–1993) and after (1994–2012) COMESA was established. Validating the gravity model estimates from the Fixed Effects (FE), Random Effects (RE), and Generalised Method of Moments estimators, he found that the establishment of COMESA had the effect of creating trade, resulting in an increase of approximately 35% in intra-regional exports. The study is informative on the overall trade-creating effect of COMESA, but it is silent on the effectiveness of the bloc’s deeper integration efforts. The study did not discuss the impact of the FTA since its establishment in 2000 or the launch of the CU in 2009, even though both developments were within the period covered by the study. However, research highlights that not all members can be expected to immediately reap benefits from a CU unless they effectively harmonise customs procedures, improve economic infrastructure, and remove non-tariff barriers to trade, among other prerequisites (Dimaranan and Mevel, 2008; Nzuma et al., 2009).
Other studies covering a subset of COMESA countries confirm the above assertions that RECs have different impacts on different countries. For example, Wengawenga and Ferdaus (2014) failed to find support for the trade-creating effect of RECs over the period 1980–2000, although their study covered only five member countries. However, Amuli (2014) confirmed the trade-creating effect of RECs with a comprehensive study of both old and new member countries. Focusing on the effects of COMESA’s expansion through new entrants, they found that the trade-creating effect of RECs was relatively weak, without confirming the possibility of trade diversion from non-members. This is in line with Ebaidalla and Yahia (2014), whose results again suggest that the trade-creating effect of RECs is rather weak, although somewhat enhanced by the formation of an FTA. Their gravity model of eight COMESA countries asserted the unfavourable performance of intra-COMESA trade evidenced by the gap between potential and actual trade volume. A decline in this gap in some countries was observed after the formation of the FTA, suggesting that the FTA had a trade-creating effect among its signatories. Despite focusing on the FTA, however, the study did not discuss salient factors that might explain the continued underperformance of trade by members in the presence of the FTA.
Overall, there is evidence of an average increase in trade volume within COMESA since the establishment of the FTA in 2000 (Karamuriro, 2015). While it is clear that the RIA (COMESA) or the FTA or CU promoted trade, the extent to which they improved trade in the region remains ambiguous. Specifically, it is unclear whether the expanded trade volume is due to an increased market share of a few countries at the expense of many members in the region or whether the FTA contributed to this growth. For instance, while total intra-COMESA trade grew by over 8% in 2013 (COMESA, 2014), individual economies registered different growth rates for both imports and exports. Tremendous growth rates were registered for economies such as Swaziland (176.5% and 164.7% for imports and exports, respectively) but varying negative growth rates were also registered for Djibouti (−94% for exports), Malawi (−44.7% for imports), and Zimbabwe (−35% for imports) [see Table 2 in the annexes of the COMESA Annual report (COMESA, 2014)]. The evidence, therefore, remains ambiguous and empirical studies sometimes have opposite conclusions.
The fact that COMESA’s trade with the rest of the world (the SADC and EU) has increased more than trade within the bloc (Table 1) casts further doubt on the attribution of this growth to the FTA. It is therefore imperative to investigate what influences the direction of trade in COMESA, or rather the basis for intra-COMESA trade and the impact it has had on member economies and the region. Such an investigation will help explain why COMESA’s intra-regional trade is poor—as concluded by Ebaidalla and Yahia (2014)—and why its trade volume with the SADC and EU has escalated faster than trade within the bloc. Moreover, the literature reviewed above is general, and not specific to the FTA. It has not explicitly differentiated COMESA members that are not signatories. As such, this study attempts to fill the gap in the literature on the effect of deeper integration, and, more specifically, the impact of the FTA on trade in the region.
4. METHODOLOGY
The gravity model and variants of Computable General Equilibrium (CGE) models constitute the most commonly adopted methods for analysing regional integration and trade. Despite significant variations in their approach to trade analysis, both approaches have been theoretically and empirically proven to be consistent with a wider range of traditional theories of comparative advantage (inter-industry trade) and new trade theories of product differentiation (intra-industry trade). Moreover, they produce consistent estimates for policy-related inferences (Feenstra et al., 2001; Piermartini and Teh, 2005). On the one hand, CGE models are mathematical simulations assessing the welfare and distributional impacts of trade policy before its implementation. For example, they can quantify, ex-ante, the effects of an FTA on welfare and income to guide policy on the viability of the FTA before it is implemented. They are appealing for their comprehensive estimates of policy impacts that consider interdependences among economic variables. However, this equally limits their applicability, as it entails the need for a large amount of very detailed data to describe such relationships.
The gravity model is the most commonly used econometric model to assess post-policy implementation effects on trade flows. Unlike CGE models that explain trade policy effects beyond trade flows and quantify of the effects of welfare and income distribution, a gravity model is not capable of quantifying such impacts (Tejedor, 2017). However, its data requirements are not as cumbersome as those of CGE models. Gravity models are dynamic and offer a systematic framework for bilateral trade analysis with parameters that are easily explained. In its basic form, the model treats trade volume between countries as an increasing function of their national incomes and a decreasing function of the geographical distance between their economic centres, as follows:
Although the theoretical framework of the gravity model was settled by the early 1990s, questions about its suitability to international trade analysis remained, with some scholars citing its basic form as a functional misspecification. For instance, Cheng and Wall (2005) argued that, despite providing a high R2, the standard cross-section estimation methods result in biased estimates, as they do not control for country heterogeneity. They further argued that the standard Cross-Section (CS3) and the Pooled Cross-Section (PCS4) tend to underestimate trade between high-volume traders and overestimate it between the low-volume traders. They attributed this to the heterogeneity bias resulting from the restriction that, over time, the parameter vector remains constant for all trading pairs in both the CS and the PCS models. In essence, they criticised the model for misspecifications with its consequent inconsistent Ordinary Least Squares (OLS) estimates. Similar criticisms were also put forward by Feenstra (2004) due to the model’s implicit assumption of identical prices across countries. Moreover, Ivus and Strong (2007) argued that failure by the distance variable to account for multiple economic centres in some countries, as well as the quality of infrastructure, among other factors, undermines its accuracy to reflect the true trade costs in the model.
Consequently, panel data methods are preferred. They control for country heterogeneity bias in the gravity model (WTO, 2012). This is because panel data methods allow for adjustments to both dependent and independent variables over time, thereby making it possible to isolate various temporal and country-specific effects. This study adopts a variant of the gravity model to estimate a panel of 13 COMESA countries using the Generalised Least Squares (GLS) estimator. As discussed in Section 4.1, the focus is on distinguishing the ex post effects of the COMESA FTA.
4.1. Model Specification
The modification to the commonly accepted empirical model is the use of single-country variables in the present study to account for the heterogeneity of the structural factors of each importing and exporting country. This allows us to test the relative importance of variables such as GDP and GDP Per Capita (PCGDP) to the origin and destination countries on trade volume, which is not possible with the commonly adopted gravity model insofar as it uses products of the variables from paired trading partners. Also, PCGDP is replaced by the Human Development Index (HDI) as a proxy for the economic and social development of a country. It is assumed that both education and health affect the ability to trade, as does the level of income. Import and export equations are estimated separately on the assumption that the determinants of each model are different. This differs from most studies, which either estimate exports (or imports) only, or total trade volume (measured as an average of exports and imports). In both cases, reliable transport and communication networks are effective at reducing trade costs that increase with distance. As such, an innovation introduced in this study is the use of interactions between distance, transport, and Information and Communications Technology (ICT) infrastructure to account for their improvements in the region over time. The general specification of the estimation equation is as follows:
The two dummies for the COMESA FTA separately capture trade creation among FTA members, and at the regional level. Consequently, a positive coefficient is expected for both dummies (Eicher et al., 2008). Dummies for the EU and SADC are included, considering that 9.4% and 44.1% of COMESA exports are destined to the SADC and EU, respectively, and 11.4% and 27.1% of COMESA imports originate from the SADC and EU, respectively. These values are significantly higher than intra-COMESA exports (7.8%) and imports (5.5%) (Table 1). The dummies, therefore, capture the net impact of these blocs on COMESA’s trade performance.
A country’s absolute trade potential depends heavily on its total economic size5 and level of development.6 The higher the GPD and HDI of a country, the higher the variety of tradable products it has in its trade basket. GDP captures the productive capacity of the exporter country, as well as the purchasing power of the importer country (Eita, 2008). An economy’s size and level of development are expected to be positively correlated with the volume of trade, since they are highly correlated with differences in factor endowments and product quality (Linder, 1961; Fajgelbaum et al., 2011).
Trade also increases with cultural similarities among nations. In this regard, countries are expected to trade more when they share a common official language that facilitates communication, and when they have favourable geographical factors such as proximity or a shared border. Trade is also expected to increase among countries in the same regional trading bloc or between partners with bilateral trading agreements. The dummies for all the configurations are expected to be positive.
As a resistance factor, distance is inversely related to the volume of bilateral trade between countries. It captures transportation and other transaction costs, such as constraints imposed by commercial policies, which escalate as the distance between the trading partners increases (Behar and Venables, 2010). However, the net effect is expected to be significantly reduced or eliminated with better infrastructure quality. As such, the sign of β5 cannot be determined a priori.
The Linder term is included in the equation specifically to explain the trading patterns of COMESA members over the period under consideration. It is defined as
4.2. Estimation Technique
Most studies use OLS to estimate the gravity equation. However, the validity of the estimates depends on the assumption that the error term (εijt) is statistically independent of the regressors (homoscedastic) (Silva and Tenreyro, 2003). Also, the probability that Equation (3) will be free from multicollinearity is very small. OLS is therefore likely to generate inconsistent, inefficient, and unreliable coefficients. The GLS estimator is therefore used to obtain consistent and reliable estimates.7 It is important to note that the salient features of the dataset compromise the efficiency of GLS estimation methods. Specifically, for a dataset that has a longer time (T) than the cross-sectional units (N), as in the present study, Stata recommends the use of the “xtgls” command as the most efficient for estimating the GLS model.8 Zero trade data between trading partners in some years make the estimation of the log-linear version of Equation (2) infeasible. The alternative is to estimate the model in levels to retain the zeros or replace them with small, arbitrary values (usually $1). It is also common to drop the zeroes and obtain OLS estimates from the truncated sample. However, these options lead to biased estimates (Montenegro and Soto, 1996; Silva and Tenreyro, 2006; Helpman et al., 2008), particularly if it is unclear whether they represent zero trade volumes or rounding errors and/or omissions. Since the zero observations were few (2% of the trade flows) and randomly distributed, they were assigned a value of $1 on the assumption that they represent rounding errors and/or missing information. The transport and ICT indexes had missing data for 3 years (1997–1999) and were treated as such in the analysis.
4.3. Data Type and Sources
Panel data for COMESA member states were constructed for the years 1997–2015. Only 13 member states had adequate data: Burundi, the Democratic Republic of the Congo, Egypt, Ethiopia, Kenya, Madagascar, Malawi, Mauritius, Rwanda, Swaziland, Uganda, Zambia, and Zimbabwe. The variables of interest were GDP, HDI, exports, imports, and distance between the capital cities, as described in Table 2. The summary statistics for these variables are presented in Appendix Table A1.
| Variables | Description | Source |
|---|---|---|
| Exports and imports | Measure intra-COMESA trade and COMESA’s trade with other regions | UNCTADSTAT, 2017. http://unctadstat.unctad.org |
| GDP | Gross domestic product as a measure of the size of the economies | World Development Indicators (WDI), 2017. |
| HDI | Human development indicator is a composite development index of life expectancy, education and per capita gross national income. Higher levels of the HDI reflect higher levels of education, life expectancy, and national income per capita. It is used in this article as a measure of the country’s level of social and economic development. | UNDP database, 2019. http://hdr.undp.org/en/data# |
| Language | Official languages of COMESA member countries | COMESA. https://www.comesa.int |
| Transport infrastructure index | A composite index measuring total paved roads (km/10,000 inhabitants) and total road network in kilometres (per km2 of exploitable land area). It is used in the study to reflect innovations and developments in transport infrastructure as they relate to trade transaction and transportation costs. It takes values between 0 and 100 with higher values indicating better transport infrastructure | African Infrastructure Development Index (AIDI) database, 2019. http://infrastructureafrica.opendataforafrica.org/ |
| ICT index | The ICT index measures the total phone subscriptions (per 100 inhabitants), number of internet users (per 100 inhabitants), fixed (wired) broadband internet subscribers (per 100 inhabitants), and international internet bandwidth (Mbps). It takes values between 0 and 100, with higher values showing better infrastructure | African Infrastructure Development Index (AIDI) database, 2019. http://infrastructureafrica.opendataforafrica.org/ |
| Distance | Captures distance in kilometres between the capital cities of the two trading partners. Air distance is used in this study, as it was not feasible in some instances to get the road/travel distance between certain cities | Distance Calculator, 2017. https://www.timeanddate.com |
| FTA | Represents the COMESA Free Trade Area. It has been split into two dummies to capture its trade-creating effects both among its members and at the regional bloc | COMESA. https://www.comesa.int |
| SADC | This is the Southern Africa Development Community, which has been included in the article as a dummy to assess its impact on the trade of COMESA countries, particularly those that are signatories to both SADC and COMESA | COMESA. https://www.comesa.int, https://www.sadc.int/member-states/ |
| EU | This is the European Union economic/trading bloc. It has been included in the article as a dummy to capture its impact on intra-COMESA trade through bilateral agreements between its members and COMESA countries | COMESA. https://www.comesa.int, https://www.europarl.europa.eu |
| Border | This represents the physical boundaries between trading partners | World Map |
| Linder | The Linder term is from the Linder (1961) hypothesis, which suggests more intense trade between countries of similar incomes. Simply computed as the absolute difference between the incomes (per capita GDP) of the trading partners, the Linder term is used to capture bilateral trade patterns in the region | World Development Indicators (WDI), 2017. |
Description of variables and data sources
5. EMPIRICAL ANALYSIS: RESULTS AND DISCUSSION
Levin–Lin–Chu (LLC) and Im–Pesaran–Shin (IPS) unit root tests were conducted on the variables. The tests impose different restrictions on the panels to ensure that the variables included in both the export and import models are integrated and in the right order. While the LLC assumes a homogeneous autoregressive coefficient under the null hypothesis of a unit root in each panel and the alternative of stationarity in all the panels, IPS relaxes the assumption on the basis that the coefficient is influenced by several country-specific parameters. Instead, it allows for heterogeneous panels by fitting a Dickey–Fuller equation for each panel separately and then averaging the t-statistics from the regressions. All variables are stationary in levels for both tests, except the HDI variables under LLC (Appendix Table A2).
Both models returned a significant chi-squared statistic at 1%, implying a good fit, and all the variables except ICT variables had the expected signs (Table 3). All the variables were significant in determining the direction of exports and imports in COMESA. The only exceptions were the FTAi, and ICTj in both the export and import models, as well as HDIj and ICTi in the import model.
| Variables | lnexportsij | lnimportsij | ||
|---|---|---|---|---|
| Coefficient | z | Coefficient | z | |
| lnGDPi | 1.233437*** | 14.81 | 1.38427*** | 16.30 |
| lnGDPj | 0.9712419*** | 11.69 | 0.9403239*** | 11.10 |
| HDIi | 2.867513*** | 2.94 | 2.102861*** | 2.12 |
| HDIj | 4.205279*** (4.05) | 4.05 | 0.8833177 | 0.83 |
| FTAij | 0.7891685*** | 3.32 | 0.6691447*** | 2.76 |
| FTAi | −0.0451681 | −0.21 | −0.1677312 | −0.77 |
| SADCij | 1.202588*** | 5.86 | 1.467054*** | 7.01 |
| EUij | 0.6882018*** | 2.54 | 2.447831*** | 8.85 |
| lanij | 0.5600163*** | 2.75 | 0.734549*** | 3.54 |
| cbordij | 3.416036*** | 12.38 | 3.306108*** | 11.75 |
| Linder | 0.1638618*** | 3.06 | 0.1602036*** | 3.09 |
| lnDistanceij | −1.784936*** | −14.93 | −1.531779*** | −12.56 |
| cons | −30.58654*** | −10.74 | −34.88122*** | −12.01 |
| T | 19 | 19 | ||
| N | 13 | 13 | ||
| Observations | 2824 | 2824 | ||
| Wald χ2 | 1263.21*** | 1136.99*** | ||
Notes: ***denotes significance at 1%, **denotes significance at 5%, and *denotes significance at 10%.
Results of the exports and imports models (distance not interacted with transport and ICT infrastructure indexes)
A positive Linder term in the export model implies that inter-industry trade prevails, and, as such, members export less within the bloc. According to trade theory and consistent with Karamuriro (2015), COMESA members are exporting based on their comparative advantages. Moreover, with little or no value addition to their products, their similar factor endowments and demand structures suggest that the direction of their exports should be skewed toward outside, rather than within the bloc. However, the FTA created trade in both the export and import models at the regional level, yet only for exports at the national level (Table 4). This observation is consistent with the conclusions of Ebaidalla and Yahia (2014), who found that COMESA’s trade performance is still far below the bloc’s potential. Similarly the import model has a positive sign for the Linder term, suggesting that COMESA member states equally import differentiated products as described in traditional trade models of comparative advantage. More imports are supposed to originate from within the bloc if and only if product differentiation is evident. This is not the case, however, as observed in the export model, hence the bloc’s underperforming intra-trade.
| Variables | lnexportsij | lnimportsij | ||
|---|---|---|---|---|
| Coefficient | z | Coefficient | z | |
| HDIi | 4.52078*** | 3.43 | 4.0129*** | 2.96 |
| HDIj | 4.80709*** | 3.45 | 0.87844 | 0.61 |
| lnGDPi | 1.47239*** | 14.98 | 1.63812*** | 16.17 |
| lnGDPj | 1.19968*** | 12.28 | 1.0946*** | 10.87 |
| FTAij | 1.25385*** | 3.94 | 0.79083** | 2.41 |
| FTAi | 0.44316 | 1.55 | 0.15506 | 0.53 |
| SADCij | 1.30421*** | 6.05 | 1.61173*** | 7.25 |
| EUij | 0.63116** | 2.19 | 2.64449*** | 8.9 |
| lanij | 0.60078*** | 2.56 | 0.85855*** | 3.55 |
| cbordij | 3.45504*** | 11.89 | 3.51641*** | 11.74 |
| Linder | 0.1431028*** | 2.42 | 0.13065** | 2.34 |
| Distij * ICTi | 0.04585* | 1.83 | 0.01328 | 0.51 |
| Distij * transpi | −0.0768*** | −5.41 | −0.0747*** | −5.1 |
| Dist * ICTj | 0.00402 | 0.16 | 0.01013 | 0.39 |
| Distij * transpj | −0.0804*** | −5.65 | −0.0663*** | −4.52 |
| lndistanceij | −0.4255** | −2.13 | −0.2443 | −1.19 |
| transpi | 0.62071*** | 5.34 | 0.60708*** | 5.06 |
| ICTi | −0.3823* | −1.88 | −0.1752 | −0.84 |
| transpj | 0.65977*** | 5.66 | 0.54827*** | 4.56 |
| ICTj | −0.0947 | −0.46 | −0.0717 | −0.34 |
| _cons | −53.828*** | −13.3 | −56.192*** | −13.47 |
| T | 19 | 19 | ||
| N | 13 | 13 | ||
| Observations | 2467 | 2467 | ||
| Wald χ2 | 1270.59*** | 1135.96 | ||
Notes: ***denotes significance at 1%, **denotes significance at 5%, and *denotes significance at 10%.
Results of the exports and imports models (distance interacted with transport and ICT infrastructure indexes)
The results in both Tables 3 and 4 also show that the EU and SADC positively influence the direction of exports and imports of COMESA members. This further muddles the expectation that deeper integration in COMESA (i.e. the FTA) would outweigh the gains from preferential trade treatments in the EU and SADC. Alternatively, other factors are influencing the increased trade between COMESA and the EU and SADC. In compliance with the traditional trade theory (as explained above), a close examination of the products exported to the EU and SADC exposes the lack of a potential market within the bloc. A positive but significant Linder coefficient in the exports and import models confirms this assertion. Products exported to countries outside the COMESA region are either in raw or semi-processed forms, whereas imports to the region consist mainly of processed products from their related export materials. The exports are concentrated around a narrow range of products, including tobacco, diamonds, uranium, copper, and cotton. Most of these products are neither essential raw materials for COMESA industries nor critical for consumption within the region, rendering them valuable as exports to the EU and SADC. In instances where the product is a potential key import for the region, transportation setbacks, among other issues, hinder its way to the relevant markets within the region. For example, crude oil and refined petroleum from Libya and Egypt are mainly exported to Europe and Asia, despite their significant market potential within the region. Most countries in the region import finished products such as cars, refined petroleum, and medicines (COMESA, 2013). Such products are rarely, if ever, manufactured within the region, even though the region produces the raw materials for most of these products on a large scale. This may explain why efforts toward deeper integration in COMESA have not dented the EU market’s dominance over COMESA’s exports. As countries with similar geographical settings, their factor endowments are similar, and most of them rely heavily on agricultural products. In this regard, product differentiation as the basis for intra-COMESA trade as suggested by the Linder theory requires the emergence of a vibrant manufacturing sector, as well as reliable and well-integrated multi-modal transport infrastructure, to enhance access by all member states to the bigger market presented by the bloc. However, the shift in the structure of production and trade has been slow to materialise in COMESA (ECA, 2004; Ebaidalla and Yahia, 2014). Dual membership for some economies, including the heavy manufacturing sector in South Africa, partly explains COMESA’s higher trade volumes to the SADC.
In line with the positive impact that sharing a border has on the volume of exports and imports in the region, the distance between countries negatively affects the direction and volume of trade in the region (Tables 3 and 4). Although the negative effect of distance on trade was expected to be mitigated by advancements in transport and ICT infrastructure, Table 4 shows a positive and significant coefficient of only the distance and domestic ICT interaction variable in the export model. From the perspective of the trade reporting country, these results imply that it is only domestic ICT that significantly mitigates the negative effects of distance on exports. While this result shows the importance of better ICT for enhancing exports, it also highlights the potential for improved trade volume with equally good ICT infrastructure in the trading partners. On the flip side, the results show that the impact of better ICT infrastructure and technology on trade is even higher with increased distance. Specifically, Table 4 shows that, independent of distance, the net impact of good domestic ICT on exports is negative, while its interaction with distance is positive and significant. In other words, leveraging e-commerce and other ICT trade-related functions is even more significant in reducing trade-related costs and enhancing exports with increased distance.
Table 4 further shows that the independent impact of transport infrastructure is positive and significant for both exports and imports. This result highlights the importance of good connectivity on trade, particularly in a region whose membership is largely landlocked. However, negative and significant coefficients of the distance and transport interaction variables highlight the fact both the quality and quantity of transport infrastructure are not enough to counter the negative distance effects on trade in the region. Visibly poor transport infrastructure and missing links within and across different modes of transport remain eminent in most countries in the region, except for in Egypt, Libya, and Mauritius (Appendix Figure A1). As such, connectivity within and between countries in the region remains a hurdle for trade, as it continues to account for most of the region’s trade-related costs, which are even higher with increased distance (Ancharaz et al., 2010; Mlambo and Mlambo, 2018).
While the level of development (HDI) in reporting countries has a positive impact on their export and import capacities, it only has a positive impact on the exporting capacities of their partner countries. This implies that although economic development is crucial for boosting production capacity, the profitability of exports is mainly driven by the purchasing power of the trading partners (i.e. the market). Languages spoken in COMESA also have a positive bearing on the direction of trade. English is used in 12 countries, four of which also have French, including one with Arabic as an additional official language. French is an official language in eight countries, two of which also have Arabic. Anglophone and francophone countries with combinations of French and Arabic or English and Arabic in COMESA explain why language facilitates trade. This also potentially explains why Egypt and Libya export refined petroleum to a few other Arabic-speaking COMESA countries (Djibouti, Comoros and Sudan), while the rest is exported to Europe and Asia.
6. CONCLUSION AND POLICY RECOMMENDATIONS
The paper assessed the impact of the COMESA FTA on its intra-regional trade using a gravity model. A positive and significant FTAij coefficient indicated that the FTA bolstered trade among its signatories. Positive and significant dummies for the SADC and EU provided further evidence that the two blocs influenced the direction of COMESA’s trade. A positive Linder term in both models suggests consistencies in the underlying factors that influenced the direction of exports and imports. Whilst the region exported its commodities based on their comparative advantage with little or no value addition, they imported differentiated goods, mostly from the processed materials of their exports. The relatively low level of intra-COMESA trade is, therefore, a consequence of underutilising the potential benefits of the FTA, particularly by the manufacturing and related services sectors.
Sustained economic growth promotes trade among trading countries. By raising the purchasing power of partners, economic growth affects the intensity (i.e. the volume) and the direction of trade. However, a significant and positive HDI coefficient exclusively in the export model suggests that the trading partner’s level of development is inconsequential for the reporter’s imports, except that it significantly improves its capacity to export. Significant positive coefficients of the size of the economies of both partners, and of language and a common border—and a significant negative coefficient of the distance variable—further suggest that these variables are consequential in promoting trade in the region. Furthermore, while distance enhances the relevance of good ICT infrastructure for trade, it has a dampening effect on the ability of transport infrastructure to enhance trade. The paper also provides evidence that domestic ICT mitigates the negative effects of distance on trade. Despite a positive independent impact on trade, however, transport infrastructure in the region has yet to be developed to a level that can efficiently lower the trade-related costs that increase with distance.
Although the FTA is beneficial to intra-COMESA trade, the results of this study indicate that more could be delivered if product differentiation (intra-industry trade) were supported. There is a notable gap in the production chain. Consequently, the region mainly exports raw and semi-processed products. Its taste for imports from other regions mainly consists of manufactured goods with close similarity in material content to the region’s exports. This illustrates the failure by members to exploit the FTA’s market potential.9 To break this trend, COMESA countries need to build their manufacturing capacities to increase intra-regional trade and boost domestic industries. However, better use of comparative advantages through the diversification of exports, value addition to commodities, and strengthened national and regional value chains are further steps needed to achieve this. This should be properly supported by appropriate investment policies, namely, sustainable financing, equitable reallocation of resources toward new and relevant industries, and a revitalisation of old industries. These will help maximise the benefits of the FTA and increase the competitiveness of exports, such that COMESA can gain more from trade beyond the bloc.
The results show that transport infrastructure is exclusively effective at enhancing both exports and imports when distance is minimal. Inadequate transport infrastructure, inefficient transport networks, and weak transit systems render the entire transportation arrangement unreliable and expensive—and more so with increased distance. Transportation costs in COMESA are among the most expensive in the world, accounting for an average of 31.7% of the import value in seven of its member states: Burundi, Ethiopia, Malawi, Rwanda, Uganda, Zambia, and Zimbabwe (Ancharaz et al., 2010). The region has considerably reduced process costs that negatively affect trade, for example, through the integration of customs and other administrative procedures at borders. However, there is limited progress toward a multimodal transportation system that could effectively enhance the interconnectivity among member states. Several missing links within key locations and among different modes render the intermodal transfer of goods unfeasible in some instances. Hence, it remains expensive to transfer goods among COMESA member states (Muuka et al., 1998; ECA, 2004). In-country modes are mostly inadequate at catering to the intermodal transfer of goods in member states (Appendix Figure A1). These setbacks in the transport sector undermine the optimal utilisation of the FTA. It is therefore crucial for COMESA countries to enhance investment in economic infrastructure (specifically, transport and ICT) and improve the competitiveness of exports from the region. Priority should be on improving transport infrastructure, enhancing intermodal connectivity, and elevating the quality of other related services such as ICT that affect transactions and transit costs. Indeed, the paper finds that ICT could help counter the higher export costs associated with longer distances. For example, the COMESA Virtual Trade Facilitation System, an electronic platform, has improved integration among COMESA instruments, including the Yellow Card (third-party motor vehicle insurance), Regional Customs Bond Guarantee System, and the Customs Declaration Document. However, more concerted efforts are needed to achieve a balanced transport infrastructure system, open new routes, and improve connectivity among countries. There is also a need to improve the existing transport corridors that have served as export channels. The broader objective is to continue to reduce production costs, enhance the competitiveness of COMESA products, and boost the region’s industrialisation potential through better-linked value chains.
CONFLICTS OF INTEREST
The author declares no conflicts of interest.
ACKNOWLEDGMENTS
The author would like to thank the reviewers for their helpful comments and suggestions on the paper. The author would like to particularly acknowledge with deep appreciation, the editor of this journal, Prof. Augustin Fosu, for the time he spent reading this paper over and over providing insights and valuable comments that greatly shaped all aspects of the paper.
APPENDIX
| Variables | Mean | Std. Dev. | Min | Max | Observations | |
|---|---|---|---|---|---|---|
| lnexpo~j | overall | 12.63787 | 5.015694 | 0 | 21.23126 | N = 2964 |
| between | 3.856018 | 2.575479 | 19.96032 | n = 156 | ||
| within | 3.22159 | −2.243518 | 25.06172 | T = 19 | ||
| lnimpo~j | overall | 12.86264 | 4.992308 | 0 | 21.54626 | N = 2964 |
| between | 3.776589 | 1.868231 | 19.75853 | n = 156 | ||
| within | 3.278285 | −3.072887 | 28.80436 | T = 19 | ||
| lndist~j | overall | 7.673362 | 0.8440456 | 5.172017 | 12.01555 | N = 2964 |
| between | 0.8466211 | 5.172017 | 12.01555 | n = 156 | ||
| within | 0 | 7.673362 | 7.673362 | T = 19 | ||
| lnGDPi | overall | 23.17368 | 1.139326 | 21.0747 | 26.24453 | N = 2964 |
| between | 1.104961 | 21.3007 | 25.88592 | n = 156 | ||
| within | 0.290762 | 22.49226 | 24.00282 | T = 19 | ||
| lnGDPj | overall | 23.17322 | 1.139376 | 21.0747 | 26.24453 | N = 2964 |
| between | 1.104945 | 21.3007 | 25.88592 | n = 156 | ||
| within | 0.2910166 | 22.4918 | 24.00236 | T = 19 | ||
| FTAij | overall | 0.3764348 | 0.4845729 | 0 | 1 | N = 2962 |
| between | 0.3710962 | 0 | 1 | n = 156 | ||
| within | 0.3128466 | −0.4656704 | 1.323803 | T = 18.9872 | ||
| FTAi | overall | 0.4047941 | 0.490935 | 0 | 1 | N = 2962 |
| between | 0.3563924 | 0 | 1 | n = 156 | ||
| within | 0.3386562 | −0.4899428 | 1.246899 | T = 18.9872 | ||
| SADCij | overall | 0.7312627 | 0.4433779 | 0 | 1 | N = 2962 |
| between | 0.4449886 | 0 | 1 | n = 156 | ||
| within | 0 | 0.7312627 | 0.7312627 | T = 18.9872 | ||
| EUij | overall | 0.84605 | 0.3609618 | 0 | 1 | N = 2962 |
| between | 0.3619632 | 0 | 1 | n = 156 | ||
| within | 0 | 0.84605 | 0.84605 | T = 18.9872 | ||
| lanij | overall | 0.666104 | 0.4716827 | 0 | 1 | N = 2962 |
| between | 0.4727021 | 0 | 1 | n = 156 | ||
| within | 0.0178871 | −0.2812644 | 0.7187356 | T = 18.9872 | ||
| cbordij | overall | 0.1282917 | 0.3344708 | 0 | 1 | N = 2962 |
| between | 0.3353948 | 0 | 1 | n = 156 | ||
| within | 0 | 0.1282917 | 0.1282917 | T = 18.9872 | ||
| Linder | overall | 1.287776 | 1.486028 | 0 | 16.57409 | N = 2964 |
| between | 1.475361 | 0.1079773 | 16.4059 | n = 156 | ||
| within | 0.2116905 | −1.553536 | 2.125223 | T = 19 | ||
| Disticti | overall | 24.09746 | 62.22255 | 0.0011259 | 481.4079 | N = 2484 |
| between | 27.61011 | 2.498191 | 94.85444 | n = 156 | ||
| within | 55.78653 | −70.48204 | 410.6509 | T-bar = 15.9231 | ||
| Distan~i | overall | 104.1574 | 120.6052 | 7.562625 | 502.9365 | N = 2484 |
| between | 120.193 | 10.28014 | 463.2605 | n = 156 | ||
| within | 12.57618 | 78.35504 | 170.6486 | T-bar = 15.9231 | ||
| Distictj | overall | 24.09746 | 62.22255 | 0.0011259 | 481.4079 | N = 2484 |
| between | 27.61011 | 2.498191 | 94.85444 | n = 156 | ||
| within | 55.78653 | −70.48204 | 410.6509 | T-bar = 15.9231 | ||
| Distan~j | overall | 104.1574 | 120.6052 | 7.562625 | 502.9365 | N = 2484 |
| between | 120.193 | 10.28014 | 463.2605 | n = 156 | ||
| within | 12.57618 | 78.35504 | 170.6486 | T-bar = 15.9231 | ||
| HDIi | overall | 0.4785062 | 0.1113001 | 0.283 | 0.782 | N = 2892 |
| between | 0.101419 | 0.3531579 | 0.719579 | n = 156 | ||
| within | 0.0451978 | 0.3495062 | 0.5715062 | T-bar = 18.5385 | ||
| HDIj | overall | 0.4785062 | 0.1113001 | 0.283 | 0.782 | N = 2892 |
| between | 0.101419 | 0.3531579 | 0.719579 | n = 156 | ||
| within | 0.0451978 | 0.3495062 | 0.5715062 | T-bar = 18.5385 | ||
Summary statistics
| Variables | LLC | IPS | |||
|---|---|---|---|---|---|
| Adjusted t | Statistic (Z-t-tilde-bar) | Critical values | |||
| 1% | 5% | 10% | |||
| Inexports | −8.20147*** | −10.6170*** | −1.730 | −1.670 | −1.640 |
| lnimports | −7.7728*** | −7.1877*** | −1.730 | −1.670 | −1.640 |
| lnGDPi | −14.7279*** | −5.2344*** | −2.380 | −2.320 | −2.280 |
| lnGDPj | −14.8421*** | −5.4130*** | −2.380 | −2.320 | −2.280 |
| HDIi | −4.2387*** | −2.380 | −2.320 | −2.280 | |
| HDIj | −4.6315*** | −2.380 | −2.320 | −2.280 | |
| Linder | −11.6646*** | −3.1042*** | −2.380 | −2.320 | −2.280 |
Notes: (i) ***denotes significance at 1%, **denotes significance at 5%, and *denotes significance at 10%. (ii) Except exports and imports that are stationary in levels without or around the trend term, all variables are stationary around the trend term.
Levin-Lin-Chu (LLC) and Im-Pesaran-Shin (IPS) unit root tests result
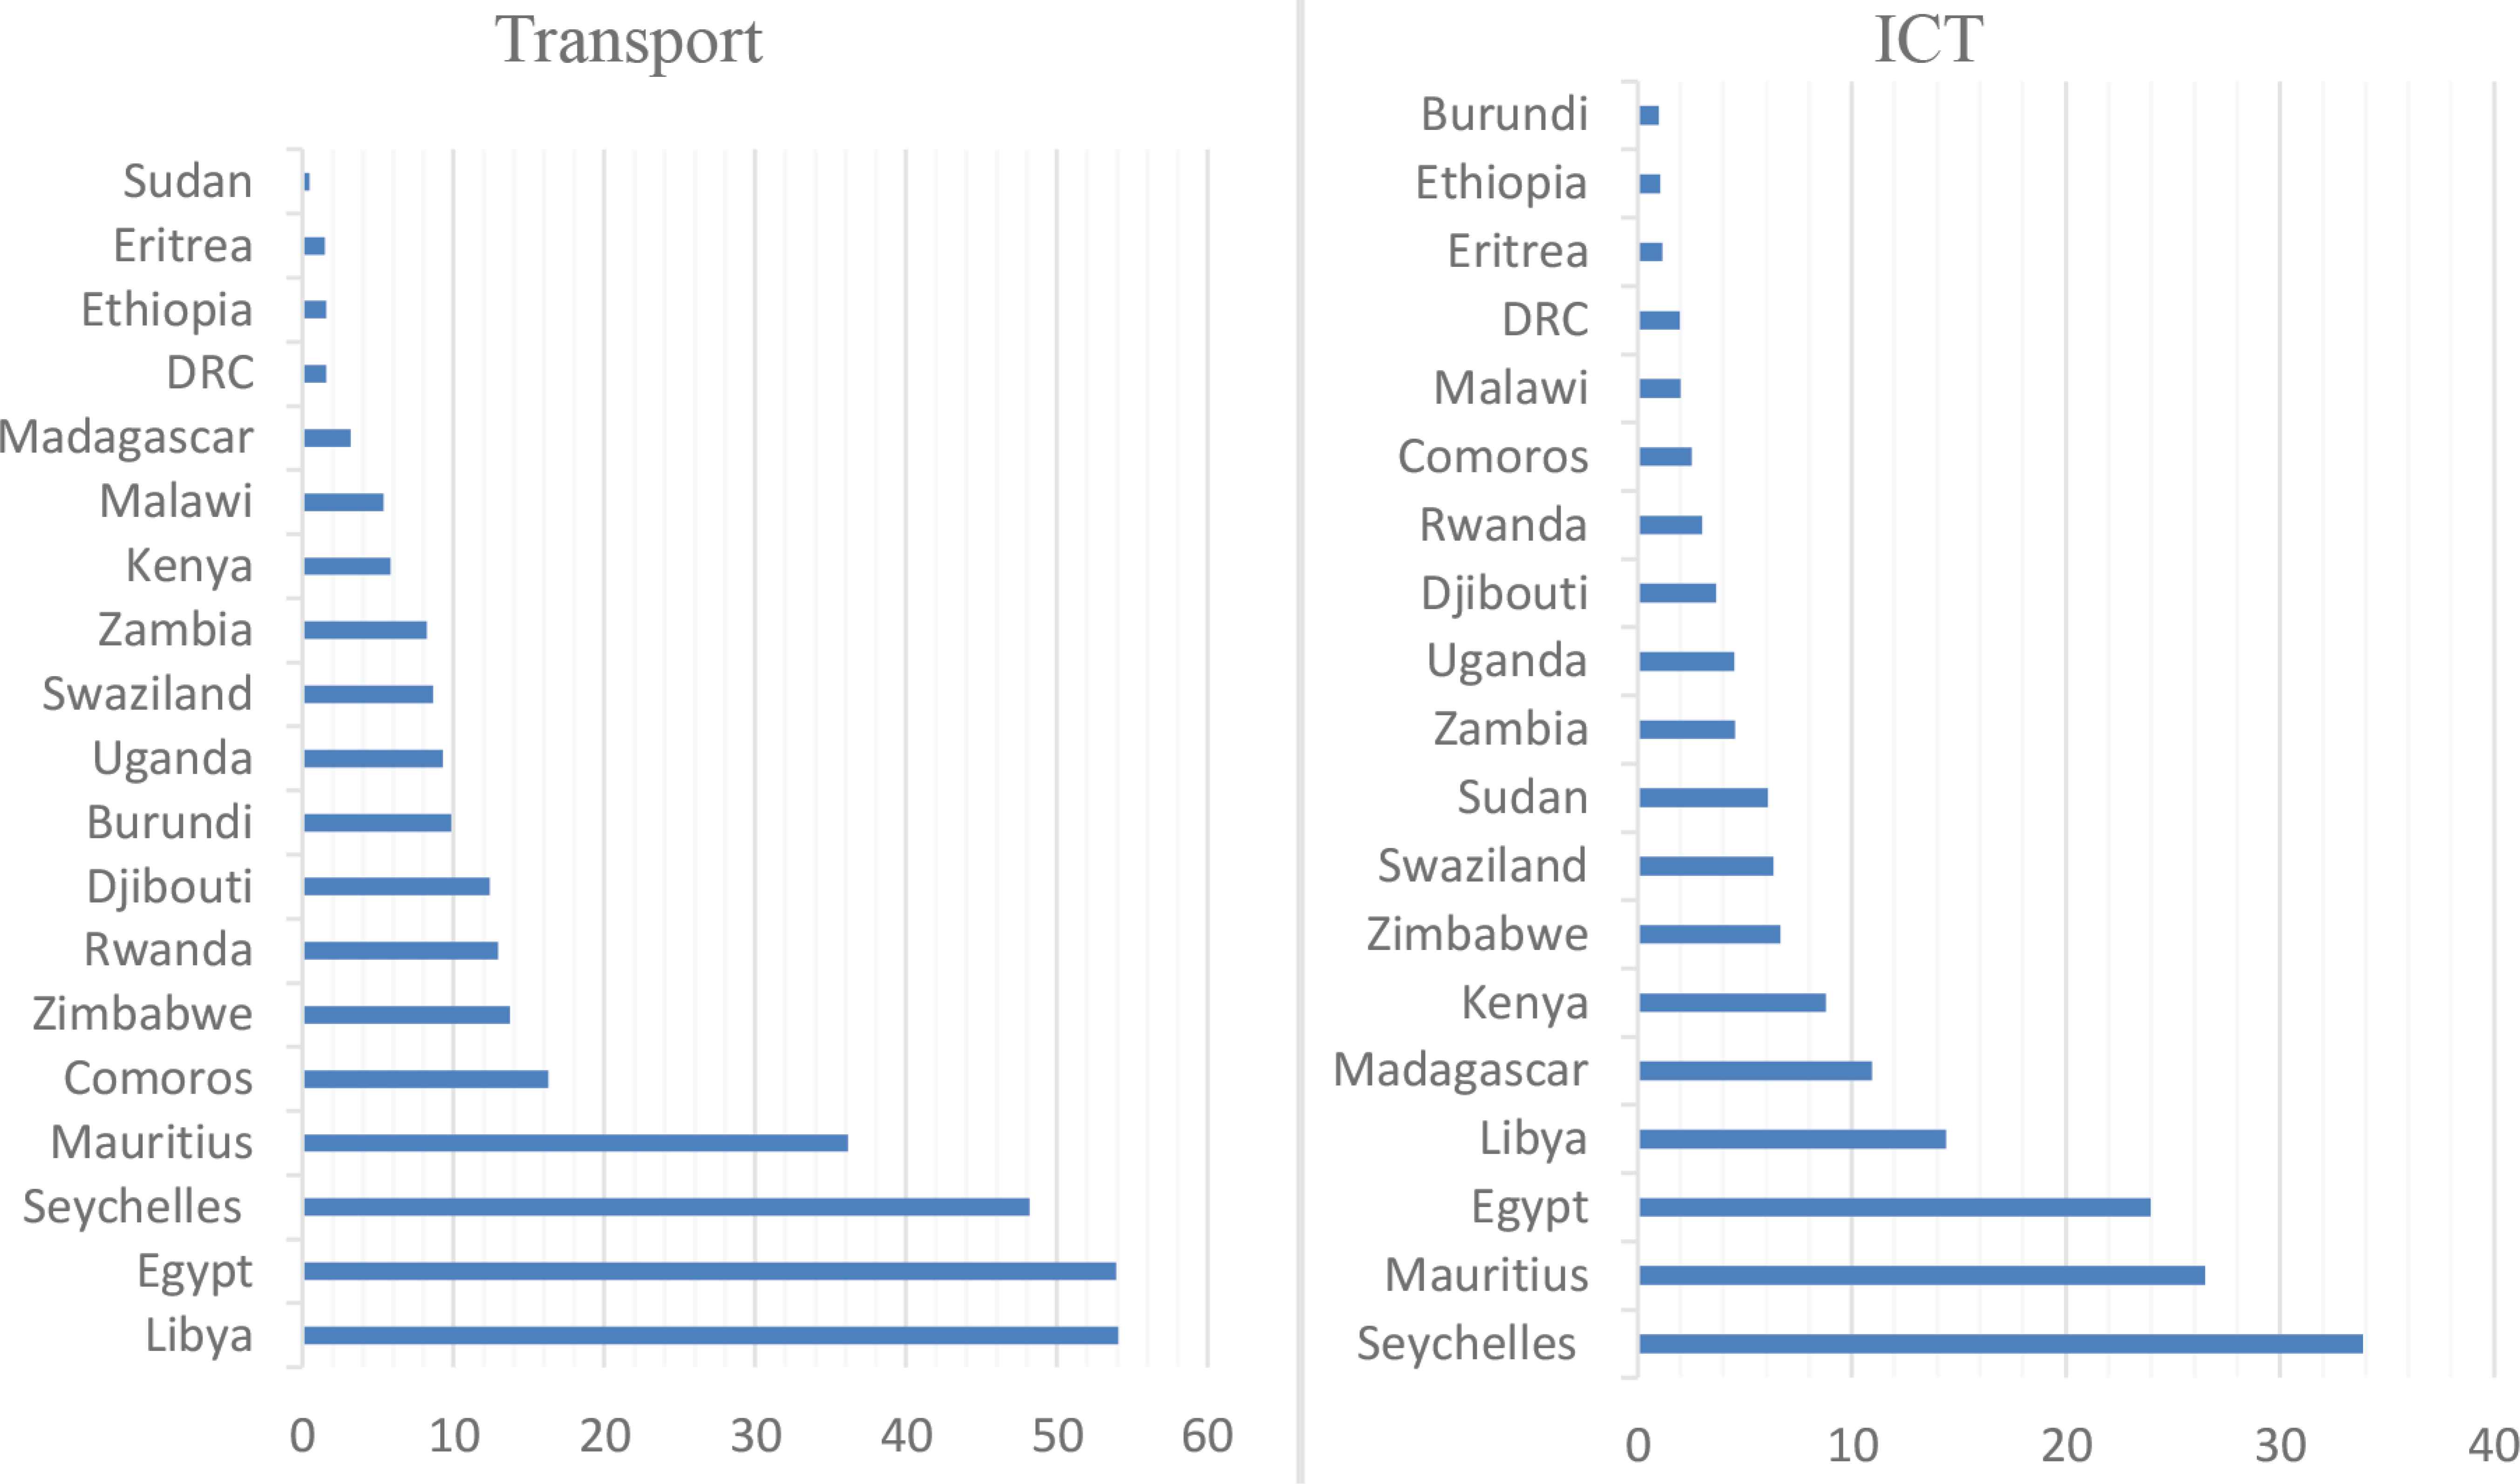
Transport and ICT Infrastructure Composite Indices (2000–2015 Average Scores). Source: Authors’ calculations from the African Infrastructure Development Index (AIDI). Note: Higher scores reflect better quality and quantity of infrastructure.
Footnotes
The founding members of the COMESA FTA were Djibouti, Egypt, Kenya, Madagascar, Malawi, Mauritius, Sudan, Zambia, and Zimbabwe. Rwanda and Burundi joined in 2004, Comoros and Libya in 2006, Seychelles in 2009, and Uganda in 2012.
Author’s calculations from COMSTAT database
The standard CS assumes that the slopes and intercepts are the same for all country pairs.
The standard PSC also imposes the same slopes for all country pairs but allows for the intercepts to vary over time.
The bigger the economy, the higher its productive capacity and market size.
The higher the income level, the bigger the purchasing power.
GLS can be defined as OLS on the transformed variables that satisfy the standard OLS assumptions (Gujarati, 2004).
See individual countries’ key exports and imports and their destinations and origins, respectively, in the COMESA International Trade Statistics Bulletins (2012 and 2013) and the World Trade Atlas: http://atlas.media.mit.edu/en/profile/country/egy/.
REFERENCES
Cite this article
TY  - JOUR
AU  - Grace Gondwe
PY  - 2021
DA  - 2021/03/22
TI  - Regional Integration and Trade: The Case of the Common Market for Eastern and Southern Africa (COMESA) Free Trade Area
JO  - Journal of African Trade
SP  - 1
EP  - 12
VL  - 8
IS  - 1
SN  - 2214-8523
UR  - https://doi.org/10.2991/jat.k.210311.001
DO  - 10.2991/jat.k.210311.001
ID  - Gondwe2021
ER  -