
Seasonal Activity of Influenza in Iran: Application of Influenza-like Illness Data from Sentinel Sites of Healthcare Centers during 2010 to 2015
- DOI
- 10.2991/j.jegh.2018.08.100How to use a DOI?
- Keywords
- CUSUM; influenza; Iran; outbreak; public health surveillance
- Abstract
This study aimed to predict seasonal influenza activity and detection of influenza outbreaks. Data of all registered cases (n = 53,526) of influenza-like illnesses (ILIs) from sentinel sites of healthcare centers in Iran were obtained from the FluNet web-based tool, World Health Organization (WHO), from 2010 to 2015. The status of the ILI activity was obtained from the FluNet and considered as the gold standard of the seasonal activity of influenza during the study period. The cumulative sum (CUSUM) as an outbreak detection method was used to predict the seasonal activity of influenza. Also, time series similarity between the ILI trend and CUSUM was assessed using the cross-correlogram. Of 7684 (14%) positive cases of influenza, about 71% were type A virus and 28% were type B virus. The majority of the outbreaks occurred in winter and autumn. Results of the cross-correlogram showed that there was a considerable similarity between time series graphs of the ILI cases and CUSUM values. However, the CUSUM algorithm did not have a good performance in the timely detection of influenza activity. Despite a considerable similarity between time series of the ILI cases and CUSUM algorithm in weekly lag, the seasonal activity of influenza in Iran could not be predicted by the CUSUM algorithm.
HIGHLIGHTS
- •
Activity of influenza in Iran could not be predicted by CUSUM algorithm.
- •
The majority of the outbreaks occurred in winter and autumn.
- •
CUSUM algorithm did not have a good performance in detection of influenza outbreaks.
- •
- Copyright
- © 2018 Atlantis Press International B.V.
- Open Access
- This is an open access article under the CC BY-NC license (http://creativecommons.org/licences/by-nc/4.0/).
1. INTRODUCTION
Influenza is one of the main causes of mortality around the world. Influenza as an epidemic-prone disease causes major economic effects due to hospitalization and absenteeism from work and school. Influenza causes 3–5 million cases annually. Influenza is a major concern of public health, with more than 250–500 thousand deaths in the world and more than 200 thousand hospitalizations in the United States [1–6].
Influenza is an acute viral infection which affects the nose, throat, bronchi, and sometimes the lungs. The infection usually lasts for a week and it has a sudden onset with symptoms such as high fever, muscle pain, headache, cough, sore throat, and weakness. The influenza virus is transmitted through respiratory droplets from person to person. There are three types of seasonal influenza viruses: A, B, and C virus. Influenza type A (H3N2) and A (H1N1) are now circulating among humans. Influenza outbreaks occur in the winter. The average duration of seasonal influenza is 15–16 weeks [4,7,8].
Accurate prediction of the seasonal activity of influenza is important for public health authorities because it is an epidemic-prone disease. The role of timely detection of influenza outbreaks is evident in effective implementation of interventions to control outbreaks. The implementation of syndromic surveillance systems, by using outbreak detection methods, enabled the identification of possible outbreaks of influenza. Influenza surveillance systems attempt to monitor aberrations of influenza-like illness (ILI) cases as a proxy of influenza activity. Seasonal activity of influenza could be detected early using outbreak detection methods/algorithms such as the cumulative sum (CUSUM) algorithm as an appropriate method [9–11]. However, there are many different tools for early detection of influenza-related outbreaks, which utilize both clinical and nonclinical data [11–20].
This study aimed to predict the seasonal influenza activity and detection of influenza outbreaks from 2010 to 2015 using the CUSUM algorithm.
2. MATERIALS AND METHODS
The data of all registered cases of ILI from sentinel sites of healthcare centers in Iran from January 2010 to December 2015, which were reported to the World Health Organization (WHO) on a weekly basis, were obtained from the FluNet web-based tool, WHO (http://www.who.int/influenza/gisrs_laboratory/flunet/en). An ILI case is defined as “a person with fever, cough, and acute respiratory syndrome.” During the study period, 53,526 cases of ILI from Iran were registered at FluNet [21].
The status of the ILI activity, including sporadic, endemic, and local outbreaks, was obtained from the FluNet and considered as the gold standard of the seasonal activity of influenza during the study period. Epidemiological profiles of the ILI cases and influenza cases (week of occurrence, season, year, and type of positive cases) were presented using descriptive statistics and a time series graph.
The CUSUM, as an outbreak detection method, was used to analyze the ILI data for early detection of the seasonal activity of influenza. The main reason for using CUSUM to apply ILI data in this work is its potential for better sensitivity to timely detection of outbreaks. The CUSUM statistics was estimated using Equation (1) [22–24]:
Time series similarity was also assessed between the ILI trend and CUSUM using the cross-correlogram. In practice, the ability of CUSUM to predict influenza-related outbreaks was assessed by the degree of similarity between the ILI trend and CUSUM using the cross-correlogram. Staff of surveillance systems can monitor the trend of CUSUM using the cross-correlogram to detect any aberration from the usual trend of ILI data. Accordingly, CUSUSM, as an outbreak detection tool, predicts potential outbreaks that might be missed by observation of raw data of ILI as a proxy of influenza activity. It is evident that the main aim of this work is prediction and early detection of outbreaks, not forecasting of time series data on ILI or confirmed cases of influenza.
3. RESULTS
There were 53,526 ILI cases from 2010 to 2015. Of 7684 (14%) positive cases of influenza, 5497 (71%) cases were type A and 2187 (28%) cases were type B virus. Some 32% of ILI cases from sentinel sites in Iran were registered in 2015. Influenza type A was the most prevalent detected type in comparison with other types of confirmed cases in 2015. However, type B was the most prevalent type in 2011. Table 1 shows the frequency distribution of ILI and influenza cases by the influenza type and year of occurrence. The highest number of ILI cases occurred in 2015 and the lowest number, 4353 cases, was seen in 2012. Among the positive cases of ILI as influenza cases, type A virus was more prevalent in comparison with type B influenza virus (Table 1).
| Year | ILI cases (N = 53,526) n (%) | Influenza cases by type | n (%)a |
|---|---|---|---|
| 2010 | 7062 (13.0) | Type A | 257 (45) |
| Type B | 310 (55) | ||
| Negative ILI cases | 6495 | ||
| 2011 | 10,055 (19.0) | Type A | 1102 (55) |
| Type B | 900 (45) | ||
| Negative ILI cases | 8053 | ||
| 2012 | 4353 (8.0) | Type A | 473 (80) |
| Type B | 120 (20) | ||
| Negative ILI cases | 3760 | ||
| 2013 | 8321 (15.5) | Type A | 289 (70) |
| Type B | 126 (30) | ||
| Negative ILI cases | 7906 | ||
| 2014 | 6719 (12.5) | Type A | 419 (61) |
| Type B | 263 (39) | ||
| Negative ILI cases | 6037 | ||
| 2015 | 17,016 (32.0) | Type A | 2957 (86) |
| Type B | 468 (14) | ||
| Negative ILI cases | 13,591 |
Percentage was calculated for the positive cases of ILI; ILI, influenza-like illness.
Frequency distribution of influenza-like illness and influenza cases by the influenza type and year of occurrence in Iran
In the case of seasonal occurrence, more than 52% of the ILI cases occurred during winter, followed by 31% during autumn. Results revealed that influenza led to local outbreaks during 80 weeks in Iran and more than half of these outbreaks occurred in winter. About 52% of ILI cases occurred in winter according to registered data at FluNet. Influenza had a sporadic activity in Iran during 201 weeks from 2010 to 2015. Details on the distribution of ILI and influenza cases by the influenza type and ILI activity are shown in Table 2.
| Seasons | ILI | Type of positive ILI cases | ILI activity | |||||
|---|---|---|---|---|---|---|---|---|
| A type | B type | A and B | Sporadic | Local outbreak | No report | No activity | ||
| Spring | 6456 (12.06) | 225 (4.09) | 452 (20.67) | 677 (8.81) | 68 (33.83) | 9 (11.25) | 4 (14.29) | 0 |
| Summer | 2374 (4.44) | 40 (0.73) | 54 (2.47) | 94 (1.22) | 69 (34.32) | 0 (0.00) | 13 (46.42) | 3 (75) |
| Autumn | 16,763 (31.32) | 2480 (45.12) | 727 (33.24) | 3207 (41.74) | 43 (21.39) | 25 (31.25) | 6 (21.42) | 1 (25) |
| Winter | 27,933 (52.19) | 2752 (50.06) | 954 (43.62) | 3706 (48.23) | 21 (10.44) | 46 (57.50) | 5 (17.75) | 0 |
| Total | 53,526 (100) | 5497 (100) | 2187 (100) | 7684 (100) | 201 (100) | 80 (100) | 28 (100) | 4 (100) |
Data are presented as n (%).
Frequency distribution of influenza-like illness (ILI) and influenza cases by the influenza type and ILI activity from 2010 to 2015 in Iran
The results of the present study showed that there was a considerable similarity between time series graphs of ILI cases and CUSUM values at different values of fixed parameters. This finding reveals that CUSUM was able to detect potential outbreaks of influenza in a timely manner in comparison with routine monitoring of raw data on ILI. The corresponding graphs for fixed parameters with h = 2.5, 1.5, and 0.25 are shown in Figs. 1–3, respectively. However, the CUSUM algorithm did not have a good performance in timely detection of the seasonal activity of influenza.
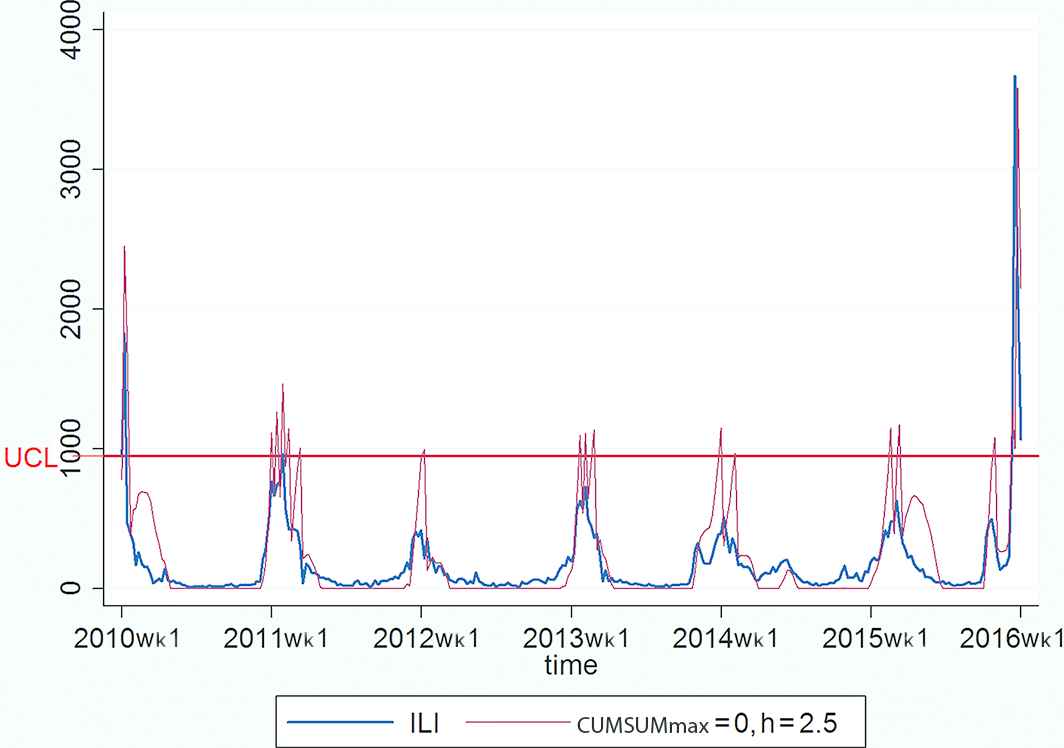
Time series graphs of the cumulative sum (CUSUM) algorithm using a fixed parameter (h = 2.5) and influenza-like illness (ILI) cases during 2010 and 2015
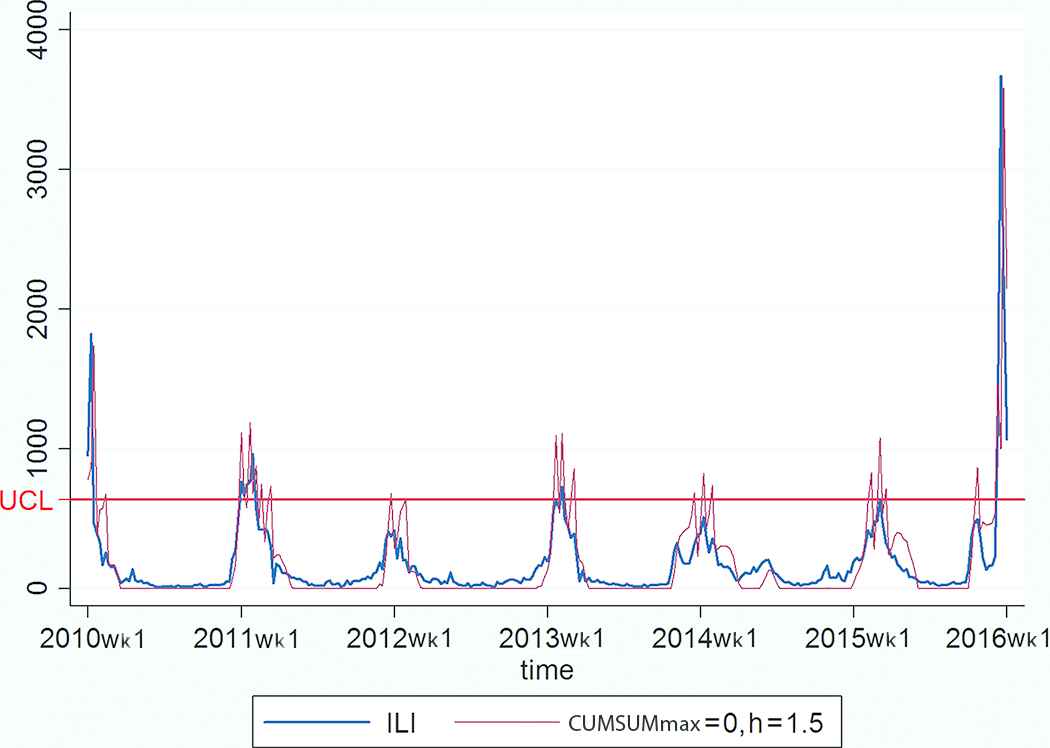
Time series graphs of the cumulative sum (CUSUM) algorithm using a fixed parameter (h = 1.5) and influenza-like illness (ILI) cases during 2010 and 2015
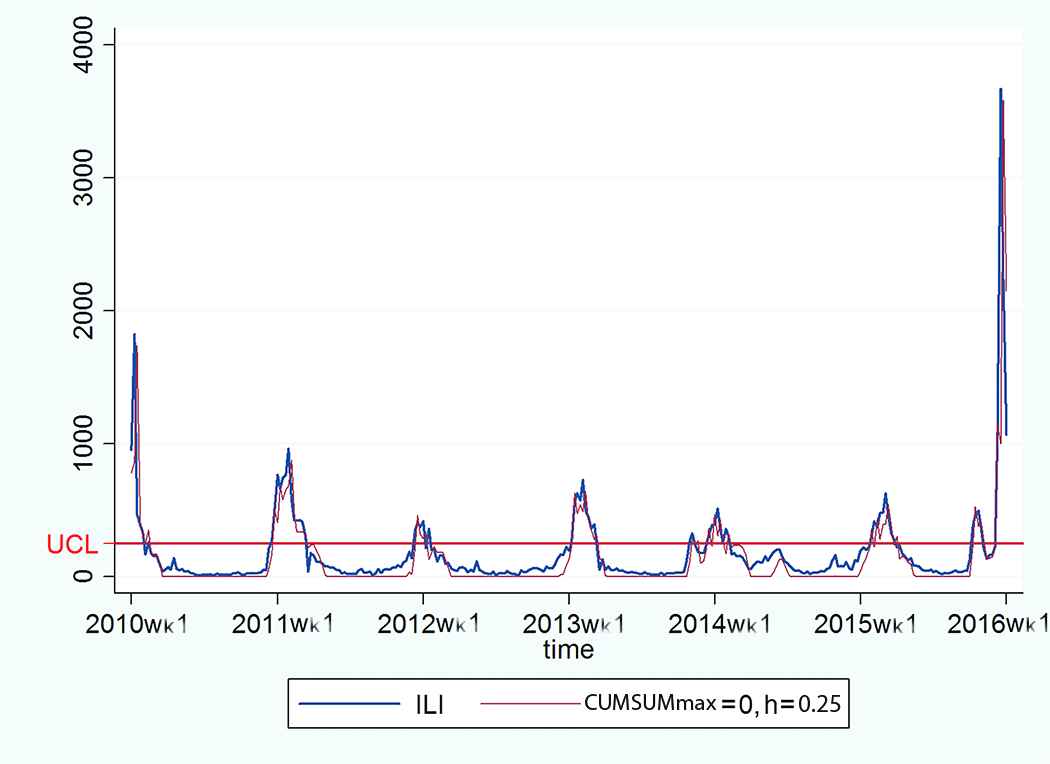
Time series graphs of the cumulative sum (CUSUM) algorithm using a fixed parameter (h = 0.25) and influenza-like illness (ILI) cases during 2010 and 2015
There was a considerable similarity between time series of the ILI cases and the CUSUM algorithm in weekly lag (Figs. 4 and 5). The results of the cross-correlogram showed that the highest coefficient of correlation between time series was seen at lag + 1 with 0.94, and the lowest magnitude was 0.83. This finding indicates that CUSUM was able to detect influenza-related outbreaks early in comparison with routine monitoring of raw data on ILI. However, there was a weekly lag between alarms of outbreak onset by CUSUM and the status of the ILI activity as the gold standard of the seasonal activity of influenza.
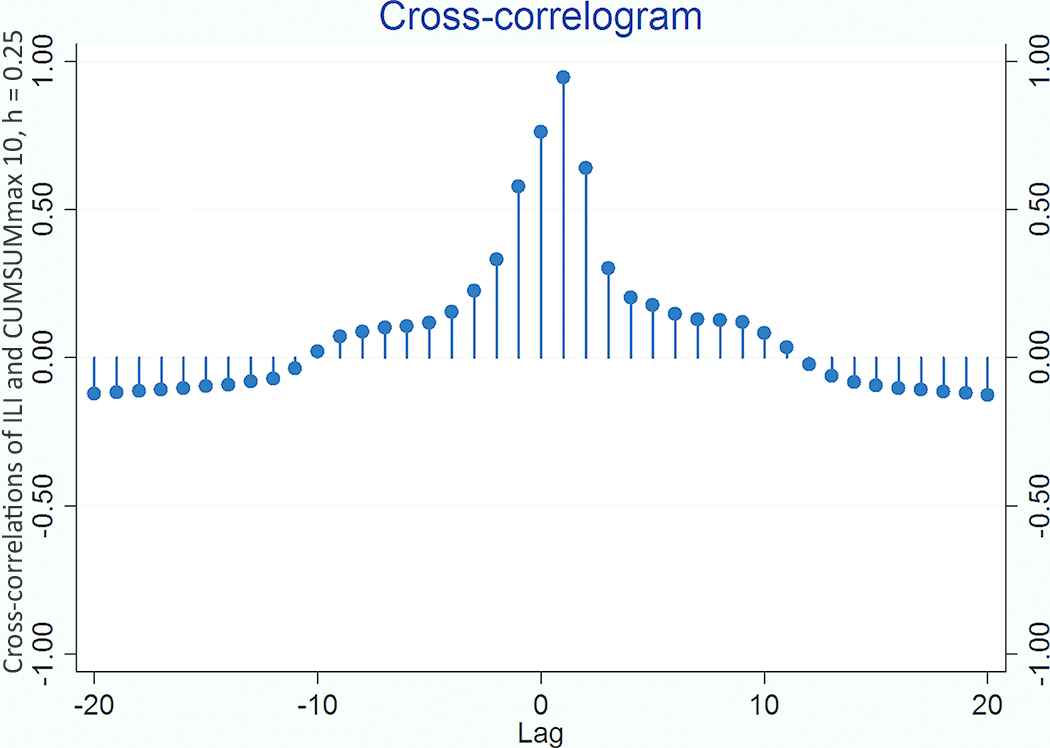
Cross-correlation between the influenza-like illness (ILI) cases and cumulative sum (CUSUM) algorithm in weekly lag with fixed coefficient (h) = 0.25
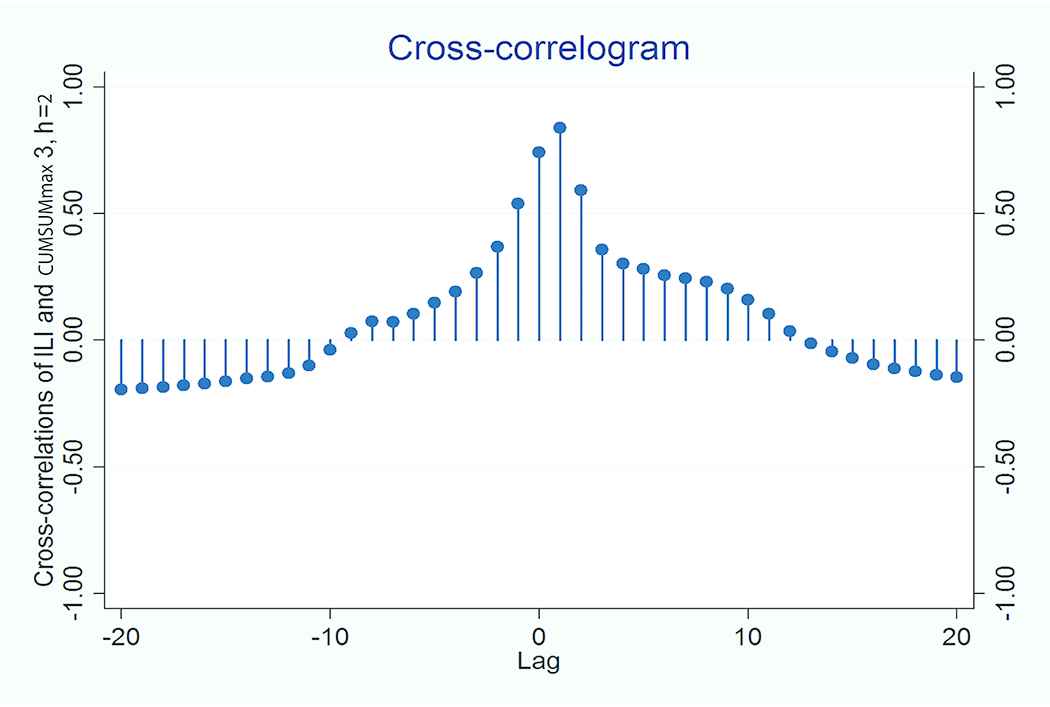
Cross-correlation between the influenza-like illness (ILI) cases and cumulative sum (CUSUM) algorithm in weekly lag with fixed coefficient (h) = 2
4. DISCUSSION
Sentinel surveillance of common respiratory infections is a useful approach because of the high prevalence of such diseases. In the case of influenza, WHO utilizes sentinel surveillance systems worldwide and registers both ILI cases and positive cases of influenza. It is evident that such surveillance systems have some weaknesses, especially regarding timely detection of influenza outbreaks. However, there are sentinel ILI reporting sites in Iran which report both ILI and influenza cases to WHO; this is in accordance with similar studies [27,28]. These studies have reported that the proportions of positive influenza among the ILI cases were 14.1% and 16.2%. Nevertheless, there are some studies that reported different proportions of positive influenza among the ILI cases [29,30].
Of 7684 (14%) positive cases of influenza, about 71% were type A and 28% were type B virus. Results of a similar study in Australia revealed that type A with 71% was more prevalent in comparison with other types of the positive cases of influenza [31].
This study demonstrated that the seasonal activity of influenza and occurrence of outbreaks are limited to winter and autumn. This epidemiological profile of influenza in Iran is similar to that in the published literature. For example, Durand et al. [32] reported that half of human influenza cases occurred from January to March. This finding was reported during 2004–2013.
In addition to addressing the epidemiological profile of ILI and influenza, another key finding of our study was applying the CUSUM algorithm to the potential prediction of the seasonal activity of influenza in Iran. Capabilities of the CUSUM algorithm in timely detection of aberrations have been investigated on health data [24,26,33–35]. Our study focused on the potential application of CUSUM for early detection of any change/aberration on the time series of the ILI cases. Published literature has reported adequacy of the CUSUM performance [36–39]. However, such similar studies did not report the appropriate timeliness of CUSUM. Accordingly, the results of our study are in accordance with those of other studies, especially regarding a considerable similarity between time series graphs of the ILI cases and CUSUM algorithm values.
Further studies should be conducted to investigate the potential performance of CUSUM and other outbreak detection methods on the ILI cases, especially at daily lag instead of weekly lag, as one of the limitations of this study.
5. CONCLUSION
Despite a considerable similarity between the time series of the ILI cases and CUSUM algorithm in weekly lag, the seasonal activity of influenza in Iran could not be predicted by the CUSUM algorithm. Further studies are required to assess the capability of CUSUM using the ILI data at daily lag instead of a weekly report.
AUTHORS’ CONTRIBUTIONS
MK and SH conceived the idea for the manuscript, conducted the statistical analyses, interpreted the data and drafted the manuscript. MK, SH, MF, and YM conducted the data preparation and analysis. All authors read, provided feedback, and approved the final submitted version of the manuscript.
CONFLICTS OF INTEREST
The authors declare that they have no competing interests.
REFERENCES
Cite this article
TY  - JOUR
AU  - Seyedhadi Hosseini
AU  - Manoochehr Karami
AU  - Maryam Farhadian
AU  - Younes Mohammadi
PY  - 2018
DA  - 2018/12/31
TI  - Seasonal Activity of Influenza in Iran: Application of Influenza-like Illness Data from Sentinel Sites of Healthcare Centers during 2010 to 2015
JO  - Journal of Epidemiology and Global Health
SP  - 29
EP  - 33
VL  - 8
IS  - 1-2
SN  - 2210-6014
UR  - https://doi.org/10.2991/j.jegh.2018.08.100
DO  - 10.2991/j.jegh.2018.08.100
ID  - Hosseini2018
ER  -