
An Exposure Appraisal of Outdoor Air Pollution on the Respiratory Well-being of a Developing City Population
- DOI
- 10.2991/j.jegh.2018.04.002How to use a DOI?
- Keywords
- Air pollution; respiratory health; Zaria
- Abstract
Zaria is the educational hub of northern Nigeria. It is a developing city with a pollution level high enough to be ranked amongst the World Health Organization’s (WHO) most polluted cities. The study appraised the influence of outdoor air pollution on the respiratory well-being of a population in a limited resource environment. With the approved ethics, the techniques utilized were: portable pollutant monitors, respiratory health records, WHO AirQ+ software, and the American Thoracic Society (ATS) questionnaire. They were utilized to acquire day-time weighted outdoor pollution levels, health respiratory cases, assumed baseline incidence (BI), and exposure respiratory symptoms among selected study participants respectively. The study revealed an average respiratory illness incidence rate of 607 per 100,000 cases. Findings showed that an average of 2648 cases could have been avoided if the theoretical WHO threshold limit for the particulate matter with diameter of <2.5/10 micron (PM2.5/PM10) were adhered to. Using the questionnaire survey, phlegm was identified as the predominant respiratory symptom. A regression analysis showed that the criteria pollutant PM2.5, was the most predominant cause of respiratory symptoms among interviewed respondents. The study logistics revealed that outdoor pollution is significantly associated with respiratory well-being of the study population in Zaria, Nigeria.
- Copyright
- © 2018 Atlantis Press International B.V.
- Open Access
- This is an open access article under the CC BY-NC license (http://creativecommons.org/licences/by-nc/4.0/).
1. INTRODUCTION
Clean air is extremely essential for human well-being [1]. Ambient air quality remains a major concern in developing cities with limited pollution monitoring capabilities [2]. The spatial and temporal classification of city-scale ambient air quality is vital from any respiratory epidemiological standpoint [3]. Estimates have put respiratory infections as the cause of nearly 20% of mortality in children younger than 5 years, with a sizeable portion of the dilemma experienced by populations in Africa and Asia [4]. Managing air pollution can be very complex, especially as it revolves around the intricacy of emission sources, implementation strategy concerns, and scarce means for regulating and pursuance [5]. These difficulties, combined with the hurried demand for technological advancement in many countries, have resulted in global concern on possible vulnerability from air pollution [6,7].
Anthropogenic emissions are the largest contributors of urban outdoor air pollution as they emit various kinds of petrochemical gases into the atmosphere [8–10]. The atmospheric air quality plays a crucial role in population health as its pollution is projected to be responsible for 3.2% of the worldwide burden of diseases [11]. Other than conventional respiratory illnesses, poor air quality is also reported to be linked with nonrespiratory health conditions such as, diabetes [12], stroke [13], and infertility [14].
Strategies are being identified for reducing population exposure to air pollution. They include: restricting air pollution emitters, technological upgrade on emitters to cut or eradicate emissions, and creating health risks alertness of pollution exposure to population [15–17]. The idea of restriction or technological upgrades of air pollution sources can be strenuous to enforce or probably not in line with the paradigms of the state, such as restrictions that may end up minimizing economic output [18]. Providing health hazard awareness on air pollution is a concrete first step for policies that find it tasking to revolutionize their present emission status and if executed properly, it will provide health benefits [19].
In Nigeria, atmospheric pollution and its burden of respiratory diseases is still a serious menace in many of its metropolitan cities. This is mainly due to expended vehicles, general use of the single-engine motorcycles for shuttling commuters, traffic congestions, and the natural north-easterly harmattan which all combine to generate high levels of localized air pollution that can affect population health [20]. With Nigerian cities now beginning to rank among the top most polluted in the world [11], it is worth noting that researches are identifying increased occurrence of respiratory disease symptoms in individuals exposed to this pollution [21–23].
This study is a step in confronting public concerns as it aims to evaluate the influence of outdoor air pollution on interim respiratory well-being within a limited resource environment. To achieve this, it is necessary to (1) first assess the present air pollution levels within the study population; (2) determine the theoretical attributable risk proportion using the available respiratory health outcome information and the measured exposure level; and (3) establish whether outdoor air pollutant exposure is significantly associated with the respiratory symptoms within the study population. For reliable theoretical influence, pollution epidemiology studies require pollution and health outcome data covering a reasonable time-frame. This study hopes to provide a scientific basis for air pollution regulation in a local metropolis of Nigeria.
2. MATERIALS AND METHODS
2.1. Study Area
This study was conducted in Zaria metropolitan area, northern Nigeria (Figure 1). Zaria metropolis consists of two local government districts (Zaria and Sabon Gari) and occupies an area of ~296.036 km2. It is the educational hub of northern Nigeria. The topography is mainly flat with a mean height of 670 m above mean sea level (MSL). The climate comprises of the dry (October–May) and wet (June–September) seasons. The lowest temperature is 14.1°C and maximum average is 35.2°C during the harmattan (January) and heat (April) seasons. The population in 2016 was estimated to be 938,521 using the 2006 population census and a 3% growth rate [24]. The western areas are sparsely vegetated around the Kufena Hills. The main water body in the study area is the River Kubanni.
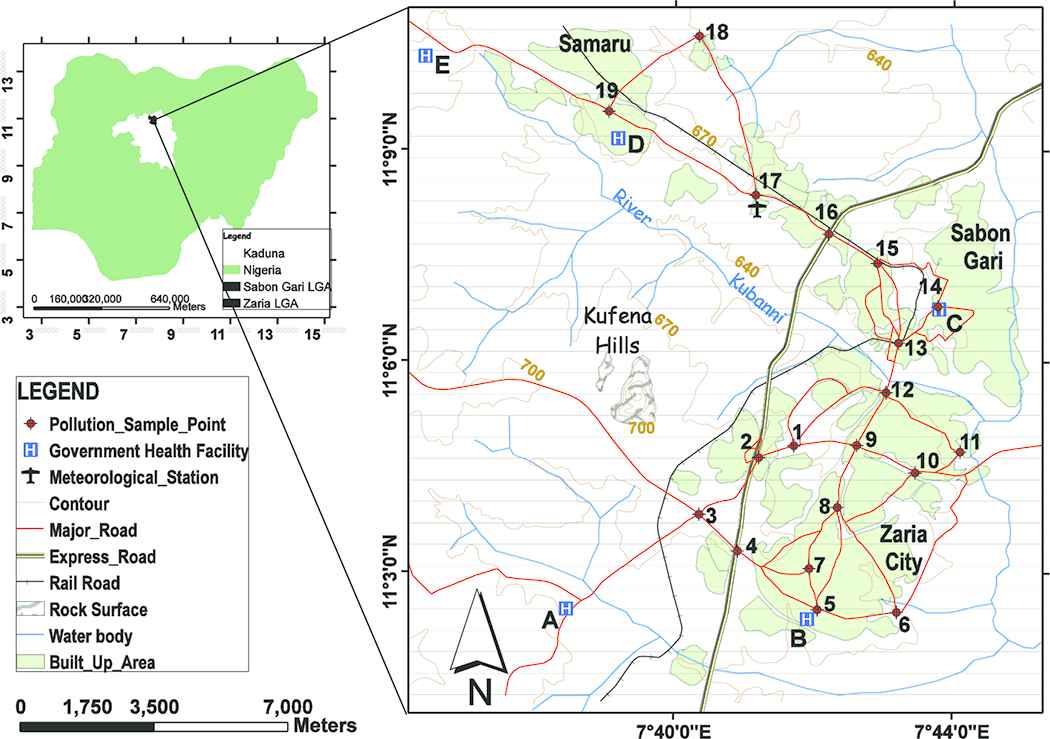
The study area showing the distribution of pollution sample sites and government health facilities from which respiratory health records were obtained
2.2. Ethics
Research protocols were endorsed by the Kaduna State Ministry of Health Research Ethics Committee (MOH/ADM/744/VOL.1/448); Ahmadu Bello University Teaching Hospital Health Research Ethics Committee (ABUTH/HREC/CL/05) within the study area and the Faculty of Natural and Agricultural Sciences Ethical Committee at the University of Pretoria, South Africa (EC170124-092).
2.3. Data Collection
To appraise the influence of outdoor air pollution on respiratory well-being within the study area, four categories of datasets were obtained. They are described as follows.
2.3.1. Outdoor pollution data
With the design of numerous handy cost effective devices for monitoring airborne contaminants [25–27], this study utilized portable air quality monitors to collect pollution data. The sample monitors were: The MSA Altair 5 × and the CW-HAT200 particulate counter are manufactured by the Mine Safety Appliances Company, Pennsylvania, USA and the Shenzhen Chinaway Environmental Technologies Co. Ltd, Guangdong, China respectively (Figures 2A and 2B). The MSA Altair collects criteria pollutants: carbon monoxide (CO) and sulfur dioxide (SO2), measured in parts per million (ppm) whereas the CW-HAT200 collects particulate matter PM2.5 and PM10 in micrograms per cubic meter (μg/m−3). The portable pollutant devices were validated (R > 0.96) before commencement of proper sampling. The World Health Organization (WHO) filter sampling procedure, described in Efe and Efe [28], was adopted to validate the portable devices used in this study. A total of 19 sample sites distributed across the study area, were utilized to routinely observe air pollution concentrations, 3-epochs daily [29,30]. The duration of the outdoor sampling was from December 1, 2015 to November 30, 2016. The sites were situated along the major road intersections. A total of 16 sites were positioned within dense population activities which cut across the residential and commercial settlements, whereas the remaining three control sites were positioned strategically at the outskirts of the city with minimal population activity. The control sites were embraced to aid in the result comparison.
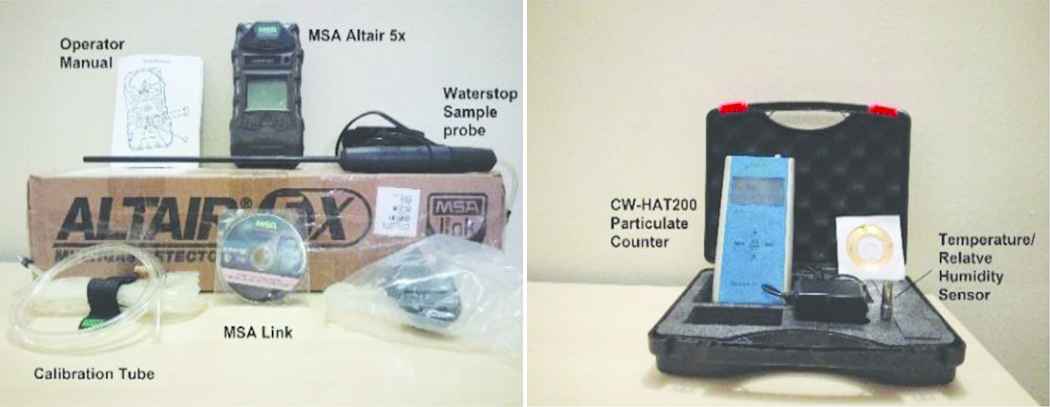
Portable air pollutant detectors (MSA Altair 5×/Chinaway CW-HAT200)
2.3.2. Attributable risk data
The health records of respiratory illnesses utilized in this study were restricted to the five major government-owned health facilities in the study area. This is because, they are the most medically equipped thus most likely to handle referral cases. They are also cost-effective for all patients to access medical treatment. The facilities are: National Tuberculosis and Leprosy Training Centre, Hajiya Gambo Sawaba General Hospital, Major Ibrahim A. Abdullahi Memorial Hospital, Ahmadu Bello University Medical Centre, and Ahmadu Bello University Teaching Hospital (Figure 1A–E). The data obtained comprised of reported cases from the health facility records, for varying age brackets and death occurrences for case fatality rate (CFR) computations. The obtained data were used to determine the attributable risk proportion using the AirQ+ software designed by the World Health Organization (WHO), Europe regional office.
To ascertain the theoretical attributable risk proportion (AP) of respiratory illnesses on the Zaria population, we adopted the input files embedded into the WHO air quality AirQ+ software. The inputs adopted include peer-reviewed relative risk (RR) estimates, mathematical formulae, and WHO stipulated limits. The WHO encourages the use and dissemination of information using the software. Several studies have corroborated the use of the software [31–34]. The validated AirQ+ software quantifies possible respiratory health effects resulting from exposure to pollutant within any study area. This is achieved by computing the ratio of traceable health outcomes resulting from exposure to atmospheric pollutant(s), for a defined population. It hypothesizes the relationship between exposure and health consequence, with no significant discountenance. The assumed AP can be derived using the formulae (1) [35].
RR(s) is the relative risk for the health outcome difference that can be calculated using Eq. (2); p(s) is the fraction of the population all in exposure class s, depending on the varying level of exposure within the field of study.
C is pollutant concentration in air, T is the WHO stipulated limit for detected pollutant; RR is the relative risk derived from the exposure–response function for selected health outcomes generated from local epidemiological studies.
To determine the rate and the estimated number of cases attributable to the pollution exposure, Eqs. (3) and (4) were utilized, taking into consideration that the theoretical baseline frequency of endpoint (incidence) and population size are known, respectively [33]. A baseline incidence is a theoretical threshold derived using mathematical procedures, to determine if an epidemic incidence is in excess [36].
IE is the rate of the health outcome related to the exposure, I is the baseline frequency of the health endpoint in the population.
NE is the number of cases attributed to the exposure, and N refers to the size of the investigated population.
2.3.3. Questionnaire survey data
As a predictive indicator to analyse on-the-spot respiratory well-being resulting from outdoor pollution exposure, a respiratory indicator-based questionnaire was utilized to investigate respiratory symptoms from respondents. The American Thoracic Society Division of Lung Disease questionnaire (ATS-DLD-78A) [37] is a universally accepted process for detecting respiratory warning signs in a population. The design comprises questions related to recurrent respiratory indicators such as cough, phlegm, wheeze, and breathlessness. The questionnaire has been utilized by various studies [38–41], to achieve their objectives. In our study, we applied a modified version of the questionnaire for adults, to trace the manifestation of respiratory symptoms. It comprises questions pertaining to the occurrence of cough/phlegm for the most part of ≥3 consecutive months within a year; wheeze (noisy breath resulting in breathing difficulty on most days or only during the cold season); breathlessness Grade I, (rapid breathing as a result of hastening on a level or pacing up a slight hill) and Grade II (not being able to walk at the same pace with one’s age class on a level or pausing for breath when strolling at own pace on a level). The account of past ailments (described as bronchitis, pneumonia, asthma, emphysema, hay fever confirmed by a doctor) and hereditary likelihoods (described as any of the biological parent who had any chronic lung condition such as chronic bronchitis, asthma, or lung cancer, confirmed by a doctor). We restricted the questionnaire survey to participants that were stationed within 30-m radius of sample sites, for at least 6 hours a day, for the past year (which coincided with our pollution sampling duration). We ensured that their ages were ≥20 years. With this criteria, we could confirm that such participants were mature enough and had been exposed to the recorded concentration levels of pollutants, for a considerable amount of our sample time. The sample size of participants was determined based on the minimum population sample size for research activities [42]. The questionnaire was drafted in the English language and if necessary translated to the Hausa language. The participants had paper-assisted interviews which was controlled for prolonged/already existing respiratory illnesses and likely hereditary symptoms. During the administration process, the investigator ensured that the respondents comfortably and accurately understood the value of all questions, most especially respiratory symptoms, such as phlegm and wheeze. Participants gave verbal and written informed consent. The participants were restricted to non-smoking individuals situated at the selected sample sites, so that the results are not skewed as a result of their personal habits.
2.3.4. Socio-economic influence data
A remote sensing Landsat data were employed to ascertain if socio-economic factors contributed to reports of respiratory well-being within the study period. Landsat data were adopted because it is an independent data that can be freely accessed from the United States Geological Survey (USGS). For our study site, the Landsat 8 at Path/Row 189/52, was acquired from the USGS website ( https://earthexplorer.usgs.gov/ ) for the study period (December 1, 2015–November 30, 2016). To improve accuracy, the image data were restricted to satellite image tiles with <10% cloud cover. Only 10 image files fulfilled the specified criteria for the entire study period. The socio-economic factor can be interpreted in the Landsat data as land surface temperature (LST) and normalized difference vegetation index (NDVI). The derivation techniques for LST and NDVI are described in Sobrino et al. [43] and Xu and Guo [44].
2.4. Data Analysis
The day-time weighted average for observed criteria pollutants was computed for the 1-year running. The spatial data (easting, northings, and elevation) of the sampling points and their individually observed pollution levels were analysed to determine for skewness of sampling position. The spatial distribution of reported respiratory symptoms were analysed for homogeneity of variance using the Levene’s test. The respiratory health data with variables (age group, sex, and resulting mortality) were subjected to statistical logistics, to determine their association with outdoor pollution exposure through a likelihood ratio test. To determine population exposed response, the ATS questionnaire responses were coded and analysed for all responded respiratory outcomes. The empirical analysis did correct for possible priors and hereditary respiratory traits. A reliability test was also conducted on the ATS questionnaire. All statistical computations were executed in the Microsoft Windows environment using the Microsoft Excel, SPSS 19 software from IBM and Matlab R2014b from MathWorks.
3. RESULTS
The day-time seasonal statistics for CO (ppm), SO2 (ppm), PM2.5 (μg/m−3), and PM10 (μg/m−3) is averaged over the 19 sample stations in Zaria, Nigeria during the period December 2015–November 2016 (Figure 3). The 1-year day-time weighted average concentration of criteria pollutants revealed values of 29.22 ppm for CO, 0.32 ppm for SO2, 219.73 μg/m−3 for PM2.5, and 451.89 μg/m−3 for PM10.
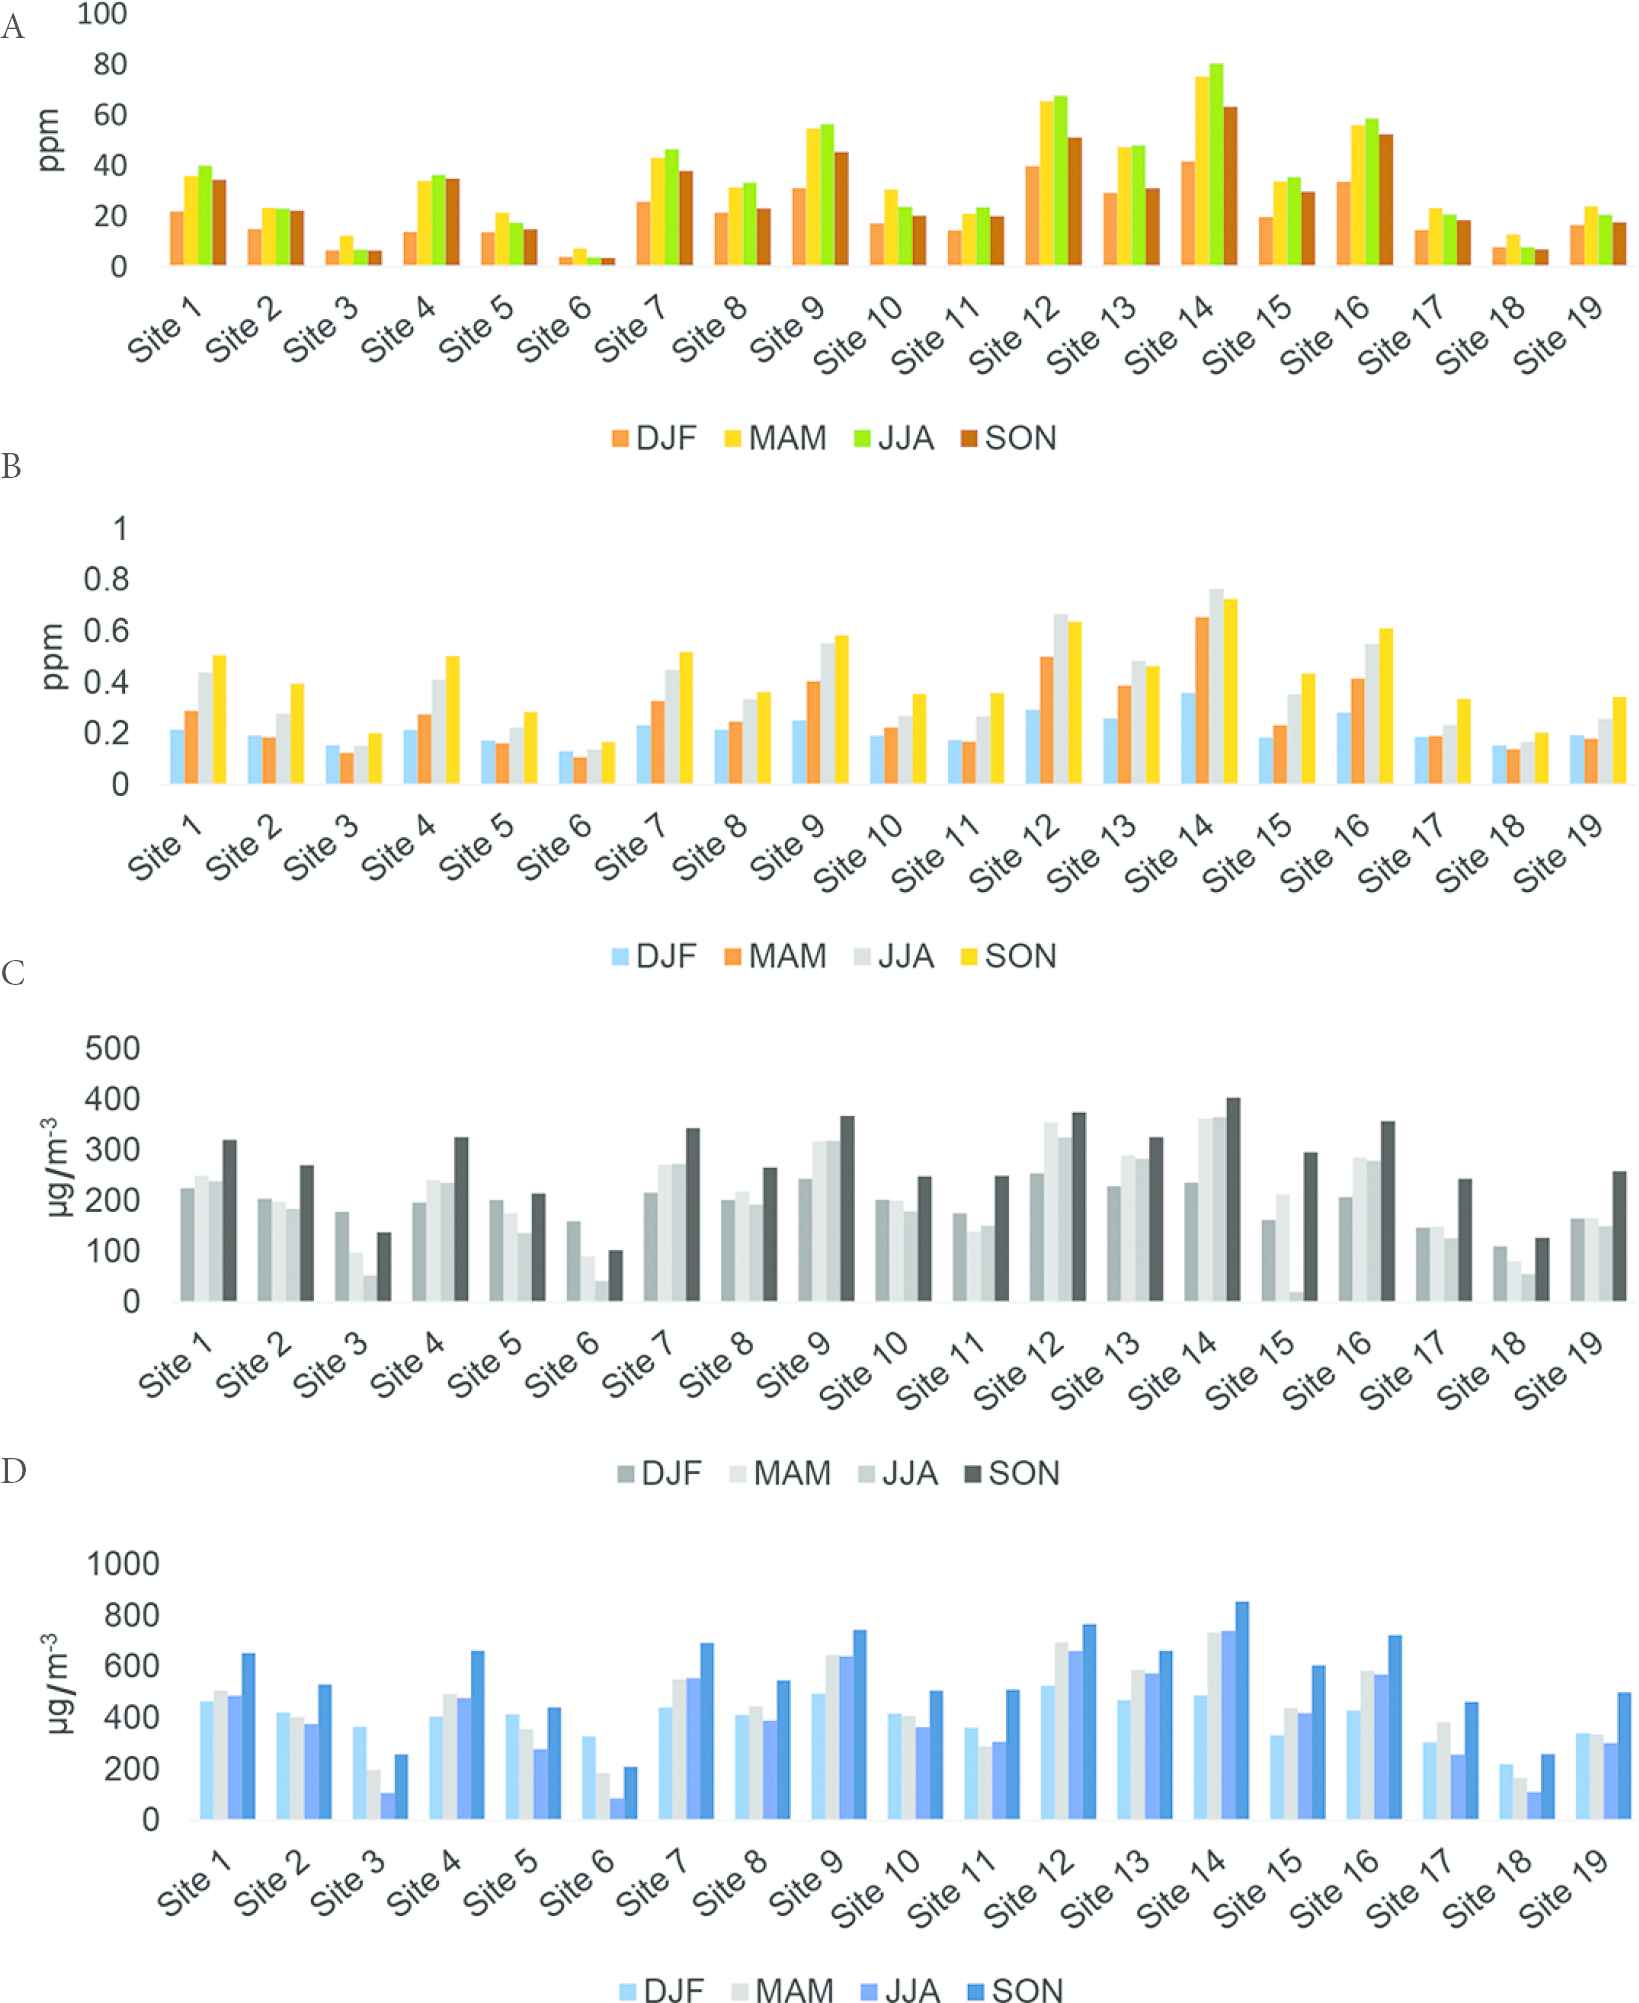
Histogram of seasonal day-time pollutant concentrations across the 19 sampling sites (A) CO; (B) SO2; (C) PM2.5; (D) PM10. (Sites 3, 6, and 18 are control sites). DJF, December–January–February; MAM, March–April–May; JJA, June–July–August; SON, September–October–November
From the health records obtained, an aggregate of 31,042 respiratory related illnesses were reported in the five major government owned health facilities in Zaria metropolis from January 2011 to December 2016 (Table 1). A total of 461 respiratory-related casualties were recorded. All the years of interest (2011–2016) did record respiratory-related deaths, with 2013 having the peak (112 deaths). On average, the CFR was 1.67%, over the study period under investigation.
| Year | Total cases | Case/100,000* | Case (%) | Death | CFR | |||||
|---|---|---|---|---|---|---|---|---|---|---|
| 0–14 years | 15–29 years | 30–44 years | >45 years | Male | Female | |||||
| 2011 | 4992 | 635 | 2065 (41.4) | 1650 (33.0) | 784 (15.7) | 493 (9.9) | 2746 (55.0) | 2246 (45.0) | 78 | 1.6 |
| 2012 | 5996 | 741 | 1498 (25.0) | 2757 (46.0) | 1126 (18.8) | 615 (10.2) | 3525 (58.8) | 2471 (41.2) | 95 | 1.6 |
| 2013 | 3003 | 360 | 815 (27.1) | 1361 (45.3) | 482 (16.1) | 345 (11.5) | 1694 (56.4) | 1309 (43.6) | 45 | 1.5 |
| 2014 | 3297 | 383 | 1056 (32.0) | 1302 (39.5) | 554 (16.8) | 385 (11.7) | 1909 (57.9) | 1388 (42.1) | 112 | 3.4 |
| 2015 | 5428 | 614 | 1757 (32.4) | 2392 (44.1) | 826 (15.2) | 453 (8.3) | 3136 (57.8) | 2292 (42.2) | 66 | 1.2 |
| 2016 | 8326 | 914 | 2818 (33.8) | 3522 (42.3) | 1313 (15.8) | 673 (8.1) | 4993 (60.0) | 3333 (40.0) | 65 | 0.8 |
Derived from the yearly population estimates; CFR, case fatality rates.
Recorded respiratory cases and related deaths in Zaria metropolis, 2011–2016
To determine if the outdoor pollution level significantly contributed to exposed population respiratory symptoms, a total of 396 responses were obtained. We ensured that each of the 19 sample stations had at least 20 responses, i.e., participants situated at exposed stations were tagged as exposed whereas participants responding from control stations were tagged as control. There were 352 (88.9%) males and 44 (11.1%) females as participants. The internal-consistency reliability (Cronbach α) of the ATS interview was within acceptable limits (α > 0.70). Predominant respiratory symptom was phlegm (97.2%), followed by chest cough (80.8%), dyspnoea (55.6%), chest cough plus phlegm (54.8%), and wheeze (49.8%). Pneumonia (14.1%) was the major medically-diagnosed past respiratory illness. This can be attributed to the annual natural windy ‘harmattan’ period that is characterized with dusty conditions and low temperatures. Table 2 shows the descriptive statistics of respiratory symptoms among interviewed respondents. The interviewed responses were coded for further analysis.
| Case characteristics | Male (n) | Female (n) | Total, n (%) |
|---|---|---|---|
| Study population, n (%) | 352 (88.9) | 44 (11.1) | 396 |
| Age (years) | |||
| 20–29 | 38 | 15 | 53 (13.4) |
| 30–39 | 133 | 10 | 143 (36.1) |
| 40–49 | 149 | 9 | 158 (39.9) |
| ≥ 50 | 32 | 10 | 42 (10.6) |
| Education | |||
| Primary | 33 | 2 | 35 (8.9) |
| Secondary | 169 | 16 | 185 (46.7) |
| Tertiary | 150 | 26 | 176 (44.4) |
| Respiratory conditions | |||
| Chest cough | 289 | 31 | 320 (80.8) |
| Phlegm | 344 | 41 | 385 (97.2) |
| Cough & phlegm | 200 | 17 | 217 (54.8) |
| Wheeze | 175 | 22 | 197 (49.8) |
| Breathlessness | 192 | 28 | 220 (55.6) |
| Past illnesses | |||
| Lung trouble before 16 y | 18 | 3 | 21 (8.3) |
| Bronchitis attack | 14 | 3 | 17 (4.3) |
| Pneumonia attack | 47 | 9 | 56 (14.1) |
| Asthma attack | 15 | 4 | 19 (4.8) |
| Emphysema | 31 | 1 | 32 (8.1) |
| Hay fever | 2 | – | 2 (0.5) |
| Chest illness | 5 | 1 | 6 (1.5) |
| Chest operation | 3 | – | 3 (0.8) |
| Chest injury | 12 | 2 | 14 (3.5) |
| Heart trouble | 5 | 3 | 8 (2.0) |
| High blood pressure | 23 | 5 | 28 (7.1) |
| Hereditary probability | |||
| Father | 36 | 3 | 39 (9.9) |
| Mother | 60 | 10 | 70 (17.7) |
Descriptive statistics of respiratory symptoms among interviewed respondents in the study area
4. DISCUSSION
4.1. Outdoor Air Quality
The skewness analysis (p < 0.184) revealed that the recorded pollution levels were normally distributed across the 19 study sites. The pollution level of the observed criteria-pollutants were lowest during the December–January–February season, this can be attributed to the windy harmattan (cold season) in the study area. The windy harmattan season has the tendency to quickly disperse pollution emissions. In addition, outdoor activities are limited due to low ambient temperatures especially during morning and evening periods. The weighted average concentration level of CO measured were above the WHO/FEPA (Nigeria) stipulated limit (Table 3) in 15 of the 19 sample sites; SO2 and PM10 levels were above the WHO/FEPA limit in all the sites; PM2.5 were above the WHO limit in all the sample sites (Nigeria’s Federal Environmental Protection Agency (FEPA) has no specified limit for PM2.5); PM10 was above the WHO/FEPA limit in all the sites. Considering the global ambient air pollution update in the WHO 2016 results, the weighted average concentration level of recorded PM2.5 and PM10 firmly puts Zaria among the top five polluted cities of the world.
| Stipulated limits | Pollutants | |||
|---|---|---|---|---|
| CO (ppm) | PM2.5 (μg/m−3) | PM10 (μg/m−3) | SO2 (ppm) | |
| FEPA | 20 | – | 150 | 0.1 |
| WHO | 9 | 25 | 50 | 0.01 |
WHO, World Health Organization; FEPA, Federal Environmental Protection Agency.
Threshold of selected air pollutants, modified after (FEPA, 1999; [45])
4.2. Attributable Health Risk
A Levene’s test revealed that the spatial distribution of reported respiratory symptoms in Zaria metropolis was heterogeneous (p = 0.050). In Table 2, the health records indicate the most respiratory cases were notified in Ahmadu Bello University Medical Center (D) [3856.83; 95% confidence interval (CI): 2199.9–5513.8]. This is attributed to the fact that it is the only major health facility within a 4-km radius of Zaria’s Samaru axis. The least notified cases were reported at the Ahmadu Bello University Teaching Hospital (E) (34.5; 95% CI: 4.2–64.9). This may be attributed to its location, which is at the outskirts of the metropolis. Using the population estimates, the respiratory illness incidence rate was highest in 2016 (914/100,000). Table 2 highlights the trend of reported respiratory-related complaints obtained from the major health facilities. Respiratory illnesses were reported for age ranging from infancy (<1 year) to elderly (76 years). The physically active group of 15–44 years, which accounts for 58.21% (18,069) of all notified cases, were most at risk over the study period. Their case was remarkably high in 2016 with 58.07% (4835) of cases. The age group 0–14 years ranked second, accounting for 32.24% (10,009) of all notified cases and 33.85% (2818) in 2016. The age group of 45 years and older were the least affected by respiratory illnesses, accounting for 9.55% (2964) of total notified cases and a major report of 8.08% (673) in 2016. From 2011 to 2016, respiratory related illnesses afflicted more males 58.0% (18,003) compared with females 42.0% (13,039). This trend was harmonious all through the study period (r2 = 0.994; p < 0.01). With available pollution data for the year 2016, the WHO AirQ+ software was utilized to compute the theoretical attributable risk proportion for the study area in 2016.
To determine the theoretical AP for 2016, the total of 8326 cases of respiratory diseases, day-time weighted running average of PM2.5 and PM10 are 219.73 and 451.89 μg/m−3, respectively, and all other parameters were inserted into the AirQ+ software. The model report revealed that 32.62% and 29.12% of notified respiratory cases can be attributed to pollutants PM2.5 and PM10, respectively, having exceeded the stipulated threshold. In Table 3, we can see that for every 10 μg/m−3 increase in PM2.5 pollutant concentration, the corresponding amount of RR for the hospital accessed respiratory illnesses was 1.484% as well as 1.411% for every 20 μg/m−3 increase in PM10. An average of 31.8% (2648 cases) could have been avoided if the WHO guideline for PM2.5 and PM10 had been respected in 2016. However, the theoretical baseline incidence per 100,000 for short-term effects of population exposed to PM2.5 and PM10 (298.10 and 271.27) are minimal compared with the WHO guideline of 1260 for the land mass and total estimated population of Zaria.
The adopted relative risk (RR) value for concerned air pollutants (Table 4) are based on multiple analysis of peer-reviewed findings conducted in Asia, North America, and Western Europe [32,33,46]. Even though our study understood that the adoption of the theoretical RR obtained from researches conducted outside our region may alter predictions of the model, we felt that there is the need to most importantly drive the step in providing valuable evidence on the effects of air pollution for Nigeria’s policy-makers. We were also optimistic that our findings will assist the WHO AirQ+ software developers to further moderate any prediction error. Based on the available datasets, we utilized the theoretical WHO AirQ+ software to assess the interim effects of PM2.5 and PM10.
| Pollutant | WHO default values | Theoretical outcome | ||||
|---|---|---|---|---|---|---|
| Annual threshold (μg/m−3) | RR (95% CI) | Annual mean concentration (μg/m−3) | RR (95% CI) | Attributable respiratory cases | Baseline Incidence* | |
| PM2.5 | 10 | 1.019 (0.9982–1.0402) | 219.73 | 1.4840 (0.9629–2.2856) | 2798 | 298.10 |
| PM10 | 20 | 1.008 (1.0048–1.0112) | 451.89 | 1.4108 (1.235–1.6177) | 2498 | 271.27 |
The PM2.5 and PM10 threshold limit prescribed by the WHO for theoretical baseline incidence per 100,000 is 1260; CI, confidence interval; RR, relative risks; WHO, World Health Organization.
WHO theoretical values of relative risks (RR) implemented in AirQ+ corresponding to hospital admission/access for respiratory diseases and estimated RR in percentage and excess of number cases in 2016 resulting from short-term exposure to PM2.5/PM10 above the 10/20 μg/m−3 limits, respectively
4.3. Pollution Exposure Response
To determine if the outdoor air pollutants measured within the study area can contribute to the respiratory condition of present population, we analysed the relationship between each measured criteria pollutant against the individual respiratory response interviewed. Table 5 shows association between the presence of respiratory symptoms from interviewed respondents and observed criteria pollutant level.
| Cough | Phlegm | Cough and phlegm | Wheeze | Breathlessness | ||||||
|---|---|---|---|---|---|---|---|---|---|---|
| R | RMSE | R | RMSE | R | RMSE | R | RMSE | R | RMSE | |
| CO | 0.90 | 29.61 | 0.86 | 33.63 | 0.79 | 10.68 | 0.80 | 15.72 | 0.82 | 13.71 |
| SO2 | 0.91 | 28.44 | 0.87 | 33.07 | 0.81 | 10.17 | 0.80 | 15.61 | 0.78 | 14.86 |
| PM2.5 | 0.89 | 31.17 | 0.87 | 32.95 | 0.90 | 7.60 | 0.80 | 15.71 | 0.76 | 15.36 |
| PM10 | 0.88 | 32.88 | 0.83 | 37.04 | 0.79 | 10.45 | 0.71 | 18.63 | 0.72 | 16.54 |
Shaded cell highlights the possible association of pollution exposure and respiratory condition; R, correlation coefficient; RMSE, root mean square error.
Relationship between individual respiratory symptoms from respondents and each observed pollutants level
Additionally, we determined the contribution of measured pollution level to the general respiratory outcome of the interviewed population. The interviewed respondent outcomes were controlled for past illnesses and possible family hereditary influence using the formulae (5).
PER is the pollution exposure response; Si is responses from respondents for the varying symptoms (chest cough, phlegm, cough plus phlegm, wheeze, and breathlessness); Pi is responses with regards past illnesses (lung disease before 16 years of age, bronchitis, asthma, chest injuries/operation, high blood pressure) and H is responses with regards a possible inheritance of symptoms from biological parents.
From Figure 4 we see that the PM2.5 is the predominant cause of interviewed respiratory symptoms (r = 0.93). This result supported the WHO AirQ+ software findings (Table 3) and also literature [33,47]. In addition, SO2 ranked second after PM2.5, which is in agreement with Ren et al. [48]. Their study reported SO2 as their major cause of respiratory related illnesses, however PM2.5 was not investigated.
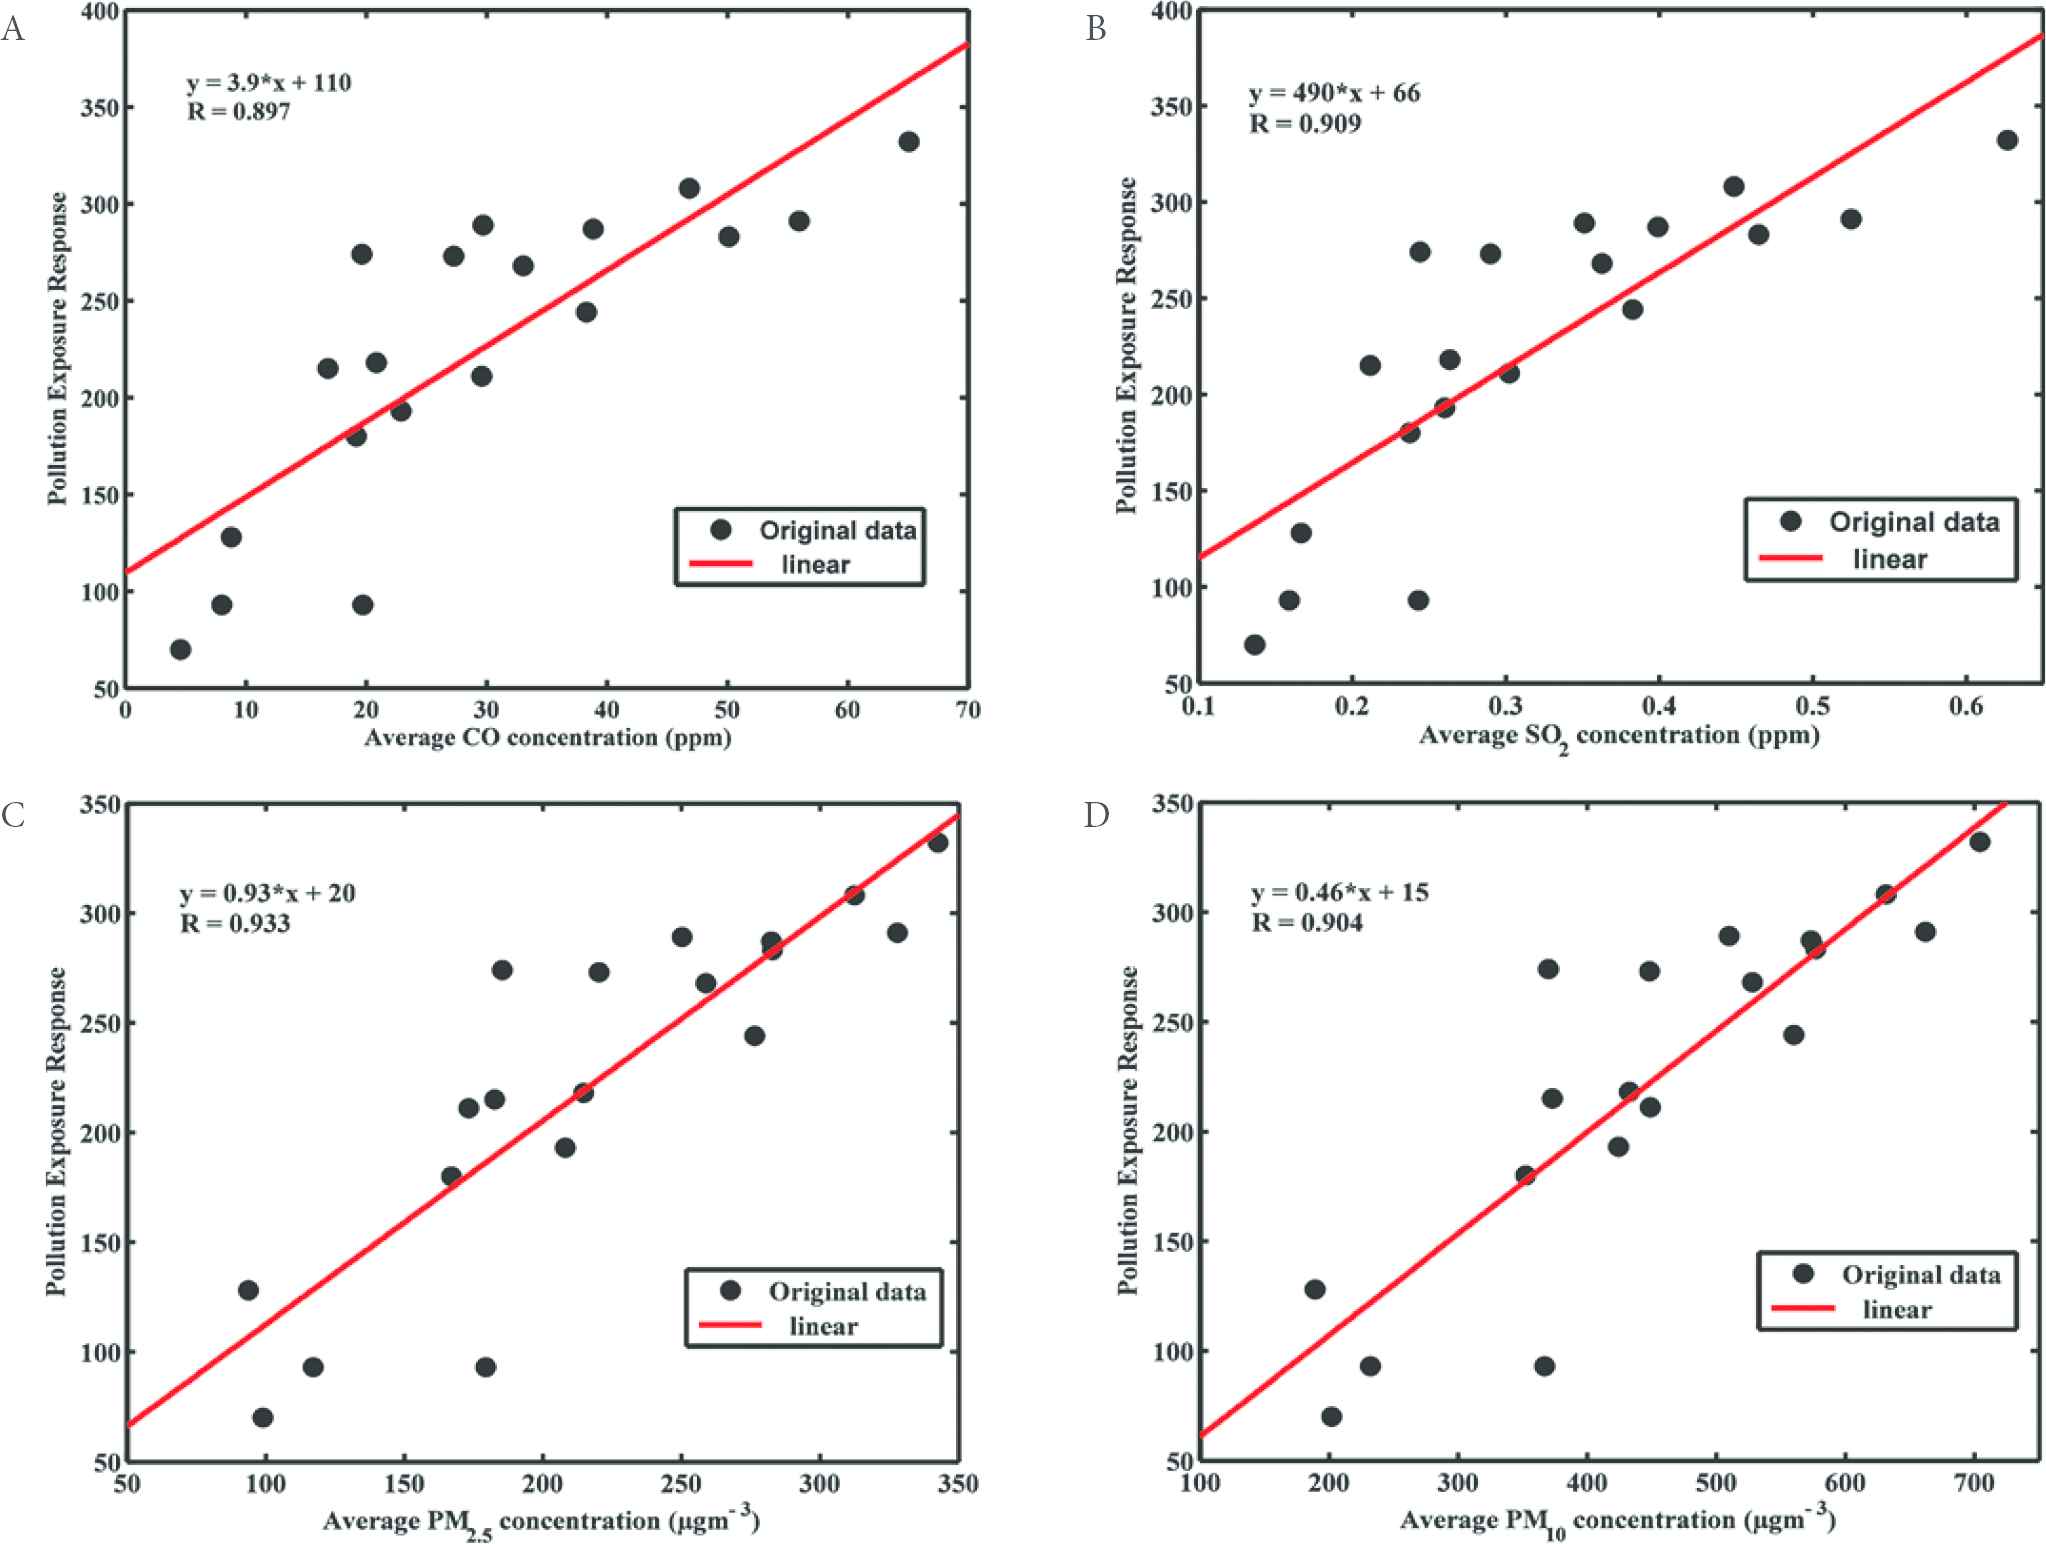
Scatter plot showing strong positive relationship between criteria pollutants (A) CO; (B) SO2; (C) PM2.5; and (D) PM10 respectively) against at-risk population respondents from the sample sites
To certify that the exposure to outdoor air pollutants in this population was the major contributor of the measured respiratory symptoms, we analysed the level of significance of the socio-economic factor on respiratory well-being. Using independent remote sensing approach, we derived the LST and the NDVI from Landsat 8 data, in the ArcGIS 10.2.1 software. The LST and NDVI values over the 19 sample points were extracted, collocated, and correlated with ATS questionnaire responses across the sample sites. The analysis show the socio-economic factors, LST (r = 0.76) and NDVI (r = 0.69). The results were not as significant as the measured pollutants level for the respondent respiratory outcome in Figure 4 (r ≥ 0.90). Note that the Landsat data were validated (r = 0.94) using the extracted LST and collocating ground temperature data obtained from the Nigerian Meteorological Agency station within the study area.
The study utilized portable pollutant sensors, ATS-respiratory questionnaire, and the WHO AirQ+ software model to evaluate the contributory effects of outdoor air pollution to respiratory outcomes in a highly polluted area. The study provides an encyclopaedic picture of outdoor air pollution exposure and possible ramifications to human health in a Nigerian city-scale. The study confirmed that a substantial amount of outdoor air pollution contributed significantly to respiratory indicators (cough, phlegm, wheeze, and breathlessness) from the interviewed respondents. This relationship advocates the use of AirQ+ software and ATS questionnaire for estimating the incidence of respiratory symptoms, as they are effective tools when assessing the liability of respiratory symptoms in any polluted city. The results of this study indicates that there is a relationship between the observed criteria-pollutants, (CO, SO2, PM2.5, and PM10) and respiratory well-being of the study population in Zaria metropolis, Nigeria.
The study had five key strengths: (1) it revealed a metropolitan city air pollution level, high enough to be ranked amongst the WHO polluted cities; (2) the sources of respiratory related data obtained from the five major health facilities within the study area, ensured their authenticity and dependability; (3) two certified respiratory epidemiological indicators (ATS–DLD-78A questionnaire and the WHO AirQ+ software model) were adopted to examine the health effects of observed criteria pollutants; (4) the suspended particles (PM2.5) had the most influence on the study population respiratory health, which is harmonious with other findings on this subject; and (5) our findings conclude that the respiratory symptoms investigated in this study are hypothetically associated with outdoor air pollutants measured using the MSA Altair 5× gas monitor and CW-HAT200 particulate counter.
We do recognize the following limitations in our study: (1) because the only two population censuses conducted in Nigeria were in 1991 and 2006, this study was constrained to adopt population estimates; (2) the RR coefficients adopted might have underestimated the extent of the attributable cases. However, we are confident that our results offer vital information on which Nigeria’s policy makers can base its public health strategies and interventions; and (3) the unavoidable time variation in collecting pollution samples may have introduced marginal errors, we believe however, like similar studies in this field, that these errors are not significant enough to alter the findings of this study.
ACKNOWLEDGEMENT
This study is supported by the University of Pretoria postgraduate bursary and Ahmadu Bello University, Zaria NEEDS intervention grant to the first author. We acknowledge Tukur Dahiru for his support. We also appreciate health officers of the medical facilities that assisted in the respiratory health data acquisition. We are grateful to the anonymous reviewers for their efforts.
CONFLICTS OF INTEREST
The authors have no conflicts of interest to declare.
REFERENCES
Cite this article
TY  - JOUR
AU  - Yahaya A. Aliyu
AU  - Joel O. Botai
PY  - 2018
DA  - 2018/12/31
TI  - An Exposure Appraisal of Outdoor Air Pollution on the Respiratory Well-being of a Developing City Population
JO  - Journal of Epidemiology and Global Health
SP  - 91
EP  - 100
VL  - 8
IS  - 1-2
SN  - 2210-6014
UR  - https://doi.org/10.2991/j.jegh.2018.04.002
DO  - 10.2991/j.jegh.2018.04.002
ID  - Aliyu2018
ER  -