
Estimating the potential impact fraction of hypertension as the main risk factor of stroke: Application of the distribution shift method
- DOI
- 10.1016/j.jegh.2014.11.002How to use a DOI?
- Keywords
- Stroke; Hypertension; Burden; Potential impact fraction; Iran
- Abstract
Few published studies have assessed the impact of quantitative risk factors such as high blood pressure on stroke. The aim of this study was to quantify the potential impact fraction (PIF) of hypertension on stroke in Hamadan Province, western Iran. Avoidable burden of stroke associated with high blood pressure was calculated using distribution shift at different scenarios. Data on the prevalence of high blood pressure among residents of Hamadan province older than 19 years were extracted from non-communicable diseases risk factors surveillance system in 2009. Five mmHg hypothetical reduction in systolic blood pressure above 140 mmHg, leads to 3.5% (PIF = 0.035) reduction in the total burden to stroke. This value may reach 7%, if systolic blood pressure decreases 10 mmHg. In addition, 5 mmHg hypothetical reduction in diastolic blood pressure above 82 mmHg, leads to 4.87% reduction in the total burden to stroke. PIF more than 10 mmHg modification on distribution of diastolic blood pressure was estimated as 9.38%. According to these findings, policy makers are advised to implement interventions on hypertension based on the distribution shift method rather than the proportion shift one.
- Copyright
- © 2014 Ministry of Health, Saudi Arabia. Published by Elsevier Ltd.
- Open Access
- This is an open access article under the CC BY-NC-ND license (http://creativecommons.org/licenses/by-nc-nd/4.0/).
1. Introduction
Hypertension is a common, asymptomatic, treatable and non-communicable disease. High blood pressure may lead to serious complications [1]. Hypertension is responsible for a large and increasing proportion of the non-communicable disease burden. About two-thirds of strokes and almost a half of all patients with ischemic heart disease are attributable to raised systolic blood pressure (SBP) above 115 mmHg [2]. Increased SBP and diastolic blood pressure (DBP) are important risk factors leading to stroke. Some studies have shown that the risk of stroke among hypertensive patients was seven times more than those with normal blood pressure [3,4].
Moreover, findings of 45 worldwide prospective cohorts showed a strong relationship between DBP and the risk of stroke. Ten mmHg increase in SBP may lead to 80% rise in the risk of stroke [5]. The effects of DBP on stroke, like SBP, have been shown in clinical trials [6]. Despite the fact, blood pressure is considered an adjustable cause of stroke [7]. According to the World Health Organization (WHO) estimate, at least a billion people in the world are living with hypertension and about 7.1 million mortality annually [8].
Stroke rate is higher in developing countries than developed ones [9]. The prevalence of hypertension is about 20% in Iran [10–12]. However, there is strong evidence supporting that hypertension outbreak has occurred in developing countries [13–15]. Generally, estimates of avoidable burden to disease and comparative quantification of risk factors are calculated using the distribution and proportion shift methods. In addition, the magnitude of avoidable burden is reported by the potential impact fraction (PIF) [16].
Besides a high prevalence of hypertension and its upward trend in Iran, there are few published studies regarding the application of PIF to estimate the contribution of this risk factor to avoid the stroke burden. Accordingly, this study aimed to highlight the role of reducing SBP and DBP to avoid stroke in Hamadan Province using the distribution shift method.
2. Methods and materials
Data on hypertension prevalence and its own 95% confidence intervals (95% CI) were extracted from non-communicable diseases risk factors surveillance system in 2009 which are described in detail elsewhere [17,18]. According to WHO STEPwise approach to Surveillance (STEPS) [17], data collection included three steps as follows; Step 1: collecting questionnaire-based information about diet, physical activity, and tobacco use. Step 2: using standardized physical measurements to collect data on blood pressure, height and weight. Step 3: taking blood samples for biochemical measurement of lipids and glucose status. Data on the association between hypertension and stroke (i.e. Hazard Ratio) were extracted from the Asia-Pacific Cohort Studies Collaboration (APCSC) [2], a meta-analysis which combined data from 37 prospective observational cohorts involving over 425,000 individuals with 2–27 years of follow-up and in total over three million person-years of observation.
PIF was estimated according to the following three scenarios. In the first scenario (the first feasible minimum risk), minimum risk for hypertension was considered as 5 mmHg hypothetical intervention on SBP above 140 mmHg and DBP above 82 mmHg. The corresponding values for the second and third scenarios were 10-mmHg hypothetical intervention (the second feasible minimum risk) and zero prevalence (theoretical minimum risk), respectively. In the present study, PIFs were estimated according to gender and age groups. Because, it is necessary to use age and gender-specific risk estimates for blood pressure provided by the APCSC data. Age-specific APCSC study was conducted on age groups of below 60, 60–70 and above 70 years. In the present study, the number of people older than 70 years was inadequate; thus, this age group was incorporated into the age group of 60–70 years due to limited knowledge on related hazard ratio for above 70 years group.
Estimates of attributable burden were made using the World Health Organization comparative risk assessment (CRA) methodology. CRA is a methodology evaluating both the disease burdens attributable to the existing risk factors, and the effects of interventions on these risk factors, also the potential avoidable future burden. According to this methodology, PIF was calculated to estimate avoidable burden using prevalence of a specific risk factor and its related association with a stroke.
PIF in the “distribution shift” was defined as follows [19]:
PIF was reported as percentage indicating the magnitude of avoidable burden to stroke. All calculations were performed using Microsoft office excel spreadsheet.
3. Results
The prevalence of SBP before and after the hypothetical intervention, hazard ratio of stroke and the associated PIF in the three scenarios are shown in Table 1. Five mmHg hypothetical intervention in SBP above 140 mmHg, leads to 3.5% reduction in the total burden to stroke. Besides, 10-mmHg modification in SBP resulted in 7% reduction and after modification of the current prevalence of SBP above 140 mmHg to zero prevalence hypothetical intervention, 22.05% of the total burden to stroke is avoided.
| Systolic blood pressure (mmHg) | Current (factual) prevalence (%) | Hazard ratio | Counterfactual prevalence (%) | PIFa (%) | ||||
|---|---|---|---|---|---|---|---|---|
| 1st feasible minimum risk (scenario1) | 2st feasible minimum risk (scenario2) | Theoretical minimum risk (scenario3) | 1st feasible minimum risk (scenario1) | 1st feasible minimum risk (scenario2) | Theoretical minimum risk (scenario3) | |||
| <115 | 32 (26, 37) | 1 (Reference) | 32 (26, 37) | 32 (26, 37) | 44 (38, 49) | 3.5 | 7 | 22.05 |
| 115–140 | 48 (42, 53) | 2 (1.9, 2.1) | 54 (58, 60) | 59 (54, 65) | 56 (50, 61) | |||
| 140–160 | 17 (13, 22) | 5 (4.5, 5.5) | 12 (8, 16) | 8 (5, 11) | 0 | |||
| >160 | 3 (1, 5) | 7 (6, 8) | 2 (0.02, 3) | 0.08 (0, 2) | 0 | |||
At the first scenario, minimum risk for hypertension was considered as 5-mmHg hypothetical intervention on systolic blood pressure above 140 mmHg and DBP above 82 mmHg. The corresponding values for the second and third scenarios were 10-mmHg hypothetical intervention and zero prevalence, respectively.
Potential impact fraction of systolic blood pressure to stroke by different scenarios.
The prevalence of SBP before and after the hypothetical intervention, hazard ratio between hypertension and stroke, and PIF in the three scenarios are shown by gender and age groups in Table 2 and Fig. 1. Five mmHg hypothetical interventions in SBP above 140 mmHg in males and females, leads to 3.3% and 3.4% reduction in the total burden to stroke, respectively. Besides, this value reaches 6.7% after 10-mmHg modifications in distribution of SBP in both genders and after modification of the current prevalence of SBP above 140 mmHg to zero prevalence hypothetical intervention, 23.95% and 23.83% of burden to stroke could be avoided. Five-mmHg hypothetical intervention in SBP above 140 mmHg in those younger than 60 years and above 60 years reduces 2.9% and 5.4% of the total burden to stroke, respectively. This value was estimated 5.7% and 10.8%, respectively after 10-mmHg decrease in the distribution of SBP and after modification of the current prevalence of SBP above 140 mmHg to zero, 19.22% and 53.7% of burden to stroke could be avoided respectively.
| Systolic blood pressure (mmHg) | Gender | Current (factual) prevalence (%) | Hazard ratio | Counterfactual prevalence (%) | PIF (%) | ||||
|---|---|---|---|---|---|---|---|---|---|
| 1st feasible minimum risk (scenario1) | 2st feasible minimum risk (scenario2) | Theoretical minimum risk (scenario3) | 1st feasible minimum risk (scenario1) | 1st feasible minimum risk (scenario2) | Theoretical minimum risk (scenario3) | ||||
| <115 | Male | 27 (22, 32) | 1 (Reference) | 27 (22, 32) | 27 (22, 32) | 44 (38, 50) | 3.3 | 6.7 | 23.95 |
| 115–140 | 51 (45, 57) | 2.5 (2.3, 2.7) | 58 (53, 64) | 64 (58, 70) | 56 (50, 61) | ||||
| 140–160 | 19 (14, 23) | 6 (5.5, 6.5) | 13 (9, 17) | 8 (5, 11) | 0 | ||||
| More than160 | 3 (1, 5) | 8 (7, 9) | 1 (0.08, 3) | 0.06 (0, 1) | 0 | ||||
| Less than 115 | Female | 36 (30, 41) | 1 (Reference) | 36 (30, 41) | 36)30, 41) | 52 (46, 56) | 3.4 | 6.7 | 23.83 |
| 115–140 | 45 (40, 50) | 1.8 (1.6, 2) | 51 (45, 56) | 55 (50, 61) | 48 (42, 54) | ||||
| 140–160 | 16 (12, 20) | 4.5 (4, 5) | 11 (8, 15) | 7 (4, 10) | 0 | ||||
| >160 | 3 (1, 5) | 6 (5, 7) | 2 (0.03, 3) | 1 (0, 2) | 0 | ||||
| <115 | Below 60 years | 36 (31, 42) | 1 (Reference) | 36 (31, 42) | 36 (31, 42) | 47 (41, 52) | 2.9 | 5.7 | 19.22 |
| 115–140 | 51 (46, 57) | 3 (2.5, 3.5) | 56 (51, 62) | 60 (54, 65) | 53 (47, 58) | ||||
| 140–160 | 11 (7,15) | 16 (14, 18) | 6 (3, 9) | 4 (1, 6) | 0 | ||||
| >160 | 0.08 (0, 0.02) | 32 (28, 36) | 0.03)0, 0.01) | 0.01 (0, 0.05) | 0 | ||||
| <115 | 60 years and more | 17 (13, 21) | 2.5 (2, 3) | 17 (13, 21) | 17 (13, 21) | 58 (52, 63) | 5.4 | 10.8 | 53.7 |
| 115–140 | 39 (33, 44) | 8 (7, 9) | 47 (41, 53) | 55 (50, 61) | 42 (36, 47) | ||||
| 140–160 | 29 (24, 34) | 24 (22, 26) | 25 (20, 30) | 21 (16, 25) | 0 | ||||
| >160 | 15 (11, 19) | 38 (32, 44) | 11)7, 14) | 7 (4, 10) | 0 | ||||
At the first scenario, minimum risk for hypertension was considered as 5-mmHg hypothetical intervention on systolic blood pressure above 140 mmHg and diastolic blood pressure above 82 mmHg. The corresponding values for the second and third scenarios were 10-mmHg hypothetical interventions and zero prevalence, respectively.
Potential impact fraction of systolic blood pressure to stroke according to gender and age groups at different scenarios.a
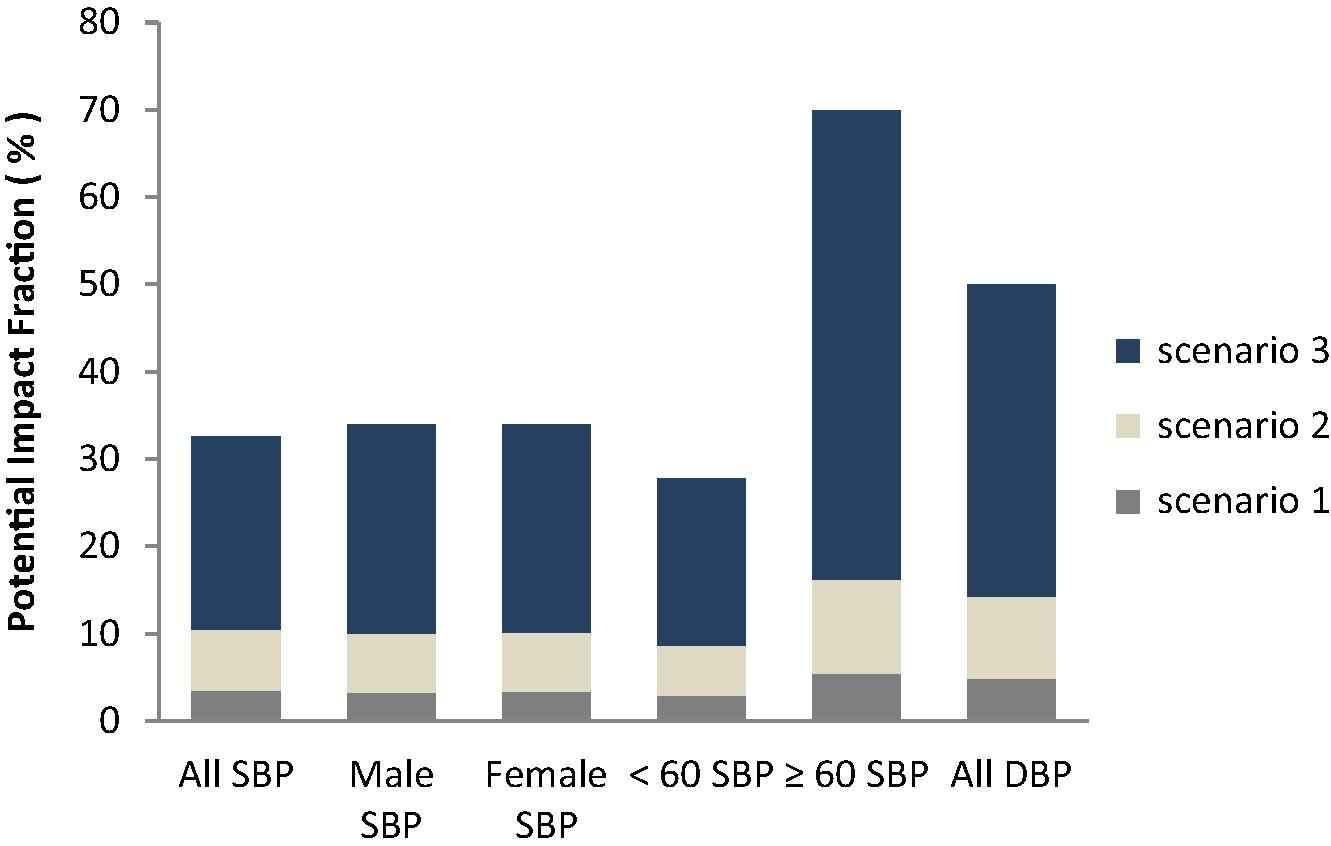
Potential impact fraction of systolic blood pressure (SBP) and diastolic blood pressure (DBP) to stroke.
The prevalence of DBP before and after the hypothetical intervention, related relative risks and PIF are shown in Table 3. Five-mmHg hypothetical intervention in DBP above 82 mmHg, leads to 4.87% reduction in the total burden to stroke and this value reaches 9.38% following 10-mmHg decrease in DBP. Modifying the current prevalence of DBP above 140 mmHg to zero leads to 35.68% reduction in the total burden to stroke.
| Diastolic blood pressure (mmHg) | Current (factual) prevalence (%) | Hazard ratio | Counterfactual prevalence (%) | PIF (%) | ||||
|---|---|---|---|---|---|---|---|---|
| 1st feasible minimum risk (scenario1) | 2st feasible minimum risk (scenario2) | Theoretical minimum risk (scenario3) | 1st feasible minimum risk (scenario1) | 1st feasible minimum risk (scenario2) | Theoretical minimum risk (scenario3) | |||
| <62 | 6 (3, 9) | 1 (Reference) | 6 (3, 9) | 6 (3, 9) | 47 (41, 52) | 4.87 | 9.38 | 35.68 |
| 62–69 | 10 (7, 13) | 1.03 (0.75, 1.42) | 10 (7, 13) | 10 (7, 13) | 15 (10, 19) | |||
| 69–75 | 15 (11, 19) | 1.2 (0.87, 1.66) | 15 (11, 19) | 24 (19, 29) | 16 (12, 20) | |||
| 75–82 | 22 (17, 28) | 1.4 (1.01, 1.94) | 37 (32, 43) | 41 (35, 46) | 22 (17, 27) | |||
| >82 | 47 (41, 53) | 2.1 (1.54, 2.88) | 31 (26, 37) | 19 (14, 23) | 0 | |||
At the first scenario, minimum risk for hypertension was considered as 5-mmHg hypothetical intervention on systolic blood pressure above 140 mmHg and diastolic blood pressure above 82 mmHg. The corresponding values for the second and third scenarios were 10-mmHg hypothetical interventions and zero prevalence, respectively.
Potential impact fraction of diastolic blood pressure to stroke by different scenarios.
4. Discussion
According to the results, PIFs for high SBP at the first, second and third scenarios were estimated 3.5%, 7% and 22.05%, respectively. The associated values for DBP were 4.87%, 9.38% and 35.68%, respectively. There is no similar study applying such a hypothetical intervention using the distribution method in Iran.
A study conducted by Karami [20] in Iran, 2012, showed that about 15.7% of the attributable DALYs to stroke (95% CI: 5.8%, 23.5%) in adult males and 15.8% (95% CI: 5.8%, 23.5%) in adult females are avoidable by changing the current prevalence of hypertension to 10% in both genders.
The finding of Norman et al. [21] showed that 51% of strokes in males and 48% in females were attributable to SBP ⩾ 115 mmHg. PAFs peaked in the 60–69 years to above 60%, with a downward trend thereafter for both males and females. Totally, 50% of strokes, 42% of ischemic heart diseases, 72% hypertensive diseases and 22% of other cardiovascular diseases’ burden in adult males and females (older than 30 years) were attributable to high blood pressure above 115 mmHg. The results of the study conducted by Lopez et al. [22] showed that potential impact fraction of hypertension on stroke in males and females was 49% and 59%, respectively. Population attributable risk fraction of hypertension in males and females was 52% and 54%, respectively. The results of a study in Japan showed that 43% and 48% of cardiovascular diseases and morality due to stroke are attributable to hypertension. Population attributable risk fraction is higher in younger people than elderly [23]. Among young men, 81% of cardiovascular disease related deaths are due to abnormal blood pressure. The finding of Lawes et al. [24] showed that 10-mmHg reduction in SBP, led to 36% reduction in strokes in people with a mean age of 63.
The results of the study performed by Nakayama et al. [25] on 40–65 years old Japanese living in Africa showed that population attributable risk fraction was 4.9% for untreated hypertension related mortality of stroke. Fahimfar et al. [26] during 9.3 year follow-up found that the population attributable risk fraction was 48.6% for hypertension as a modifiable risk factor. The finding of Lawes et al. [2] showed that 62% of stroke and 76% of hypertension were attributable to SBP ⩾ 115 mmHg in the world. The results of Tran et al. study [27] showed that the population attributable risk fraction in men ranged from 16.3% in Kuwait to 60.7% in Morocco for hemorrhagic stroke and 7.2% in Kuwait to 38% in Morocco for ischemic stroke. The equivalent PAFs for stroke mortality related to hypertension in women ranged from 12.4% in the United Arab Emirates to 48.6% in Bahrain for hemorrhagic stroke and 10.3% in the UAE to 46% in Morocco for ischemic stroke.
As we explained above, most studies aimed to perform comparative quantification of risk factors for providing information to policy makers focused on estimating attributable risk or avoidable burden using the WHO comparative risk assessment methodology. Accordingly, this investigation provided an applied method regarding the application of PIF to estimate the contribution of risk factors to quantify avoidable burden of diseases. The distribution shift method is possibly a better priority setting in planning and implementing preventive strategies compared to the proportion shift method.
Because of limited knowledge on related hazard ratio for above 70 years group, PIF was estimated using 60–70 years age group specific hazard ratio, so the potential impact fraction of SBP in above 60 years was probably underestimated.
In the present study, we demonstrated that hypertension is the strongest independent predictor of stroke. Policy makers are suggested to implement interventions to reduce hypertension based on the distribution shift method, which provides comparative quantification of various scenarios. Targeted interventions preventing hypertension could largely lessen the burden of stroke events. In conclusion, the results of this study confirmed the considerable contribution of hypertension to stroke. Accordingly, policy makers are strongly recommended to consider and implement preventive strategies on hypertension as an important priority.
Disclosure
Authors have no conflicts of interests.
Acknowledgments
This work was adapted from an M.Sc. thesis in Hamadan University of Medical Sciences. The study was funded by the Vice-chancellor for Research and Technology, Hamadan University of Medical Sciences (No. 920321824).
References
Cite this article
TY  - JOUR
AU  - Azam Biderafsh
AU  - Manoochehr Karami
AU  - Javad Faradmal
AU  - Jalal Poorolajal
PY  - 2015
DA  - 2015/01/20
TI  - Estimating the potential impact fraction of hypertension as the main risk factor of stroke: Application of the distribution shift method
JO  - Journal of Epidemiology and Global Health
SP  - 231
EP  - 237
VL  - 5
IS  - 3
SN  - 2210-6014
UR  - https://doi.org/10.1016/j.jegh.2014.11.002
DO  - 10.1016/j.jegh.2014.11.002
ID  - Biderafsh2015
ER  -