
Role of patient-reported outcomes and other efficacy endpoints in the drug approval process in Europe (2008–2012)
- DOI
- 10.1016/j.jegh.2015.04.006How to use a DOI?
- Keywords
- European Medicines Agency; European Public Assessment Report; Patient reported outcomes; Health related quality of health
- Abstract
The present study aimed at systematically reviewing the role and extent of patient-reported outcomes (PROs) usage within the package of scientific evidence considered for marketing authorization (MA). All regulatory information published by the European Medicines Agency (EMA) for products authorized between January 2008 and December 2012 and appearing in the European Public Assessment Report (EPAR) database was examined for efficacy endpoints. The endpoints here considered included: PROs, clinician reported outcomes (CROs), and laboratory reported outcomes (LROs). LROs were the most frequently reported endpoints. Out of the 180 products here selected, 99 (55%), 67 (37%), and 30 (17%), respectively, used LROs, CROs and PROs as primary endpoints (PEs). PROs as any endpoints were used in 82 (46%) products. Out of these, PROs were documented as PE in 30 (37%), with 27 (33%) products having used PROs both as primary and non-PEs. PRO usage was most frequently identified with nervous system and antineoplastic agents. During the study period, the use of all the three types of endpoints appeared to be static. Both the regulatory bodies and the industry should ensure complete and clear reporting of all endpoints used, including PROs, to improve transparency.
- Copyright
- © 2015 Ministry of Health, Saudi Arabia. Published by Elsevier Ltd.
- Open Access
- This is an open access article under the CC BY-NC-ND license (http://creativecommons.org/licenses/by-nc-nd/4.0/).
1. Introduction
The European Public Assessment Report (EPAR) made available by the European Medicines Agency (EMA) contains the index pharmaceutical product regulatory information [1,2]. It is published with the aim of granting the marketing authorization (MA) for any new pharmaceutical, and it is publicly accessible to allow satisfactory levels of transparency in the decision-making process [2]. The related scientific evidence is described in the scientific discussion part (SDP) and the molecule pharmacodynamics in the EPAR Summary of Product Characteristics (SPC) section. The SPC contains the information about both the clinical study endpoints and the health outcomes used during the evaluation phase of the product [3].
The regulatory drug approval is based on a range of clinical trial endpoints which are used to determine the biological activity, the clinical benefits, and the molecule safety profile [4]. The traditionally used endpoints include: the clinician-reported outcomes (CROs; e.g., those observed by the physician or which require an interpretation by the physician, i.e., radiography results) [4,5]; and the laboratory reported outcomes (LROs; e.g., objective measures performed by instruments) [4,5]. Finally, the patient-reported outcome(s) (PRO) is a generic term applicable to any health-related data reported directly by the patient without requiring an interpretation by the physician. These data typically include: symptoms, functional status, satisfaction with therapy, or treatment adherence [5,6]. PRO measures extend the range of patient outcomes that can be assessed beyond the traditional measures of survival rates, clinical efficacy and side effects. Thus, PROs allow researchers to capture the patient’s perspectives on a range of parameters, including: symptoms, overall health status, and the impact of disease and treatment on quality of life [7]. Health-related quality of life (HRQoL) is a specific subset of PROs defined as the patient’s subjective perception of the impact of disease and treatment(s) on daily life, physical, psychological, social functioning and well-being [7].
Although CROs and LROs are valuable, they may miss significant components of the patient’s experience. These endpoints are inadequate in conditions such as pain, depression and fatigue, typically requiring patients’ evaluation of their symptoms and health status [8]. PROs are used particularly for products used for treating chronic, disabling and incurable conditions, the treatment of which is administered with the purpose of improving both symptomatology and HRQoL levels [9,10].
Arguably, PROs may be considered as primary endpoints (PEs) in drug development for diseases such as cancer, pain, migraine, and irritable bowel syndrome. As non-PEs, PROs are also used in diseases such as depression, insomnia, and asthma. In rheumatoid arthritis and cancer, PROs are used to assess the treatment benefits and tolerability to better assess the medication impact on HRQoL. PROs can also be used in clinical trials to assess treatment satisfaction, compliance, and the caregiver burden [7]. Finally, PROs are also included in safety reporting, as discussed by the patient-reported outcomes safety event reporting (PROSPER) consortium [11]. Previous PRO usage analyses have been relatively focused on drug approvals [12]; labelling claims [5,13,14]; or single assessment tools [15]. PRO measures have also been examined in disease-specific contexts, including cancer [16–18] and rheumatoid arthritis [19]. Concerns relating to HRQoL increased usage, requirements of internal and external validation, and terminology standardization led to the release in 2006 of a reflection paper by the EMA [20]. This paper has provided broad recommendations on HRQoL usage in the context of already existing clinical guidance documents.
Improvement of recovering and survival rates remains the key target for drug development. However, identifying a range of parameters that can better describe the improvement levels in terms of patients’ feelings, overall HRQoL, and/or their overall functioning is an increasingly demanding goal. One could argue that drugs with a similar efficacy may present with different PRO levels, hence, PROs may be seen as an important gauge in the development of new treatment options [21,22]. The present study aimed at systematically reviewing the role and extent of PRO use within the package of scientific evidence considered for marketing authorization, as documented by the EPAR, over a period of 5 years (2008–2012). This study also aimed at exploring both the disease areas and the types of PROs being used.
2. Materials and methods
2.1. Search strategy
A systematic comprehensive electronic and manual search was performed herein for all the product-level regulatory documents (EPAR) published by EMA [23] from January 2008 to December 2012, with a special emphasis given to PROs being used in the regulatory process. The present analysis reviewed the distribution of CRO/LRO/PRO as clinical trial endpoints during the medicinal product approval prior to marketing authorization.
2.2. Selection criteria
EPARs of all medicinal products registered with the EMA were individually reviewed. The inclusion criteria were: (i) the index medicinal product, whether approved or rejected, was registered with the EMA during the study period; and (ii) availability of objective documentation relating to efficacy and tolerability endpoints. Exclusion criteria were as follows: (i) the medicinal product was generic, e.g., no clinical efficacy studies had been conducted; (ii) the medicinal product had been approved on the basis of bibliographic data or literature review only; and (iii) in the medicinal product approval procedure, no endpoints were mentioned. Products having the same EPAR but different authorization dates were not considered as duplicates and hence were included in the present review. For the standard definition of HRQoL and PRO, the related EMA [20] and the latest Food and Drug Administration (FDA) [24] guidance were respectively used.
2.3. Data extraction
Two authors independently reviewed each EPAR document to assess the appropriateness for inclusion in the present analysis prior to data extraction. The information regarding the endpoint(s) used was mainly extracted from the clinical studies section of both the SDP and the SPC. From each document, the following information was considered: (i) the product brand name and related active substance; (ii) specific clinical indication(s)/disease areas; (iii) primary and non-primary endpoints; (iv) the authorization date; (v) approved/rejected status; and (vi) marketing authorization holder. The relevant data of laboratory and clinical endpoints were extracted only when used as PEs. PROs were included only if they appeared to be collected in a systematic way from each subject and through the use of standardized procedures.
2.4. Data synthesis and statistical analysis
The PEs used here were typically documented as CROs, LROs and PROs, whilst being classified according to the Anatomical-Therapeutic-Chemical (ATC) classification. The PE distribution, either single or in combination, is herein represented in Fig. 1. The PROs used were herein categorized as primary/non-primary endpoints. An additional analysis of medicinal products using HRQoL as an endpoint was carried out as well. Descriptive statistics were used for documenting the endpoint distribution, with the time-trend of the use of different endpoints for marketing authorization having been analysed using the χ2 test for trends.
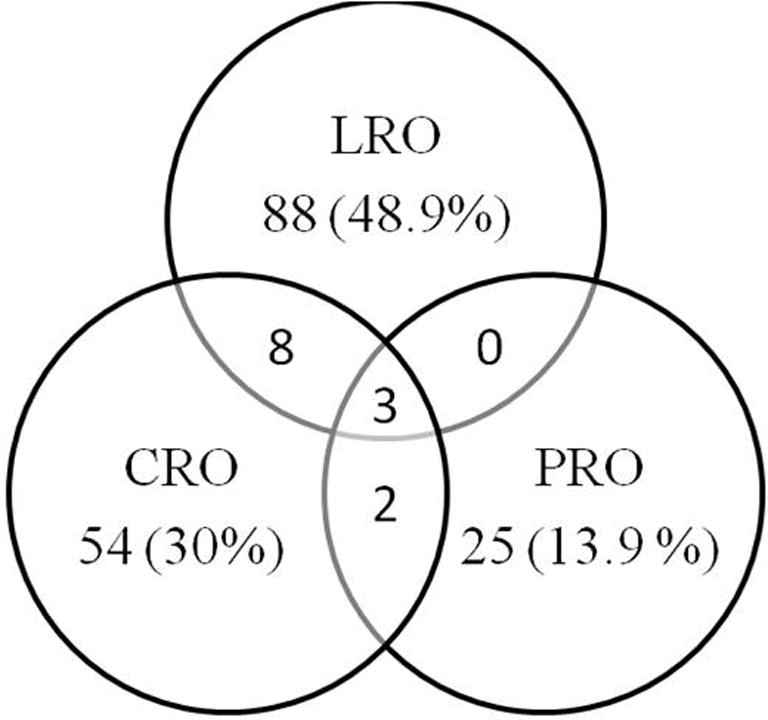
Endpoint combinations (N = 180). CRO: n = 54 (30.0%); LRO: n = 88 (48.9%); PRO: n = 25 (13.9%); CRO + LRO: n = 8 (4.4%); CRO + PRO: n = 2 (1.1%); PRO + LRO: n = 0 (0.0%); CRO + LRO + PRO: n = 3 (1.7%).
3. Results
3.1. Search results
During the study period, a total of 364 medicinal products had been registered with the EMA for getting a MA approval. Among these, 184 were excluded because 124 were generics; 49 were duplicates; 10 had been approved without conducting clinical studies; and with 1 product the endpoint was not mentioned. Hence, 180 products were selected for the present analysis and 174 (97%) of them had received proper MA.
3.2. Endpoints
Out of the 180 products here included for the analysis, LRO were respectively used as PE in 99 (55%), CRO in 67 (37%), and PRO in 30 (17%) products, as shown in Fig. 1. The details of primary and non-PE used in all 180 products are described in Supplementary Table 1.
3.3. PRO usage
On the whole, PROs as any endpoint had been used in 82 (46%) products. Among these 82 products, PROs as PEs were documented in 30 (37%) products; 27 (33%) products used PROs both as primary and non-primary endpoints. Some 52 (63%) of the products preferred PROs as non-PEs. Table 1 describes the domains of PROs used as PEs.
| Type of PRO | N (%) |
|---|---|
| Symptoms | 18 (60) |
| Functioning | 3 (10) |
| Health related quality of life | 7 (23.3) |
| Patient global rating | 2 (6.7) |
PRO domains used as primary endpoints.
Among those 30 products which documented PROs as PEs, most (18 [60%]) used a list of symptoms, followed by HRQoL in 7 (23%) cases. PROs as PEs were used as the only measurement in 25 (13.9%) products, while in combination with LRO and CRO in 5 (2.7%) products (Fig. 1). A range of differences were observed in the level of details provided on HRQoL and PRO measures in the EPAR scientific discussion part. PROs were considered as PEs mainly in specific diseases; for example, self-assessment of pain or changes in seizure frequency. Supplementary Table 2 provides a detailed description of PROs documented in 82 (46%) cases that used PROs as any endpoint. Among 82 EPARs, 60 (73%) reported the use of disease-specific measures, while 45 (55%) used generic instruments. The Health Survey Short Form-36 (SF-36) and its components were the most frequently (e.g., 19 cases; 23%) used generic instrument. SF-36 was used in combination with either disease-specific PROs or other HRQoL instruments in 16 (19%) cases and in isolation in 3 (4%) cases. The most frequently used disease-specific PROs included the visual analogue scale for pain (7 cases; 9%).
3.4. Anatomical-Therapeutic-Chemical (ATC) classification
PRO usage herein was frequently identified with antineoplastics, immunomodulators and diseases of the digestive tract, nervous system, and genitourinary system (see Table 2). Out of 45 products registered as either antineoplastics or immunomodulators, 25 (56%) products had used PROs, but they were used as PEs in only 5 (11%) cases. All 4 products approved for rheumatoid arthritis used a well-known composite measure (including components of PROs, CROs and LROs), namely the ‘American College of Rheumatology/ACR 20/50/70’ as PE. Among 25 antineoplastic agents, 12 (48%) products had used PROs as non-PEs. Formal HRQoL measures herein were commonly identified, as opposed to more generic definitions such as ‘signs and symptoms’ and ‘improvement’. The European Organization for Research and Treatment of Cancer Quality of Life Questionnaire Core 30 (EORTC QLQ-C30) was herein the most frequently used scale for 5 (8%) products.
| ATC class | Total | PRO N (%) | ClinRO N (%) | LRO N (%) |
|---|---|---|---|---|
| A – Alimentary tract and metabolism | 18 | 6 (33) | 2 (11) | 10 (56) |
| B – Blood and blood forming organs | 14 | 2 (14) | 8 (57) | 7 (50) |
| C – Cardiovascular system | 18 | 1 (6) | 0 (0) | 17 (94) |
| D – Dermatologicals | 2 | 0 | 1 (50) | 1 (50) |
| G – Genitourinary system and sex hormones | 9 | 3 (33) | 3 (33) | 3 (33) |
| H – Systemic hormonal prep, excluding sex hormones | 2 | 0 | 0 | 2 (100) |
| J – General anti-infectives for systemic use | 32 | 0 | 7 (22) | 26 (81) |
| L – Antineoplastic and immunomodulating agents | 45 | 5 (11) | 36 (80) | 15 (33) |
| M – Musculoskeletal system | 6 | 1 (17) | 3 (50) | 3 (50) |
| N – Nervous system | 18 | 11 (61) | 5 (28) | 2 (11) |
| P – Antiparasitic products | 1 | 0 | 0 | 1 (100) |
| R – Respiratory system | 7 | 1(14) | 0 | 6 (86) |
| S – Sensory organs | 4 | 0 | 1 (25) | 3 (75) |
| V – Various | 4 | 0 | 0 | 4 (100) |
| Total | 180 | 30 (17) | 67 (37) | 99 (55) |
PRO: patient reported outcome; ClinRO: clinician reported outcome; LRO: laboratory reported outcome. Product using more than one endpoint type is counted more than once in respective endpoint type.
Number represents the medicinal products registered.
Primary endpoint type by Anatomical-Therapeutic-Chemical (ATC) class.
Among 18 products registered for nervous system disorders, 15 (83%) had used PROs, including HRQoL. Some 11 (61%) products (3 analgesics, 4 antiepileptics, 1 antipsychotic, 1 antidepressant, and 2 others) used PROs as PE. All 4 (100%) products registered for seizure disorders used the ‘patient global assessment of reduction in seizure frequency and/or severity’ as PE. There had been 2 analgesics/4 brands registered during the study period. During the related clinical trials, the PRO considered included: the numerical rating scale (NRS); the Likert scale; and the patient-averaged summed pain intensity difference (SPID). Conversely, 2 urological products had used PROs as PEs, e.g., the ‘incontinence episode frequency’ and the ‘International Prostate Symptom Score’. Out of the 18 products registered for the digestive tract during the study period, 9 (50%) used PROs as any endpoint while 6 (33%) used them as PE. These PROs included the levels of spontaneous bowel movements for assessment of the irritable bowel syndrome. Similarly, the chemotherapeutic agents granisetron and palonosetron considered the ‘complete’ or ‘partial’ control over nausea and vomiting, together with patients’ diaries, as PROs (Tables 3 and 4).
| Product | Indication | Patient reported outcome |
|---|---|---|
| Fosaprepitant | Nausea and vomiting | Episodes of vomiting or retching recorded on patient diary cards, FLIE, Patient self assessment of nausea using VAS, Global satisfaction with the anti-emetic treatment by VAS, use of rescue therapy |
| Fluticasone furoate | Allergic rhinitis | Total Nasal Symptom Score |
| Recombinant human C1 inhibitor | Angioedema | Time to begin relief at site, Time to Minimal Symptoms, pain/swelling VAS, Treatment benefit VAS |
| Fentanyl | Breakthrough pain | Pain intensity by NRS, Pain relief by Likert Scale, Use of rescue medication, Global medication performance assessment |
| Methylnaltrexone bromide | Opioid-induced constipation | Laxation response, Constipation distress scale, Pain scores, Bowel movement difficulty and frequency, Use of rescue laxative medication, PGIC, Opioid withdrawal symptoms using modified Himmelsbach scale |
| Lacosamide | Partial seizures | Seizure frequency, QoL in Epilepsy – 31, Health Outcomes Assessment, Seizure Severity Scale ratings |
| Fentanyl citrate | Breakthrough pain | Pain intensity by NRS, global impression-VAS, use rescue medicine |
| ChondroCelect* | Femoral condylar Cartilage defects | Overall Knee Injury and Osteoarthritis Outcome Score |
| Prucalopride | Chronic constipation | CSBM, Stools consistency and severity of constipation, Use of laxatives, Patient Assessment of Constipation – Symptoms and Patient Assessment of Constipation – QoL questionnaires. |
| Rilonacept | CAPS | Key symptom score by Daily Health Assessment Form, Number of disease-flare days |
| Milnacipran Medicament | – | VAS scale, PGIC, SF-36-Physical Component Summary, Fibromyalgia Impact Questionnaire |
| Fentanyl | Breakthrough pain | Pain intensity by NRS, Total pain relief (TOTPAR) score, Patient’s global assessment, Rescue medication usage. |
| Conestat alfa | Angioedema | Time to Beginning of Relief of Symptoms (VAS Score Decrease of ⩾20 mm with Persistence) |
| Linaclotide | Irritable bowel syndrome with constipation | Abdominal Pain, CSBM frequency, SBM frequency, Stool Consistency, severity and staining, abdominal discomfort, bloating, QoL (EQ-5D VAS, IBS-QOL, EQ-5D utility index) |
| Mirabegron | Overactive bladder syndrome | IEF, Number and mean volume voided of micturition per 24 h, number and level of urgency incontinence episodes, number of nocturia episodes, mean number of pads used. Overactive Bladder Questionnaire, WPAI-Specific Health Problem, Patient Perception of Bladder Condition, TS-VAS, EQ-5D,, number of physician visits |
Qol: Quality of Life; PGIC: Patient’s Global Impression of Change; SF-36: Short Form-36; IEF: Incontinence Episode Frequency; I-QOL: Incontinence Quality of Life; PGI-I: Patient’s Global Impression of Improvement; MTBV: Mean Time between Voids; VAS: Visual Analogue Scale; FLIE: Functional Living Index-Emesis; IBS: Irritable bowel syndrome; WPAI: Work Productivity and Activity Impairment; EQ-5D: EuroQol 5 Dimensions Health Questionnaire; NRS: Numeric Rating Scale; VRS: Verbal Rating Scale; CSBM: complete spontaneous bowel movement; SBM: Spontaneous Bowel Movement; SF-12: Short Form-12; TS-VAS: Treatment satisfaction-visual analogue scale; CAPS: Cryopyrin-Associated Periodic Syndromes.
Characterized viable autologous cartilage cells expanded ex vivo expressing specific marker proteins.
Products exclusively using PRO for evaluation of medicinal product (n = 15).
| Health related quality of life scale | Medicinal products |
|---|---|
| Functional Assessment of Cancer Therapy and components | Epoetin theta, Ruxolitinib, Axitinib, Everolimus, Canakinumab |
| European Organization for Research and Treatment of Cancer Quality of Life Questionnaire and components | Paclitaxel, Degarelix, Everolimus, Pazopanib, Ruxolitinib |
| EuroQoL/EQ-5D components | Teduglutide, Pazopanib, Dexamethasone, Axitinib, Linaclotide |
| Short Form-36 and components | Certolizumab pegol, Ambrisentan, Olanzapine pamoate, Eptotermin alfa, Capsaicin, Canakinumab, Milnacipran Pierre Fabre Medicament, Dexamethasone, Velaglucerase alfa, Human normal immunoglobulin (SCIg), Belimumab, Hydrocortisone, Teduglutide, Degarelix, Tolvaptan, Asenapine maleate, Idebenone, Eltrombopag |
| Dermatology Life Quality Index | Ustekinumab |
| Activities of daily living | Idebenone |
| Functional Living Index-Emesis | Fosaprepitant |
| Irritable bowel syndrome – Quality of Life | Linaclotide |
| Work Productivity and Activity Impairment and components | Mirabegron |
| Child Health Questionnaire | Canakinumab, Velaglucerase alfa, Human normal immunoglobulin (SCIg) |
| Health Assessment Questionnaire | Certolizumab pegol, Tocilizumab, Golimumab, Canakinumab |
| Inflammatory Bowel Disease Questionnaire | Certolizumab pegol, Teduglutide |
| Eastern Cooperative Oncology Group-performance status scale | Paclitaxel |
| Quality of Life in Epilepsy – 31 | Lacosamide, Eslicarbazepine acetate, Retigabine, Perampanel |
| Quality of Life in children with epilepsy | Everolimus |
| Health Outcomes Assessment | Lacosamide |
| Knee injury and Osteoarthritis Outcome Score | ChondroCelect (characterized viable autologous cartilage cells expanded ex vivo expressing specific marker proteins) |
| Patient Assessment of Constipation – Quality of Life | Prucalopride |
| Fibromyalgia Impact Questionnaire | Milnacipran Pierre Fabre Medicament |
| National Eye Institute Visual Functioning Questionnaire – 25 | Dexamethasone, Aflibercept |
| Personal Evaluation of Transitions and Treatments | Asenapine maleate |
| Quality of Life Enjoyment and Satisfaction Questionnaire | Asenapine maleate |
| Subjective Well-being Neuroleptics short form | Asenapine maleate |
| Norfolk Quality of Life – Diabetic Neuropathy | Tafamidis |
| Cystic Fibrosis Questionnaire – Revised | Colistimethate sodium |
| St. George’s Respiratory Questionnaire | Glycopyrronium bromide |
| Overactive Bladder Questionnaire | Mirabegron |
Medicinal products using health related quality of life scales.
3.5. Time-trend of use of endpoints
Fig. 2 displays the usage trends of different PEs during the study period. Laboratory and device measurements resulted in being the most typically used endpoints. The use of all three types of endpoints remained static throughout the study period. No significant variations in the endpoint usage by year for LRO (χ2value-0.0093, p-0.92), CRO (χ2value-0.279, p-0.60) and PRO (χ2 value-3.179, p-0.07), respectively, were observed.

Distribution of primary endpoints by year. CRO = clinician reported outcome, PRO = patient reported outcome, LRO = laboratory endpoints.
4. Discussion
This paper has provided a thorough insight into the PRO usage over a 5-year period post the release of the EMA reflection paper in 2006. It appeared that PRO, as any endpoint, had been used for some 82 (46%) products, although as a primary endpoint was herein considered only for 30 (37%) of them. Conversely, most products had relied on more objective (e.g., laboratory or clinical) data. Overall, these results clearly suggest that PRO usage, for any endpoint, has increased from 34% in the study period 1995–2003 to 46% [12].
Although the EMA reflection paper has provided a range of detailed information relating to the regulatory expectations for any product to be registered [20], present data seemed to suggest wide levels of variation in PRO usage across different disease areas. The decision to include PROs in any new product information is a multi-factorial one. The increasing levels of PRO use in the industry-sponsored research may be driven by the need to demonstrate differences among competing products in terms of health outcomes relative to expenditures [12,25], but also by the major United States (2010) health care law ‘Patient Protection and Affordable Care Act’ [26] implementation of the Patient-Centered Outcomes’ Research Institute (PCORI). The distribution of PROs, CROs, and LROs across the range of therapeutic classes reflects current practices on how the diseases are being diagnosed and monitored. Due to the clear value of patients’ reports relating to their symptoms, it is important that some products, such as anti-epileptics, analgesics, anti-asthmatics, anti-allergics and gastrointestinal agents may consistently take PROs into account. Furthermore, although with agents such as the cardiovascular and anti-diabetic ones the use of laboratory tests/clinical observations may necessarily need to be considered, the use of PRO measures may better complement remaining objective endpoints’ data.
The most typical domain of PRO use in this study seemed to be the levels of “symptoms’ occurrence”, hence confirming previous findings from both the United States [14] and the European Union [27]. This dominance of symptom-based PRO data may be due to the fact that symptoms are the most important and initial impact of many diseases as well as treatments. Moreover, patients can fairly easily quantify the symptoms’ frequency/severity/duration with the use of simple scales, such as the visual analogue scales and/or the patients’ diaries. Overall, present data showed as well that many PROs used for obtaining MA are those which had already been previously validated (e.g., SF-36, EORTC 30) [28]. From this point of view, Shah et al. [29] reviewed the prescription drugs containing the HRQoL terminology approved in the U.S. analyzing the medicinal products’ package inserts (PI) and the summary basis for their approval. They identified 18 products (mostly used in oncology), relating to 20 clinical indications, containing mentions relating to HRQoL improvement levels, with the earliest documented approved claim having been in 1989. Most of these products (60%) had used HRQoL measures as non-PEs, and only 1 out of 4 of PI listings used them as PE. Willke et al. [5] reviewed the PRO endpoints in product labels of new medicinal products approved in the U.S. in the time frame 1997–2002. They found that PROs appeared in 64 (30%) labels, with the most typical use having been identified with anti-inflammatory, CNS and gastrointestinal drugs, with a static usage trend. Gnanasakthy et al. [14] reviewed the product labels in the time-frame 2006–2010, and found that 28/116 (24%) products had been authorized with the help of PRO claims. Discrepancies with data herein presented might be explained by differences in both sources and study methods, including: different regulatory agencies involved; different types of product-related regulatory documents; and range of therapeutic classes reviewed. Indeed, Willke et al. [5] had analysed a range of U.S. product labels where the information described, typically based on a fairly high standard of evidence, can be quoted on the eventual medicinal product promotion material. Conversely, the present analysis had reviewed the EPAR material, which represents a broader document, including roughly the whole amount of data which had been generated as part of the regulatory submission.
Willke et al. had also reported that CROs were the endpoints most typically used (64% of products) in pre-MA studies, followed by laboratory/device endpoints in 50% of cases [5]. Current figures for CROs and LROs were herein respectively 37% and 55% of products. Another study [30] focused on the U.S. drug products’ labels in the time-frame 2003–2008 identified 36/142 (25.4%) labels with PROs, similar to the figure (30%) which had been identified in the 1997–2002 time-frame. This apparent consistency of PRO usage data over time (1997–2008) may be explained by the fact that the relating PRO EMA guidance was published in 2006, preceded 4–5 years earlier by the PRO Harmonization group efforts. The time-lag between the implementation of such measures and their increasing levels of appearance in drug labels may be explained by the length of most drug development programs. By 2008, although the final FDA guidance had not been published yet, arguably better awareness levels of PRO usage requirements were already available. Further, Demuro et al. explored the reasons of denial of PRO label claims in the U.S. during the time-frame 2006–2010 and found 24/52 (46%) products containing PROs as part of the pivotal studies were denied. They found that fit-for-purpose and study design, data quality, interpretation, statistical and administrative issues, and lack of demonstrated treatment benefits were the primary reasons for rejection [31].
Szende et al. [12] reviewed all published EMA guidance documents, product-level regulatory documents and the EPAR database between 1995 and 2003 for HRQoL and other PRO measures. They found that 81 products (34%) included HRQoL/PRO data, with larger levels (32%) of PRO usage relating to antineoplastic agents. Furthermore, Gondek et al. [17] assessed the incorporation of HRQoL and symptom assessment in industry-sponsored cancer clinical trials and related product labels. They found that out of 2704 industry-sponsored oncology trials, 322 (12%) had included a PRO measure. Conversely, out of 70 FDA labels, only 6 (9%) PIs included PRO data. Although their analysis focused on oncology products only, they concluded that the EMA may present, during MA procedures, with larger levels of attention than FDA to HRQoL measures, hence confirming other authors’ suggestions [7]. Similarly, Rock et al. [32] found that 9 treatment indications for 7 anticancer therapies had been approved by the FDA based either on symptom palliation or improvement in a functional endpoint, representing 10% of all treatment indications approved during the study period (1995–2006). Overall, over the last decade or so, both the EMA and the FDA have shown increasing levels of interest towards PRO usage during MA procedures [20,24]. EMA appeared, however, to be more flexible and open to the inclusion of validated and clinically/methodologically appropriate PROs [33]. Indeed, many EMA disease-specific guidelines now require PRO endpoints to be included as secondary endpoints (e.g., the Ankylosing Spondylitis Quality of Life; ASHRQoL) [34]. Furthermore, the EMA has also issued a ‘Biomarker’s Qualification Programme’ that provides a better framework for evaluating clinical trial endpoints, including PROs [35].
The information provided in the EPAR SDPs reflects only the data which had been considered during the decision-making procedures; hence, some of the information submitted for the regulatory review may be missing. Therefore, it is possible that some pharmaceutical companies had actually included HRQoL measures in their clinical studies, but only some of these data were accepted for mention in either the SDP or the product label.
Many countries prompt formal agencies, e.g., the Health Technology Assessments (HTA) committees, to specifically assess the relative clinical and economic benefits of a range of medications. The HTA committees determine the added benefits of new technologies for the purpose of reimbursement and pricing decisions and/or for drafting of clinical guidelines [36,37]. In Europe, the patients’ perspectives are typically included in the HTA process/decisions [38,39]. For example, patients’ organizations are involved in various aspects of the consultation process of both the German Institute for Quality and Efficiency in Health Care (IQWiG) and the United Kingdom National Institute for Clinical Excellence (NICE) [40]. From this point of view, NICE has recommended to consider the Dermatology Life Quality Index (DLQI) scores, whilst assessing the different medications’ suitability for the treatment of eczema and psoriasis [41]. Similarly, the HRQoL patient scoring on the Adult Growth Hormone Deficiency scale (HRQoL-AGHDA) has been recommended as one of the 3 criteria to assess the patient suitability for the treatment with recombinant human growth hormone [42].
The importance of PRO consideration has also been emphasized by the U.S. WellPoint Foundation (e.g., a charity providing support for clinical research activities), which has issued a range of formal advice for drug companies on submitting data relating to drug cost-effectiveness; budgetary impact; and assessment of HRQoL improvement levels [25,43].
Overall, however, there are a number of obstacles possibly limiting the acceptance of PRO measures by the regulatory agencies. In fact, according to the FDA [31], the clinical parameters considered must relate to the clinical indications and be of sufficient value for the prescribing physicians to justify their inclusion in the product label. Hence, one could argue that preference would be given to objective clinical data. Indeed, a number of PRO measures are relatively new, lacking normative/validation data [29]. Finally, research sponsors may be interested in limiting the number of endpoints to a critical minimum to improve chances of obtaining the MA.
It is suggested that there should be an increment in PRO usage both as primary and non-PE. Those clinical trials considering the medication benefits as taken from PRO data as well are likely to have a far-reaching impact, being possibly able to attract the attention of stakeholders/patient advocacy groups, which will in turn facilitate access to new/less affordable treatments [24]. Furthermore, to improve transparency levels, both regulatory bodies and industries should ensure complete and clear reporting of all endpoints used, including PRO.
Competing interest
FS is a member of the EMA Advisory Board (Psychiatry).
Authors’ contributions
DB had the idea for the study. DB and AP oversaw its design and contributed to the data collection in collaboration with DB. DB and GK did all the analyses and drafted the paper. DB, AP, GK and FS contributed to the design of the manuscript, interpretation of results, and discussion of the findings. All authors read and approved the final manuscript.
Acknowledgements
None.
Appendix A. Supplementary data
Supplementary data associated with this article can be found, in the online version, at http://dx.doi.org/10.1016/j.jegh.2015.04.006.
References
Cite this article
TY  - JOUR
AU  - Dipika Bansal
AU  - Anil Bhagat
AU  - Fabrizio Schifano
AU  - Kapil Gudala
PY  - 2015
DA  - 2015/05/29
TI  - Role of patient-reported outcomes and other efficacy endpoints in the drug approval process in Europe (2008–2012)
JO  - Journal of Epidemiology and Global Health
SP  - 385
EP  - 395
VL  - 5
IS  - 4
SN  - 2210-6014
UR  - https://doi.org/10.1016/j.jegh.2015.04.006
DO  - 10.1016/j.jegh.2015.04.006
ID  - Bansal2015
ER  -