
Seasonality and trend analysis of tuberculosis in Lahore, Pakistan from 2006 to 2013
- DOI
- 10.1016/j.jegh.2015.07.007How to use a DOI?
- Keywords
- Correlation; DOTS; Pakistan; Seasonality; Time series; Tuberculosis
- Abstract
Tuberculosis (TB) is a respiratory infectious disease which shows seasonality. Seasonal variation in TB notifications has been reported in different regions, suggesting that various geographic and demographic factors are involved in seasonality. The study was designed to find out the temporal and seasonal pattern of TB incidence in Lahore, Pakistan from 2006 to 2013 in newly diagnosed pulmonary TB cases. SPSS version 21 software was used for correlation to determine the temporal relationship and time series analysis for seasonal variation. Temperature was found to be significantly associated with TB incidence at the 0.01 level with p = 0.006 and r = 0.477. Autocorrelation function and partial autocorrelation function showed a significant peak at lag 4 suggesting a seasonal component of the TB series. Seasonal adjusted factor showed peak seasonal variation in the second quarter (April–June). The expert modeler predicted the Holt–Winter’s additive model as the best fit model for the time series, which exhibits a linear trend with constant (additive) seasonal variations, and the stationary R2 value was found to be 0.693. The forecast shows a declining trend with seasonality. A significant temporal relation with a seasonal pattern and declining trend with variable amplitudes of fluctuation was observed in the incidence of TB.
- Copyright
- © 2015 Ministry of Health, Saudi Arabia. Published by Elsevier Ltd.
- Open Access
- This is an open access article under the CC BY-NC-ND license (http://creativecommons.org/licenses/by-nc-nd/4.0/).
1. Introduction
Tuberculosis (TB) is one of the biggest health challenges which the world is facing and is the second major cause of mortality, particularly in poor and low economic countries [1,2]. TB is a respiratory infectious disease caused by Mycobacterium tuberculosis and spreads through air droplets by sneezing and coughing of the infected person [3]. Globally, 8.6 million people developed TB throughout the world in 2012; 1.1 million (13%) were coinfected with human immunodeficiency virus (HIV). Throughout the world, 6.1 million cases of TB were registered to the national TB program, and of these, 5.7 million were newly diagnosed cases [4]. Pakistan is ranked fifth among the 22 high TB burden countries. In 2012, nearly 2.6 million new cases of TB were notified of which 1.1 million (42%) were sputum smear-positive. The incidence and prevalence rates of Pakistan in 2012 inclusive of HIV were 231/100,000 population and 376/100,000 population, respectively, with a mortality rate of 0.66/100,000 population [5].
It is a well-known fact that TB demonstrates seasonality. Seasonality of TB has been reported in many studies, such as in Kuwait, where the peak of case notification is in summer [6], in India with summer as the peak season [7], and in China where summer is the peak season [8]. In Iran, a high number of TB cases were observed in spring and summer [9]. The review of various studies has shown a rise in TB case notification at the end of the winter and the start of summer [10]. The exact mechanism underlying this seasonality is not known, but it has been suggested that various environmental, social, and host-related risk factors such as temperature, humidity, rainfall, sunlight, indoor activity, crowding, pollution, immunosuppression, and diagnostic delays are involved in TB seasonality, specially, in winter [11]. Various demographic and epidemiological factors have been characterized that explain the trend and seasonality of TB [12,13]. Identification of seasonality and the trend pattern of TB is very important for two reasons. Firstly, to find out the major risk factors involved in the spread of the disease and secondly, to plan the strategies to control the prevention of the disease. TB case notification has been reported with different peaks in different seasons, such as in South Africa where it peaks from winter to early spring [15], in the UK and Hong Kong where summer is the peak season [14,15], and in Spain and Japan, where the maximum number of cases were reported in summer and autumn [16,17].
To our knowledge, no study has described the seasonality of TB in Pakistan. Therefore, the present study is aimed to find the possible seasonal variation in newly diagnosed pulmonary TB cases notified to the directly observed short treatment program (DOTS) of the national TB program in Lahore, Pakistan from 2006 to 2013.
2. Methods
A retrospective study was performed on the data obtained from DOTS, the regional center of Punjab in Lahore, Pakistan, to determine the seasonality and temporal relationship of TB. Here, seasonality is defined as the characteristic of the time series in which data exhibit regular and predictable changes which recur at every defined interval of time (quarter of the year in this case). From the Lahore region, DOTS covers the population of nearly 7 million. The data of newly diagnosed sputum smear-positive pulmonary TB cases from 2006 to 2013 were obtained. To notify a TB case, three sputum smears were performed for acid-fast bacilli through the Ziehl–Neelson stain method as per the guidelines of the World Health Organization. The cases with two positive reports were considered as true TB cases and registered as TB smear-positive cases to DOTS. The study was confined to smear-positive pulmonary TB cases for two reasons. Firstly, the diagnosis of other forms of TB is uncertain with poorly developed culture facilities in countries like Pakistan. Secondly, the proportion of other forms of TB was very small as compared to sputum smear-positive pulmonary TB. The data obtained from DOTS was on a quarterly basis. All of the data were grouped by sex into seven age groups. For the temporal relationship of TB, correlation and regression analysis was performed between the quarterly number of notified TB cases and quarterly mean temperature. The temperature data were obtained from the meteorology department of Lahore. All of the data were entered in Microsoft Excel (2010 version).
Expert modeler of SPSS version 20 software (SPSS Inc., Chicago, IL, USA) was used to fit the best suitable model for the time series data. The stationarity of the data was checked by autocorrelation function and partial autocorrelation function. The peak of seasonal variation was determined by seasonal adjusted factor. The Ljung–Box (modified Box–Pierce) test was used to determine if the model was correctly specified. Forecasting of the incidence of quarterly TB cases was also performed using the best fit model.
3. Results
The reporting time period of 2006–2013 constituted 32 epidemiological quarters during which a total of 55,636 newly diagnosed sputum smear-positive cases were registered to DOTS. The average number of cases notified/quarter was 1738 (standard deviation ±449.31). The annual number of cases varied over the period of the study, with a maximum of 7771 in 2011 and a minimum of 4990 in 2006. An increasing trend of 5% of TB cases was observed. Within the calendar year, the maximum number of patients was observed in the second quarter of 2011 (2932 cases) and the minimum of cases was observed in the first quarter of 2006 (207 cases), as shown in Table 1. In general, the maximum number of cases was reported in summer (second and third quarters), then winter (first and fourth quarters).
| Periods | Year | ||||||||
|---|---|---|---|---|---|---|---|---|---|
| 2006 | 2007 | 2008 | 2009 | 2010 | 2011 | 2012 | 2013 | Total | |
| Q1 | 207 | 1730 | 1989 | 1663 | 1959 | 1905 | 1869 | 1746 | 13,068 |
| Q2 | 1547 | 1589 | 2063 | 1933 | 2397 | 2932 | 2304 | 2304 | 17,069 |
| Q3 | 1697 | 1563 | 1785 | 1654 | 1802 | 1631 | 1921 | 1947 | 14,000 |
| Q4 | 1539 | 1309 | 1480 | 1554 | 1534 | 1303 | 1381 | 1399 | 11,499 |
| Total | 4990 | 6191 | 7317 | 6804 | 7692 | 7771 | 7475 | 7396 | 55,636 |
Quarterly pulmonary TB incident cases from 2006-2013 in Lahore, Pakistan.
More cases were reported among males than females as shown in Table 2 (male to female ratio of 1.12). When grouped into similar age groups, females predominated at the age of 15–24 years (male to female ratio of 0.84), as shown in Fig. 1. In the rest of the age groups, the disease predominated in males.
| Age | Male | Female | Total | M:F |
|---|---|---|---|---|
| 0–14 | 688 | 1616 | 2304 | 0.43 |
| 15–24 | 7991 | 9498 | 17,489 | 0.84 |
| 25–34 | 5703 | 4905 | 10,608 | 1.16 |
| 35–44 | 4446 | 3462 | 7908 | 1.28 |
| 45–54 | 4471 | 3200 | 7671 | 1.40 |
| 55–64 | 3334 | 2008 | 5342 | 1.66 |
| 65 or < | 2759 | 1501 | 4260 | 1.84 |
| Total | 29,392 | 26,244 | 55,636 | 1.12 |
M, male; F, female.
Age and sex wise notification of pulmonary TB cases, 2006–2013.
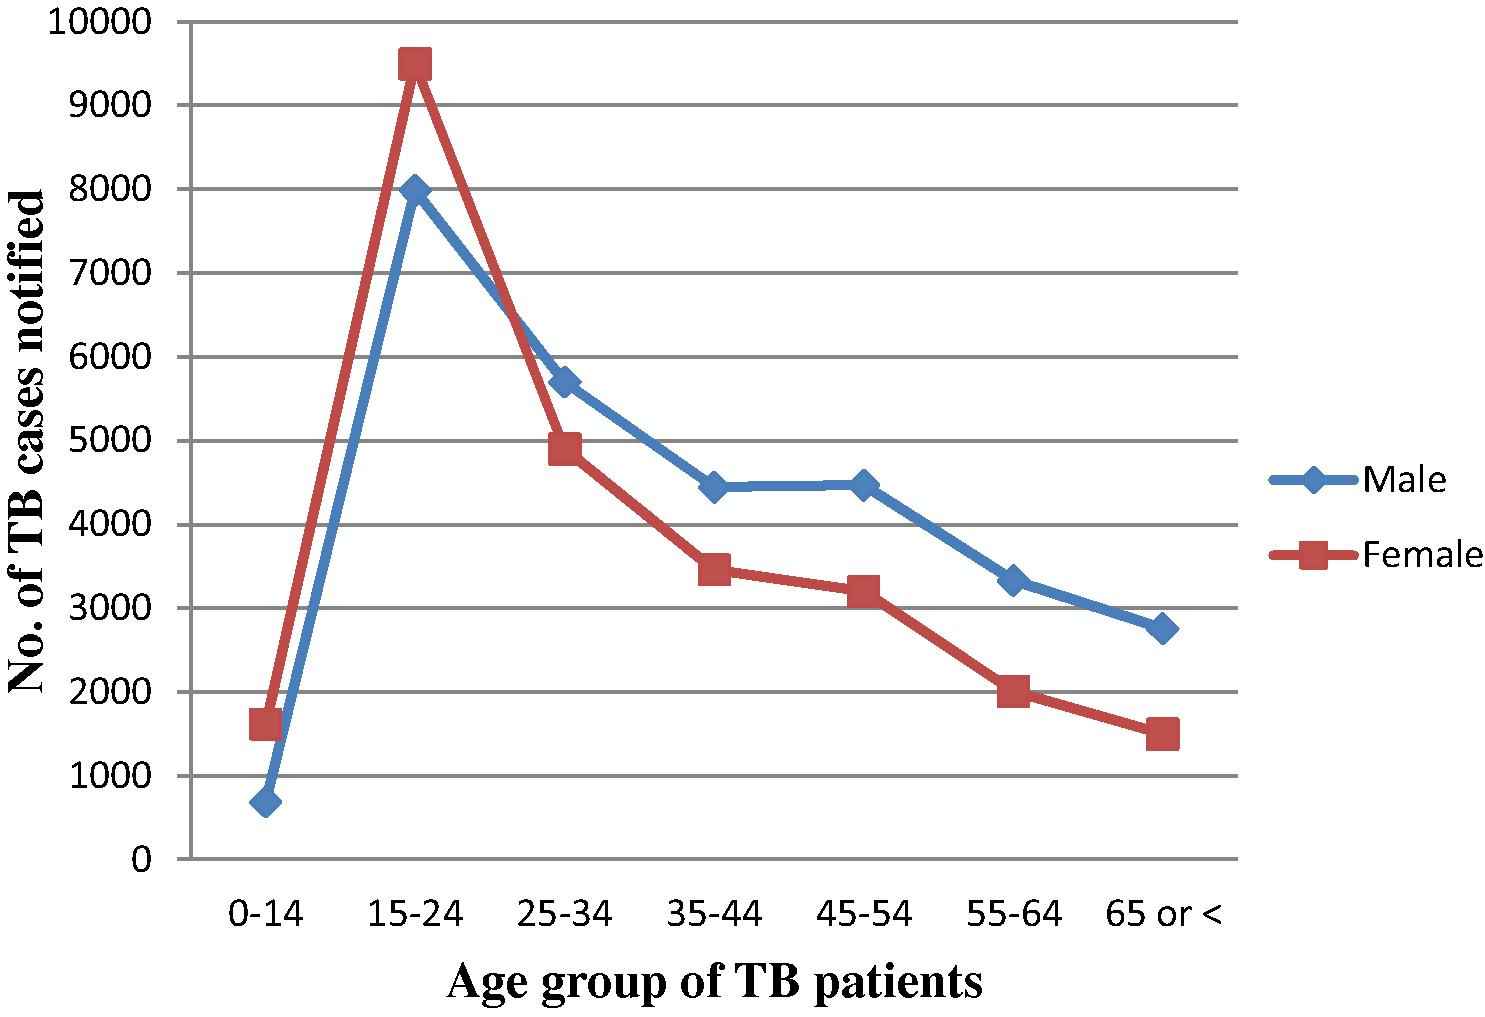
Age- and sex-wise notification of pulmonary tuberculosis (TB) cases, 2006–2013.
3.1. Correlation and regression analysis
Pearson’s correlation coefficient was calculated between the number of TB patients and the mean temperature on a quarterly basis. The correlation was found to be significant at the 0.01 level, with p = 0.006 and r = 0.477, which indicated a direct relationship between the number of patients in summers and temperature.
Fig. 2 clearly shows that there has been a steady increasing trend in the TB cases over the study period. The series exhibited a number of peaks; significant peaks appeared at each second and third quarter of the year, which represent the summer season. A seasonal pattern is observed, with a peak of newly registered cases with an equal interval of quarters.
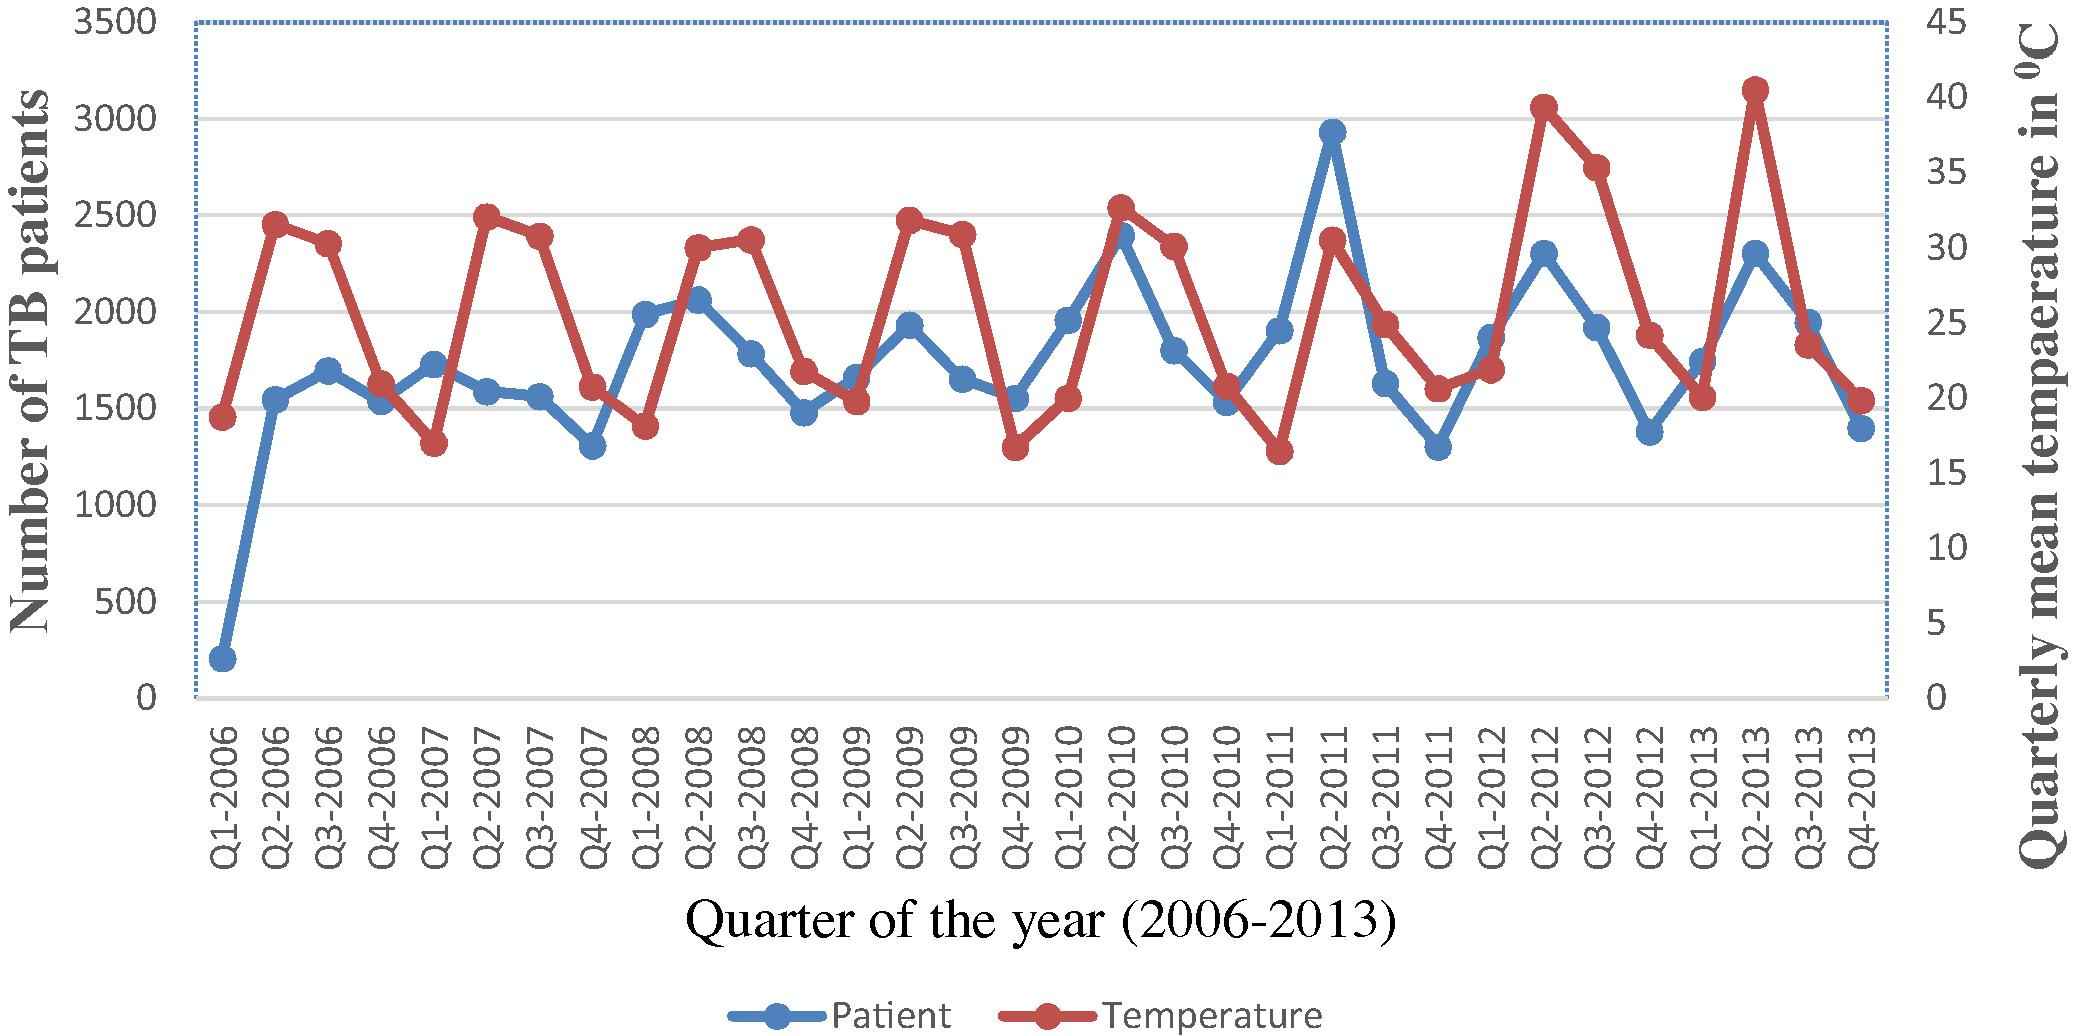
Quarterly notified tuberculosis (TB) cases and quarterly mean temperature from 2006 to 2013.
Linear regression analysis results with a value of r = 0.477 suggest that 47% of the variation in TB case notification can be explained by the variation in mean temperature.
3.2. Time series analysis
The autocorrelation function and partial autocorrelation were analyzed for the stationarity of the data. The autocorrelation function showed a significant peak at a lag of 4 (autocorrelation = 0.429; Box–Ljung statistics (p = 0.021) suggesting the presence of seasonality in the data. Partial autocorrelation also showed a significant peak at a lag of 4, which confirmed the presence of seasonality as shown in Fig. 3.
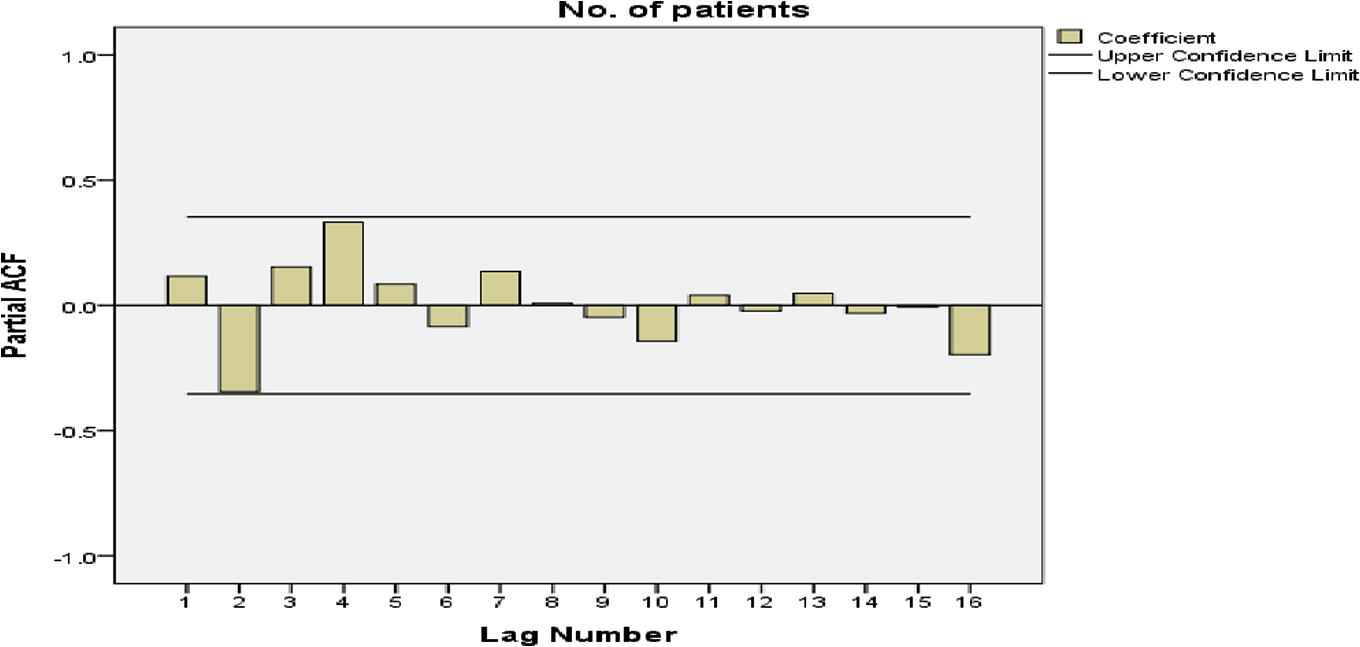
Partial autocorrelation (PCAF) of quarterly notified tuberculosis (TB) cases (2006–2013) with significant peak at lag 4.
The time series sequence chart showed periodic seasonal fluctuations and the trend in the data. The expert modeler of SPSS version 20 suggested Winter’s additive as the best fit model for the time series. Fig. 4 shows that the observed values and the predicted model values matched reasonably well and there is a consistency in the trend.
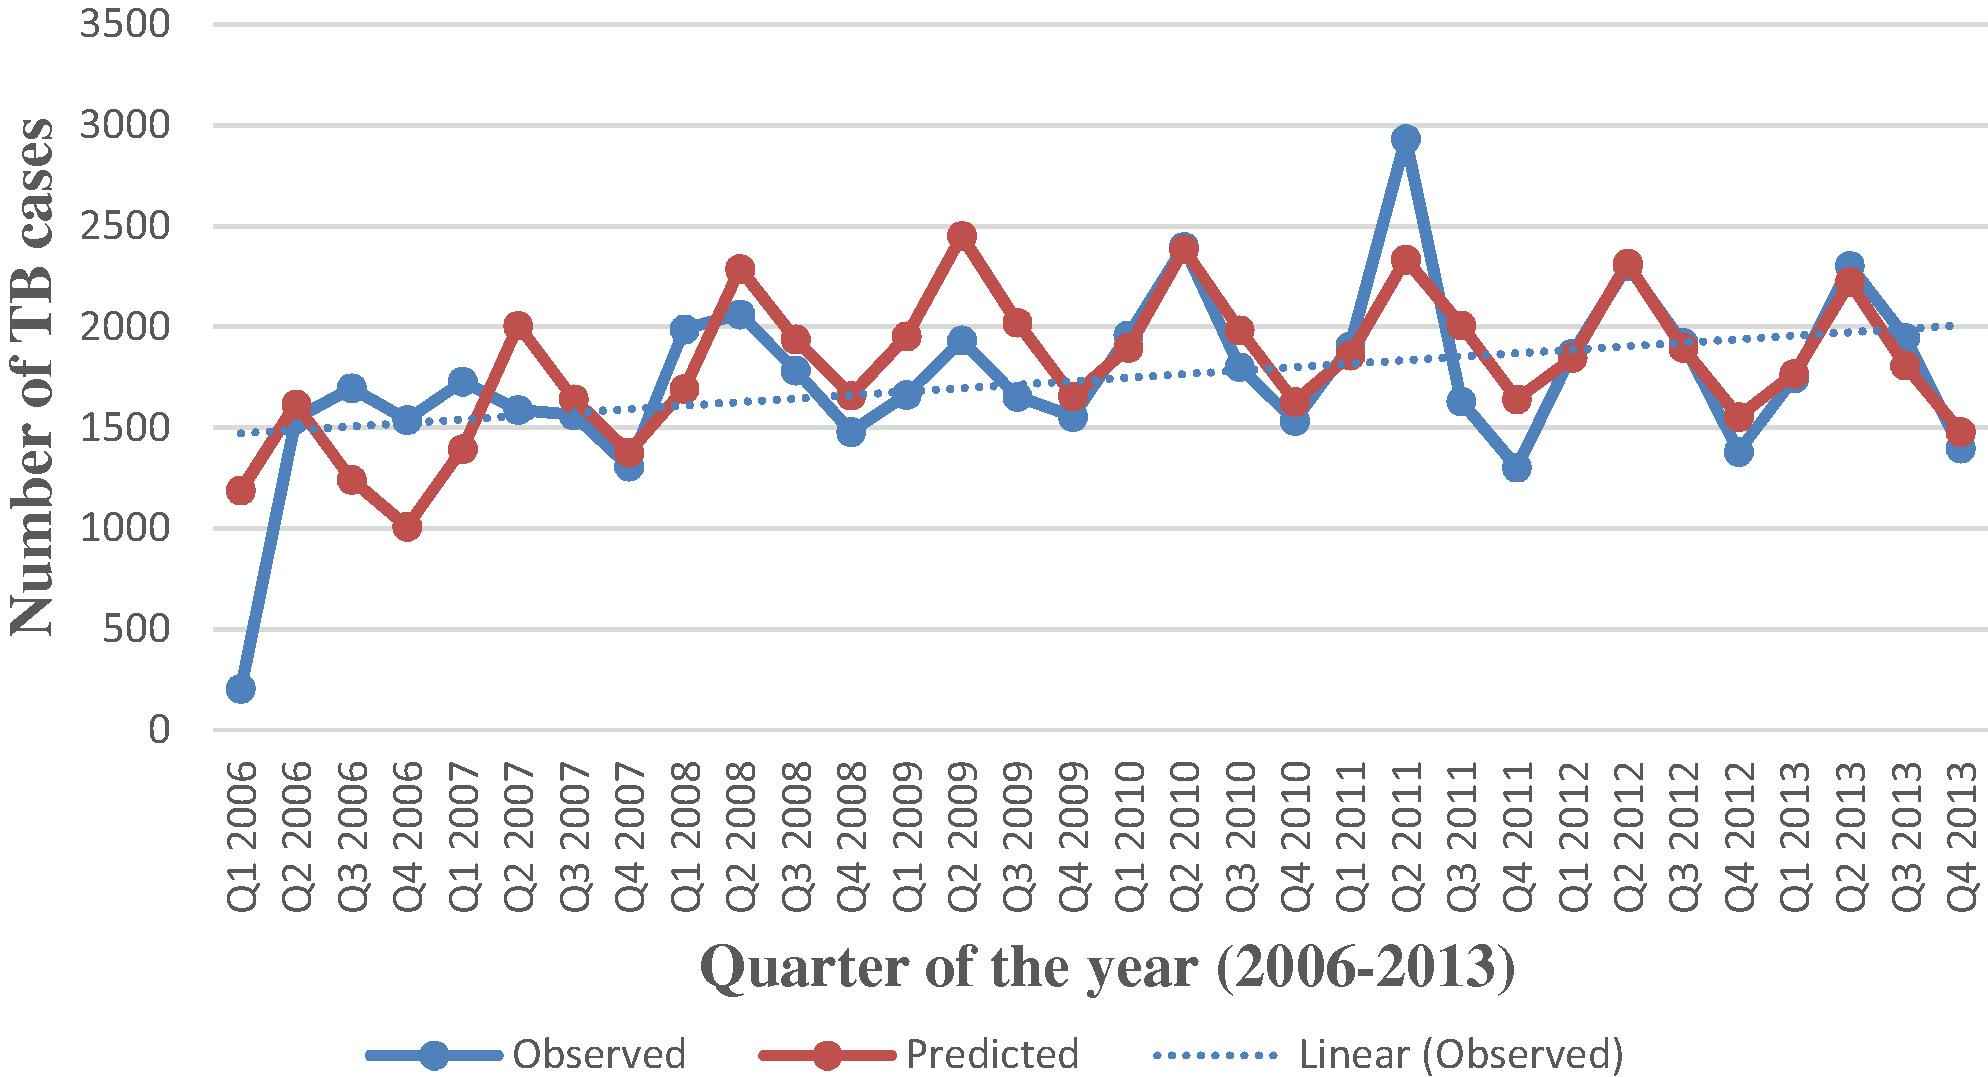
Actual and predicted values of tuberculosis (TB) cases, 2006–2013 with a dotted trend line.
The expert modeler predicted the Holt–Winter’s method, which is designed for the time series that exhibits a linear trend with constant (additive) seasonal variations.
The additive method is preferred when the seasonal variations are approximately constant through the series. It is generally considered to be best suited to forecasting a time series [7]. With the additive method, the seasonal component is expressed in absolute terms in the scale of the observed series, and in the level equation the series is seasonally adjusted by subtracting the seasonal component.
The Ljung–Box (modified Box–Pierce) test indicated that the model was correctly specified (Table 3). The expert modeler detected no outliers in the data.
| Model parameter | Stationary R2 | Ljung–Box statistics | Model type | ||
|---|---|---|---|---|---|
| Statistics | d.f. | p-value | |||
| Quarterly TB incidence | 0.693 | 23.356 | 15 | 0.077 | Winter’s additive model |
TB, tuberculosis.
Model statistics for TB data.
In the time series modeler, there are a number of different statistics for goodness of fit, but we used the stationary-squared value. This statistic estimates the proportion of the total variation in the series that is explained by the model when there is a trend or seasonal pattern, as is the case here. A better fit is indicated when the stationary-squared value is larger (up to a maximum value of 1). A value of 0.693 meant that the model could explain 69.3% of the observed variation in the series.
Observations without seasonal variation have a seasonal component of 0. Table 4 shows that in the second quarter, the seasonal adjusted factor was >0; in this quarter, the registered TB cases were more than in the other quarters. In the second quarter, with the highest seasonal adjusted factor of 375.52, the notification of TB cases was 375.52% above the rest of the quarters.
| Period | Seasonal adjusted factor (SAF) |
|---|---|
| Q1 | 4.30 |
| Q2 | 375.52 |
| Q3 | −16.74 |
| Q4 | −363.08 |
Seasonal adjustment factor (SAF) for TB cases (2006–2013).
The same model was used to forecast the quarterly TB incidence for the future from the first quarter in 2014, to the fourth quarter in 2016, and the values are depicted in Fig. 5. The forecasting also shows a declining trend over time, with a peak during the second quarter of each year.
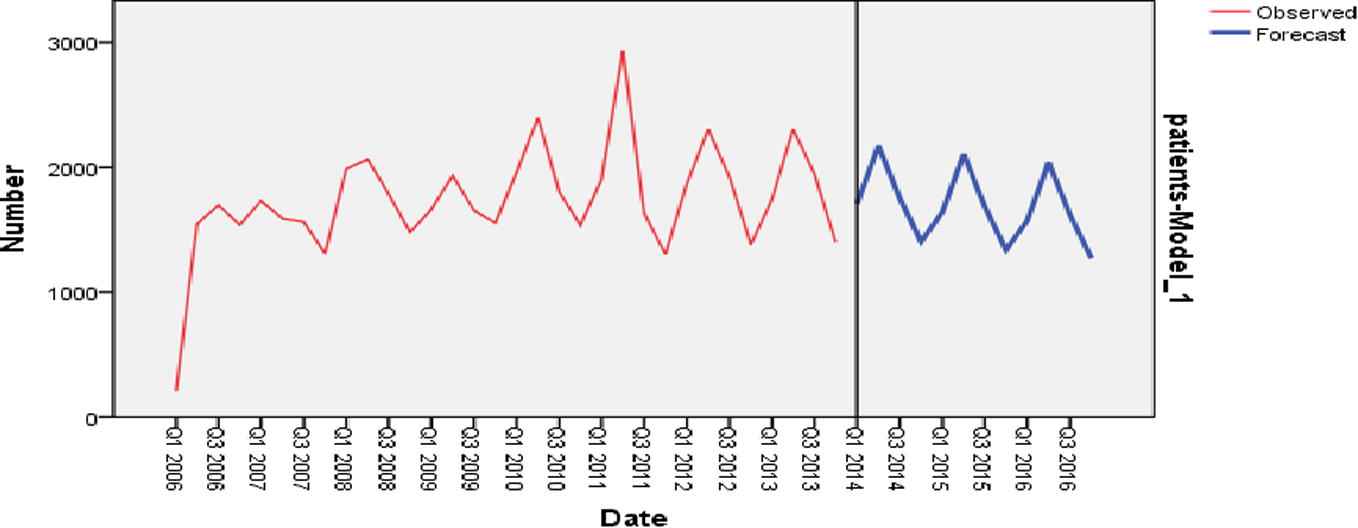
Sequence chart for forecasted tuberculosis (TB) cases in the near future (2014–2016).
4. Discussion
In this study, the seasonality of TB case notification with a peak in the second quarter has been confirmed by correlation–regression and time series analysis. These results were observed to be consistent for the whole study period. Similar results have already been shown in different studies in the UK [15] and Hong Kong [14], where TB cases notification was high in summer. Although the exact mechanism underlying seasonality is not known, it has been suggested that many social, cultural, physiological, and immunological factors may be involved [18]. Environmental factors such as temperature, humidity, precipitation, length of day light, immune suppression, gender differences, poor healthcare facilities, and delayed or failure of diagnostics have been suggested to be involved in the seasonal pattern of TB [19]. In developing countries such as Pakistan, the TB incidence rate is quite high in rural populations as compared to urban populations, because of poor healthcare facilities and unawareness, which may account for seasonal variation in case notification [20].
A rise in TB notification in summer is basically influenced by the winter season, mainly because of two reasons. In winter, overcrowding, indoor pollution, and vitamin D deficiency increase the probability of duration of contact with infection. This probability is increased when other seasonal infections like flu, pneumonia, asthma, fever, etc. reduce immunity, which increases the susceptibility to the infection if exposed to an infected person [21]. Secondly, mycobacteria are slow growing and take 7–8 weeks to proliferate and show symptoms in favorable conditions [22]. Hence, at the onset of spring and with the rise in temperature in summer, the TB case notification increases. It is believed that in winter, symptoms of TB may possibly not be seen immediately after becoming infected, but when summer approaches and the temperature increases, the bacterium starts proliferating and growing with positive symptoms of the infection. It has been generally observed that for rural populations, summer is the busiest period of the year as it is the harvesting time, people become financially stable, and then infected people seek healthcare assistance, which results in increased case notification. It is also possible that all infected individuals may not be notified, so it is important to find infected and exposed persons to control the spread of infection [23].
In the present study, it was also observed that at the reproductive age of 15–24 years, more cases were reported among females than males (M:F ratio 1.12), which matches well with the previous findings [20]. At present, it is not fully understood why TB notification has been observed to be high among females in Pakistan, but this is an important epidemiological finding from the point of view of public healthcare. Inequitable access to healthcare facilities and reporting biases are not the only reason for observed differences in case notifications and there are genuine gender differences in the biology and epidemiology of TB.
5. Conclusion
A rise in notification of TB cases in summer clearly shows that temperature has a direct relationship with the increasing rate of infection, which is shown by the seasonality of the disease in the study area. These results showed that transmission of the disease was higher in winter and the infection notification was higher in summer. Investigation of risk factors responsible for increased transmission of the disease during winter months can help to control the spread of the infection. In rural areas, clinicians need to educate people on health issues. Healthcare facilities should be improved for timely diagnosis, treatment, and prevention of the disease.
Conflicts of interest
Not declared.
Acknowledgments
The authors thank Dr. Darkhashan Badar, Director National TB control program, Lahore and Syed Pervaiz Akhtar, Metrology department, Lahore, for their valuable support in data management.
References
Cite this article
TY  - JOUR
AU  - Aasia Khaliq
AU  - Syeda Aadila Batool
AU  - M. Nawaz Chaudhry
PY  - 2015
DA  - 2015/08/28
TI  - Seasonality and trend analysis of tuberculosis in Lahore, Pakistan from 2006 to 2013
JO  - Journal of Epidemiology and Global Health
SP  - 397
EP  - 403
VL  - 5
IS  - 4
SN  - 2210-6014
UR  - https://doi.org/10.1016/j.jegh.2015.07.007
DO  - 10.1016/j.jegh.2015.07.007
ID  - Khaliq2015
ER  -