
A cohort study of chronic diseases for Mongolian people: Outline with baseline data of the Moncohort study
- DOI
- 10.1016/j.jegh.2015.12.001How to use a DOI?
- Keywords
- Non-communicable disease; Risk factor; Socioeconomic status
- Abstract
Many Mongolian people suffer from non-communicable chronic diseases. In order to plan preventive strategies against such diseases, we designed a community-based prospective cohort study of chronic diseases, called the Moncohort study, in Mongolia. This is the first nationwide large-scale cohort study of chronic diseases. This paper describes the study’s rationale, design and methods with baseline data.
Mongolian residents aged ⩾40 years were selected nationwide from many geographic regions in 2009. Data were collected on demographics, socioeconomic status, lifestyle, and anthropometric and biochemical measurements.
In total, 2280 Mongolian residents were registered in the survey. Socioeconomic, lifestyle, anthropometric and biochemical characteristics were differentiated by gender and geographical area in descriptive data. Aging, low social class, physical inactivity and infrequent fruits intake were positively associated with histories of chronic disease in men, while aging was positively associated with histories of chronic disease in women.
Factors associated with chronic diseases reveal gender-oriented strategies might be needed for their prevention. Detailed prospective analyses will illustrate the impact of risk factors on chronic diseases and lead to evidence for designing programs aimed at preventing chronic diseases and related disorders in Mongolia.
- Copyright
- © 2016 Ministry of Health, Saudi Arabia. Published by Elsevier Ltd.
- Open Access
- This is an open access article under the CC BY-NC-ND license (http://creativecommons.org/licenses/by-nc-nd/4.0/)
1. Introduction
Mongolia is a landlocked country in east-central Asia (with a relatively high altitude and cold weather in winter). Non-communicable chronic diseases (NCDs), such as cardiovascular disease (CVD), cancer, hepatic diseases, and diabetes mellitus, affect people’s quality of life and socioeconomic status (SES); therefore, the prevention of chronic diseases is an urgent need for public health [1,2]. In 2008, 60% of all deaths in the world, resulted from NCDs, and 80% of these deaths occurred in low- and middle-income countries [3,4]. The highest number of deaths occurred in the Western Pacific and South-East Asia regions [5].
Among the regions, with a modernization of whole country, Mongolia has experienced an epidemiological transition of NCDs over the last 20 years. The World Health Statistics reported that an age-standardized mortality rate by NCDs was 966 (per 100,000 population) in 2014 [6] and NCDs were estimated to account for 79% of total deaths in Mongolia [7]. A health burden caused by NCDs, such as CVD and cancer in particular, has increased [6,7]. Of important, CVD has been the leading cause of death in Mongolia [1,8] and the CVD-related morbidity is increasing year by year [8,9]. The Mongolian survey of 2006 revealed that nine in every ten people had at least one risk factor for developing NCDs [10,11]. The life expectancy of Mongolian people compared to those in developed countries is shorter as a result of NCDs. In 2009, the level of Mongolia’s life expectancy was 153rd out of 223 countries around the world [8,9]. Thus, building urgent strategies against NCDs is required.
As one of the analytical study designs of epidemiology, a prospective cohort study is considered the best design to determine the impact of risk factors on health outcomes, particularly disease morbidity and mortality [12,13]. There have been many cohort studies for chronic diseases around the world and their results have provided the best evidence for health policy and preventive programs for chronic diseases [14–19].
In order to determine the risk factors for chronic diseases, several surveys have previously been conducted in Mongolia [10,11,20–26]. However, these surveys were not always large-scale, used descriptive and cross-sectional study designs, and data were very limited on risk factors for chronic diseases in Mongolian people. A nationwide population-based cohort study has not yet been conducted in Mongolia. Therefore, we have been conducting the Moncohort study, a nationwide population-based large-scale prospective cohort study, using a representative random sample of Mongolian adults in order to assess the risk factors for chronic diseases. The results of our study will help develop national strategies against chronic diseases in Mongolia. In addition, it will provide data that can easily be compared to studies from other countries. Here, we describe the study’s outline with the baseline data. The present paper further analyzed the factors associated with the histories of chronic diseases.
2. Materials and methods
2.1. Study design
First, a baseline survey for determining the risk factors for chronic diseases was conducted by a cross-sectional study design. This study followed the WHO “STEP wise approach to surveillance of NCDs” (STEPS) methodology [27]. Next, a prospective cohort study design was used through follow-up periods of 5, 10 and 20 year intervals.
Participants will be followed until death or until dropout from the study. By using the identification (ID) number, the database is regularly linked with the Department of National Statistics of Mongolia, which receives notifications of all cases of CVD, cancer, diabetes mellitus and hepatic diseases. Causes of death will be obtained from the Registry of Death system.
After completion of the cohort study, in order to determine the cumulative incidence of NCDs over the study period, the Kaplan–Meier method will be used to generate the survival function of NCDs mortality. The log-rank test will be used to compare the survival distributions of the two groups. Cox proportional hazards models will construct to estimate the association between each variable and the outcome interest. The cutting age of the important information will also be published even before completion of the cohort study.
2.2. Ethical statements
The Moncohort study was approved by the Ethical Review Committees of the Ministry of Health, Mongolia on January 20, 2009. All participants gave written informed consent for the study.
2.3. Study population
Mongolia is divided into four main geographic regions: Western, Eastern, Khangai-Gobi and Central. In order to properly represent Mongolia’s demographics, the country may be divided into five areas: four geographical regions and a capital city (Fig. 1). Samples were drawn in proportion to the target population from each area. The primary objective of this study is an independent association between each variable and outcome of interest, which is described by geographical region. The participants were male or female and ⩾40 years of age.
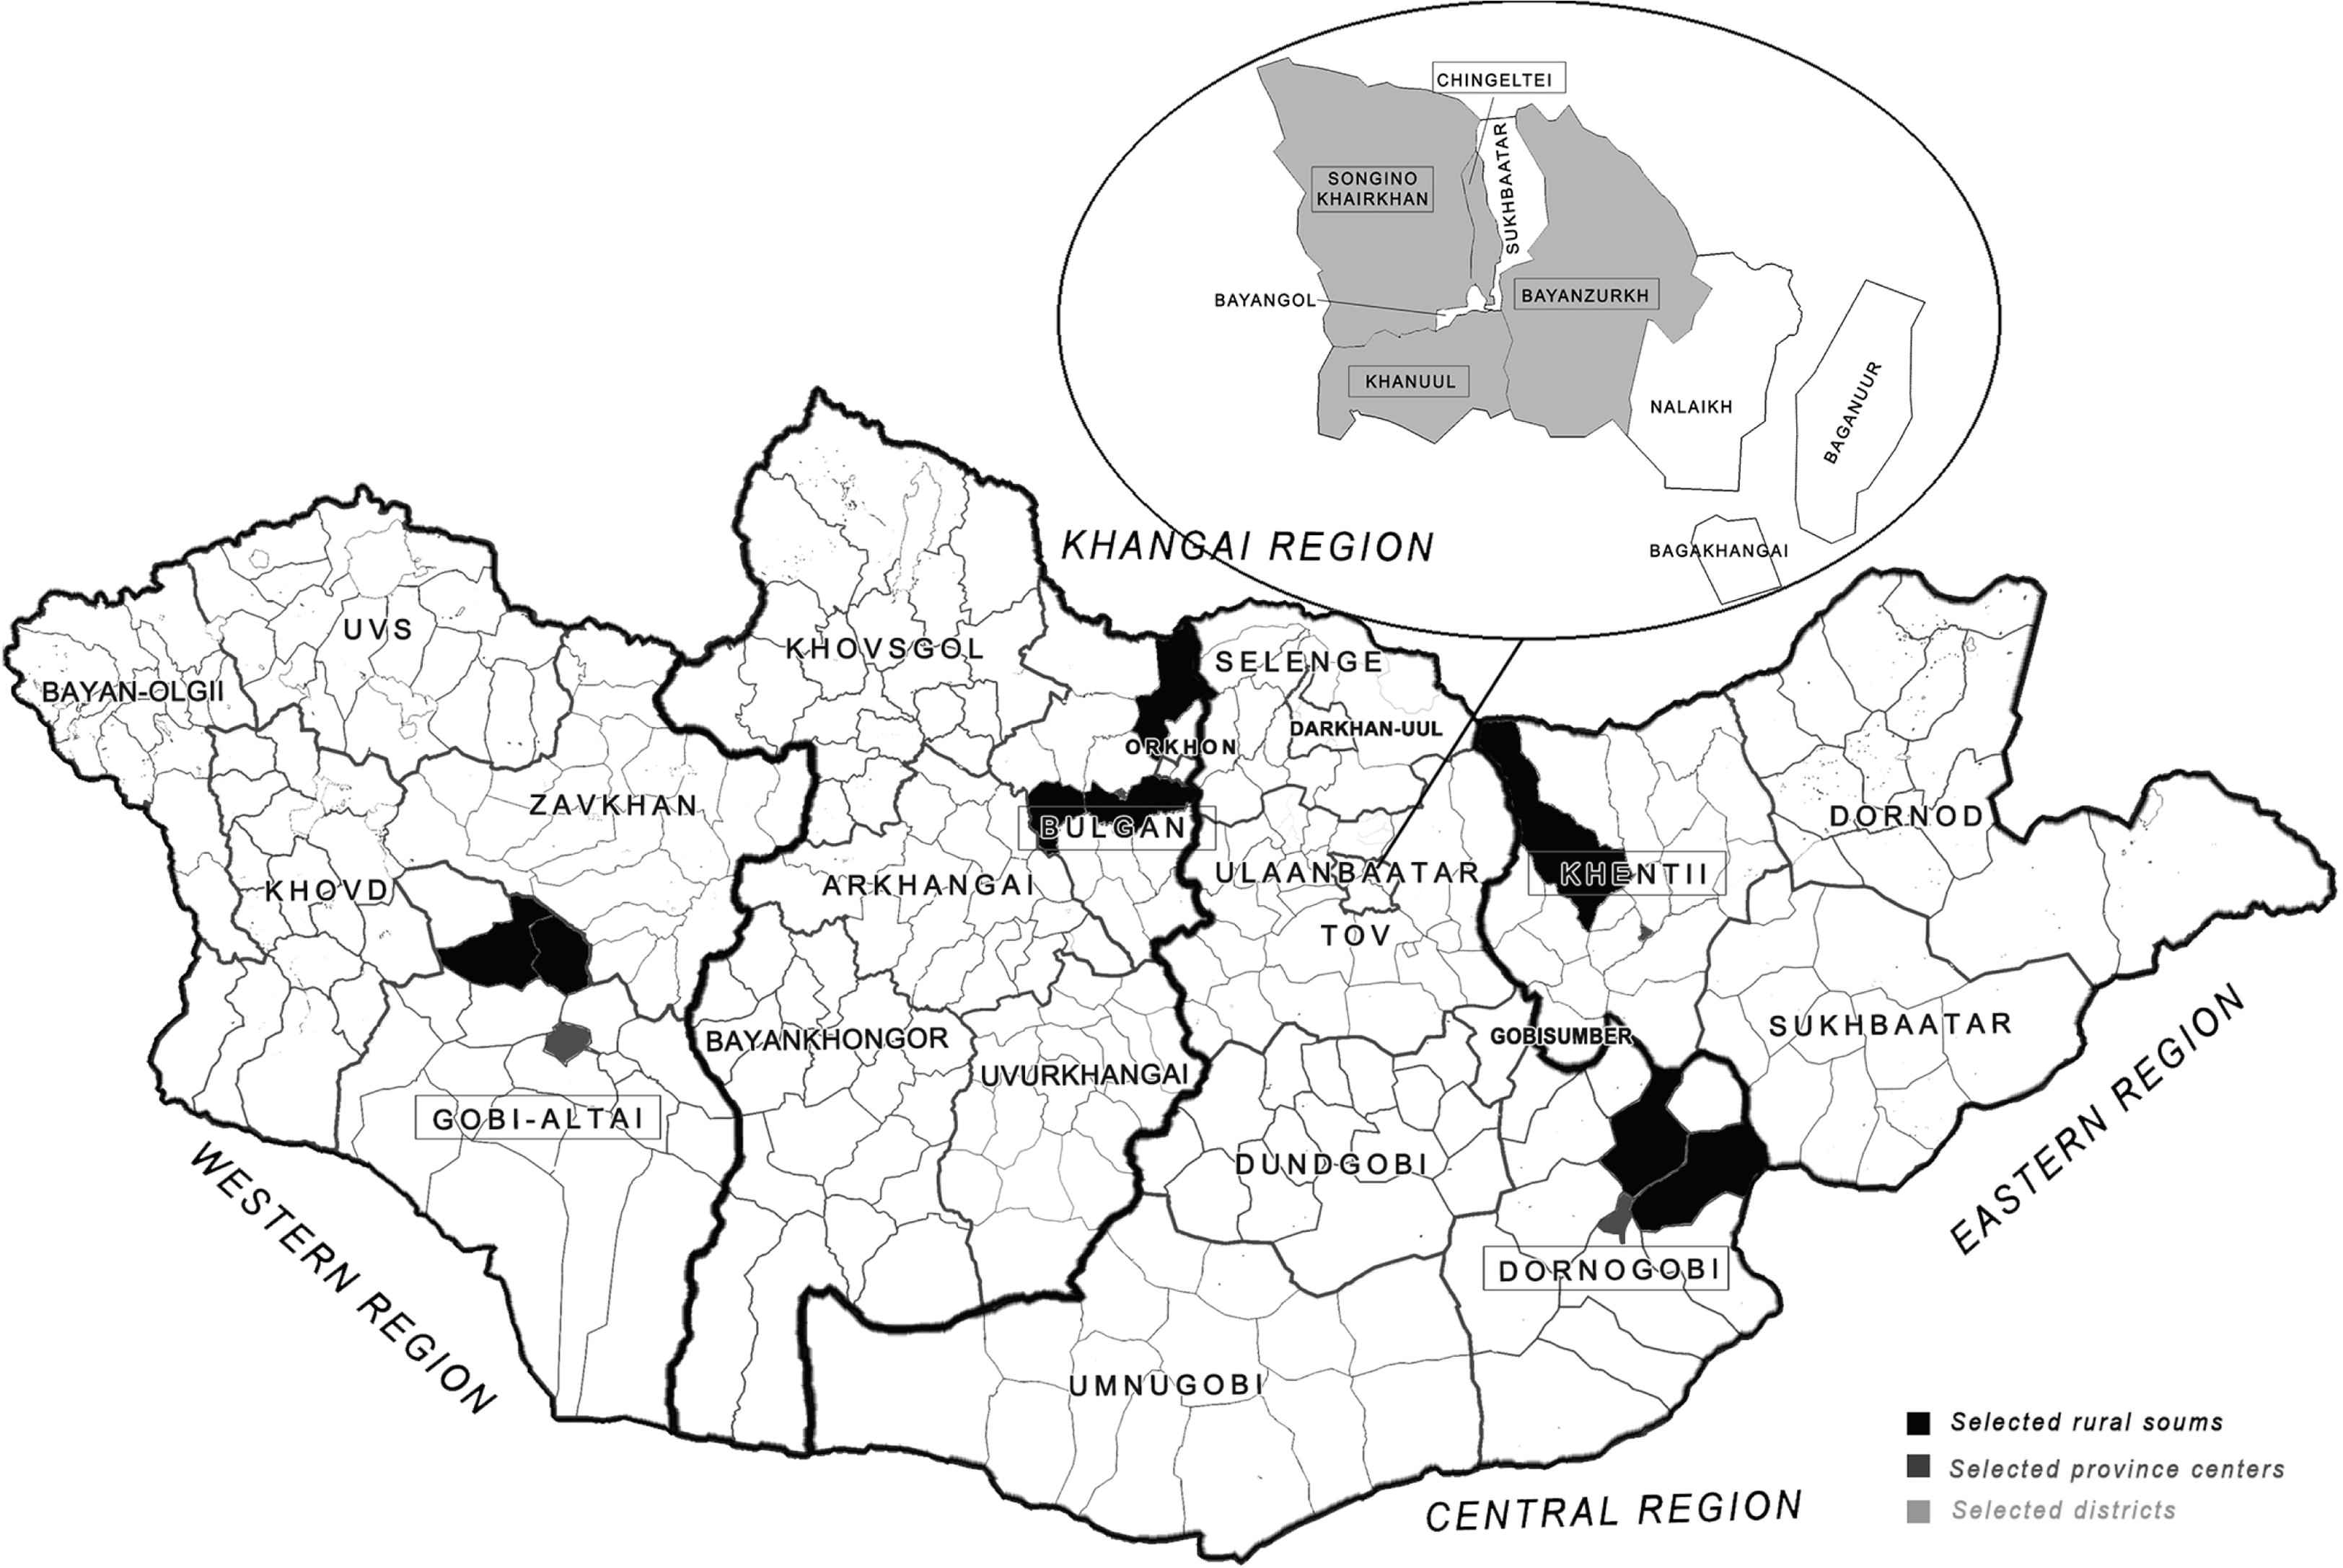
Map of the geographical areas of the participants in Mongolia. Copyright: This figure is originally described by the authors.
Administratively, Mongolia is divided into its capital city and 21 provinces (aimag in Mongolian). The capital city of Ulaanbaatar is divided into districts and those districts are further divided into khoroos. As a result, Mongolia presently has nine districts and 132 khoroos [8]. In addition, provinces are divided into provincial centers and rural soums (villages, lower rural administrative units); the country has 21 aimags and 338 rural soums. For a proportional selection of the target population from these areas, participants for this study were selected using a randomized multistage sampling method [27] from the target population.
2.4. SES variables
Education variables, such as the start of and total years of education, were collected, and categorized per the Mongolian education system, dividing into 5 categories as elementary (less than 7 years), incomplete secondary (7–9 years), complete secondary (10–12 years), vocational (13–14), and university graduates (>14 years). Monthly income was categorized into the three types of lower, middle, and upper levels according to the average salaries per month (Mongolian National Statistic Office 2009).
Socioeconomic position was measured and defined as social classes based on the longest held occupation, using a Registrar General’s Classification [28], where Class I corresponded to the upper social class. Participants were placed into 6 groups of social class I (professional, e.g., physicians, engineers), social class II (managerial, e.g., teachers, sales managers), social class III (semi-skilled non manual, e.g., bricklayer), social class IV (partly skilled, e.g., postmen), social class V (unskilled, e.g., porters, laborers), and non-employed VI (retired with no information on last occupation, unemployed, housewives, students, persons whose stated occupation could not be classified).
2.5. Sample size calculation
Mortality from chronic diseases is a primary outcome tracked in our study. In order to calculate the sample size, the mortality from chronic diseases for national populations (p = 0.5 [approximately 50%]) [27] was estimated. A 95% confidence interval (Z = 1.962), a 5% acceptable margin of error (e = 0.05), a complex sampling design effect coefficient of 1.5, and an equal representation of the location group were applied to the calculation. The sample size calculation formula [27] is n = Z2 × (p × [1 − p])/e2; therefore, 1.962 × (0.5 × [1 − 0.5])/0.052 = 384. Estimates were made using multiplication in the design effect and number of locations (including urban, province center and rural soum), with results of 384 × 1.5 × 3 = 2304. Thus, the sample size needed was estimated to be approximately 2304 participants.
2.6. Data collection
Data were collected from March through August 2009. The questionnaire, and anthropometric and biochemical data were obtained on the same day and taken within about one hour. Before the study, we distributed an information sheet which explained the purpose of the study to participants, who were randomly selected by the registration of general practitioners. The participants were invited to local general practitioner centers in the urban districts, local rural soum clinics, and provincial centers.
A standard questionnaire of the WHO STEPS Surveillance Manual [27] was used. The questionnaire consisted of eight chapters with a total of 80 closed-ended and open-ended questions [27]. This questionnaire asked participants about their SES, lifestyle characteristics, family history and medical history. Participants’ answers to the questionnaires were obtained by interview.
Seated blood pressure readings, height, weight, waist and hip circumference, and blood lipids and glucose levels were obtained. Body weight was measured by using electronic scales (Beijing, China). Height was measured using the Somatometre-Stanley 04-116 device (Moscow, Russia). After the subjects had rested for 5 min, blood pressure was measured two times on the subject’s right arm while in the sitting position using a sphygmomanometer. The third measurement was taken if there was a difference of more than 20 mm Hg between the first two measurements. The mean of two measurements was taken for blood pressure. Fasting blood total cholesterol, high- and low-density lipoprotein cholesterol (HDL-C and LDL-C), triglycerides and glucose were assayed by a photometrical method using a biochemistry analyzer (Prietest touch, mini screen, Mumbai, India). For testing, 7 ml of blood was collected and transported, frozen, to Ulaanbaatar. Laboratory analyses were performed in one laboratory center. The data were assessed according to WHO criteria.
2.7. Statistical analysis
Data were coded according to WHO guidelines [27]. Collected data were analyzed using the Statistical Package for Social Sciences (SPSS) version 17.0 (SPSS Inc., IL, USA). Simple statistical analyses were made by the t-test, Chi-square test and ANOVA. An odds ratio (OR) with 95% confidence interval (CI) on the factors associated with a previous history of at least one chronic disease was calculated by a logistic regression analysis. An adjusted OR (95% CI) was calculated in adjusting for their basic characteristics, such as SES and lifestyle (age [as a continuous variable], education, occupation, alcohol drinking and smoking habits, dietary habits and physical activity [as defined in cases with at least 10 min walk a day]). All statistical tests were two-sided; a level of p < 0.05 was used to indicate statistical significance.
3. Results
In total, 2280 Mongolian residents were registered in the survey after exclusion of 89 subjects due to incomplete answers for the questionnaire and missing data of anthropometric measurements. The response rate was 98.9% (2280/2304). In a whole population (675,171 people of ⩾40 years, available from a national statistic 2008 [8]), 2280 residents were recruited. By region, in Ulaanbaatar (290,742 people of ⩾40 years), 1267 residents were recruited. In Central (112,846 people of ⩾40 years), 319 were recruited, in Eastern (48,597 people of ⩾40 years), 139 were recruited, in Western (88,196 people of ⩾40 years), 219 were recruited, in Khangai (134,790 people of ⩾40 years), 339 were recruited.
Table 1–1 represents the demographic characteristics of participants. Their mean age was 52.9 ± 9.2 years. A higher percentage of men had graduated from secondary school compared to women; however, in contrast, a higher percentage of women were college graduates compared to men.
| Factors | Total (n = 2280) | Men (n = 851) | Women (n = 1429) | P value |
|---|---|---|---|---|
| Age | ||||
| Mean | 52.9 ± 9.2 | 53.4 ± 9.2 | 52.6 ± 9.2 | 0.056 |
| 40–44 year | 424 (18.6) | 144 (16.9) | 280 (19.6) | 0.139 |
| 45–49 year | 525 (23.0) | 189 (22.2) | 336 (23.5) | |
| 50–54 year | 499 (21.9) | 181 (21.3) | 318 (22.3) | |
| 55–59 year | 362 (15.9) | 141 (16.6) | 221 (15.5) | |
| Above 60 | 470 (20.6) | 196 (23.0) | 274 (19.2) | |
| Ethnicity | 0.098 | |||
| Khalkh | 2120 (93.0) | 784 (92.1) | 1336 (93.5) | |
| Buriad | 38 (1.7) | 15 (1.8) | 23 (1.6) | |
| Durvud | 25 (1.1) | 6 (0.7) | 19 (1.3) | |
| Other | 97 (4.3) | 46 (5.4) | 51 (3.6) | |
| Marital status | 0.0001 | |||
| Married | 1760 (81.3) | 740 (91.4) | 1020 (75.3) | |
| Never married | 52 (2.4) | 22 (2.7) | 30 (2.2) | |
| Divorced | 71 (3.3) | 18 (2.2) | 53 (3.9) | |
| Widowed | 282 (13.0) | 30 (3.7) | 252 (18.6) | |
| Education | 0.0001 | |||
| Elementary | 230 (10.1) | 68 (8.0) | 162 (11.3) | |
| Incomplete secondary | 531 (23.3) | 253 (29.7) | 278 (19.5) | |
| Complete secondary | 606 (26.6) | 221 (26.0) | 385 (26.9) | |
| Vocational | 357 (15.7) | 82 (9.6) | 275 (19.2) | |
| University | 556 (24.4) | 227 (26.7) | 291 (20.4) | |
| Occupation | 0.0001 | |||
| Social class I | 690 (30.3) | 261 (30.7) | 429 (30.0) | |
| Social class II | 431 (18.9) | 117 (13.7) | 314 (22.0) | |
| Social class III | 115 (5.0) | 31 (3.6) | 84 (5.9) | |
| Social class IV | 90 (3.9) | 72 (8.5) | 18 (1.3) | |
| Social class V | 199 (8.7) | 88 (10.3) | 111 (7.8) | |
| Social class VI | 755 (33.1) | 282 (33.1) | 473 (33.1) | |
Data are mean ± standard deviation or numbers (%). P-values: men vs. women.
Demographic and socioeconomic characteristics by gender.
Table 1–2 shows study participants’ smoking, alcohol drinking habits, diet, and physical activity. The number of ex- and current smokers and heavy drinkers was significantly higher for men than for women. The percentage of non-drinkers in the past 12 months and non-smokers was higher for women than for men. Vigorous physical activity at work and in free time was higher among men, with moderate intensity activity in free time higher in women, primarily attributed to housekeeping work being more common among women.
| Factors | Total (n = 2280) | Men (n = 851) | Women (n = 1429) | P value |
|---|---|---|---|---|
| Smoking habits | 0.0001 | |||
| Non smoker | 1600 (70.2) | 311 (36.5) | 1289 (90.2) | |
| Current smoker | 548 (24.0) | 430 (50.5) | 118 (8.3) | |
| Ex smoker | 132 (5.8) | 110 (12.9) | 22 (1.5) | |
| Alcohol drinking habits | 0.0001 | |||
| Non | 911 (40.0) | 211 (24.8) | 700 (49.0) | |
| Low moderate | 429 (18.8) | 101 (11.9) | 328 (23.0) | |
| High moderate | 380 (16.7) | 144 (16.9) | 236 (16.5) | |
| Heavy | 560 (24.6) | 395 (46.4) | 165 (11.5) | |
| Fruit consumption habits | 0.0001 | |||
| Yes | 1605 (70.4) | 532 (62.5) | 1073 (75.1) | |
| No | 675 (29.6) | 319 (37.5) | 356 (24.9) | |
| Vegetable consumption habits | 0.273 | |||
| Yes | 2090 (91.7) | 773 (90.8) | 1317 (92.2) | |
| No | 190 (8.3) | 78 (9.2) | 112 (7.8) | |
| Physical activity | ||||
| Vigorous intensity at work | 323 (20.0) | 185 (29.2) | 138 (14.0) | 0.0001 |
| Moderate intensity at work | 812 (50.1) | 318 (50.5) | 494 (49.9) | 0.839 |
| Vigorous intensity in free time | 426 (18.8) | 212 (25.1) | 214 (15.1) | 0.0001 |
| Moderate intensity in free time | 1379 (60.6) | 430 (50.6) | 949 (66.5) | 0.001 |
| Walking at least 10 min a day | 1935 (84.9) | 709 (83.3) | 1226 (85.8) | 0.116 |
Data are numbers (%). P-values: men vs. women.
Physical activity allows multiple answers of yes.
Lifestyle characteristics of study participants by gender.
Table 1–3 shows anthropometric and biochemical determinants of participants. In terms of body circumference, mean hip circumference was higher in women than in men. Blood glucose levels and triglycerides were significantly higher in men than in women. For women, HDL-C levels were higher than in men. Medical histories of hypertension and cancer were more prevalent in women than in men, while those of ischemic heart disease and stroke were more prevalent in men than in women. There were 68.3% (1507) of individuals with a previous history of at least one chronic disease. No significant differences in family history were noted between the sexes.
| Factors | Total (n = 2280) | Men (n = 851) | Women (n = 1429) | P value |
|---|---|---|---|---|
| Height, cm | 159.6 ± 8.7 | 159.8 ± 8.9 | 159.5 ± 8.5 | 0.418 |
| Weight, kg | 69.4 ± 14.3 | 68.9 ± 13.6 | 69.7 ± 14.7 | 0.230 |
| Body mass index, kg/m2 | 29.6 ± 4.2 | 29.5 ± 4.0 | 29.7 ± 4.2 | 0.096 |
| Upper arm, cm | 29.6 ± 4.2 | 29.5 ± 4.0 | 29.7 ± 4.2 | 0.140 |
| Chest, cm | 94.8 ± 10.3 | 94.3 ± 10.1 | 95.1 ± 10.4 | 0.090 |
| Waist, cm | 88.6 ± 12.7 | 88.0 ± 12.1 | 88.9 ± 13.0 | 0.105 |
| Hip, cm | 97.9 ± 9.6 | 97.3 ± 9.5 | 98.3 ± 9.7 | 0.026 |
| Systolic blood pressure, mm Hg | 127.9 ± 24.2 | 127.1 ± 22.8 | 128.3 ± 24.9 | 0.259 |
| Diastolic blood pressure, mm Hg | 83.4 ± 14.9 | 82.9 ± 14.8 | 83.6 ± 15.0 | 0.333 |
| Blood glucose, mmol/L | 5.03 ± 1.31 | 5.11 ± 1.39 | 4.98 ± 1.26 | 0.029 |
| Total cholesterol, mmol/L | 4.64 ± 1.10 | 4.69 ± 1.09 | 4.62 ± 1.10 | 0.163 |
| Triglyceride, mmol/L | 1.60 ± 0.89 | 1.72 ± 1.12 | 1.53 ± 0.70 | 0.0001 |
| HDL-C, mmol/L | 1.55 ± 0.63 | 1.50 ± 0.58 | 1.57 ± 0.66 | 0.009 |
| LDL-C, mmol/L | 2.40 ± 1.02 | 2.43 ± 1.08 | 2.37 ± 0.99 | 0.212 |
| Previous history | ||||
| Hypertension | 1110 (48.7) | 358 (42.1) | 752 (52.6) | 0.0001 |
| Stroke | 119 (5.2) | 52 (6.1) | 67 (4.7) | 0.313 |
| Ischemic heart disease | 85 (3.7) | 44 (5.2) | 41 (2.9) | 0.018 |
| Cancer | 54 (2.4) | 10 (1.2) | 44 (3.1) | 0.013 |
| Liver cirrhosis | 172 (7.5) | 68 (8.0) | 104 (7.3) | 0.341 |
| Hepatitis | 306 (13.4) | 101 (11.9) | 205 (14.4) | 0.091 |
| Diabetes mellitus | 98 (4.3) | 35 (4.1) | 63 (4.4) | 0.585 |
| At least one history | 1507 (68.3) | 527 (64.2) | 980 (70.7) | 0.001 |
| Family history | ||||
| Hypertension | 1233 (54.1) | 442 (51.9) | 791 (55.4) | 0.233 |
| Stroke | 606 (26.6) | 217 (25.5) | 389 (27.2) | 0.212 |
| Ischemic heart disease | 245 (10.7) | 85 (10.0) | 160 (11.2) | 0.518 |
| Cancer | 610 (26.8) | 207 (24.3) | 403 (28.2) | 0.100 |
| Liver cirrhosis | 416 (18.2) | 158 (18.6) | 258 (18.1) | 0.412 |
| Hepatitis | 213 (9.3) | 68 (8.0) | 145 (10.1) | 0.984 |
| Diabetes mellitus | 76 (3.3) | 28 (3.3) | 48 (3.4) | 0.909 |
Data are mean ± standard deviation or numbers (%). P-values: men vs. women.
HDL-C = high density lipoprotein-cholesterol, LDL-C = low density lipoprotein-cholesterol.
Anthropometric and biochemical characteristics by gender.
Table 2 shows the factors associated with the occurrence of previous histories of at least one chronic disease. Unadjusted analyses showed that aging and infrequent intake of fruits were significantly positive, while the upper family income, higher education level and low moderate alcohol drinking habits were significantly inversely associated with the histories of chronic diseases in women. These results were attenuated in a multivariate analysis, and only aging remained as a significantly positive factor associated with the histories of chronic diseases in women. On the other hand, aging and an occupation were associated positively, and the education level and physical activity were associated inversely with the histories of chronic diseases in men. In the multivariate analysis, aging, occupation (unskilled), physical inactivity and infrequent intake of fruits were significantly and positively associated, and occupation (managerial) was significantly and inversely associated with the histories of chronic diseases in men.
| Entire population | Men | Women | ||||
|---|---|---|---|---|---|---|
| Unadjusted OR (95% CI) | Multivariate OR (95% CI) | Unadjusted OR (95% CI) | Multivariate OR (95% CI) | Unadjusted OR (95% CI) | Multivariate OR (95% CI) | |
| Age (year) | 1.05 (1.04–1.06)* | 1.05 (1.03–1.06)* | 1.05 (1.03–1.06)* | 1.05 (1.03–1.07)* | 1.05 (1.03–1.07)* | 1.05 (1.03–1.06)* |
| Monthly income | ||||||
| Lower | 1.0 | 1.0 | 1.0 | 1.0 | 1.0 | 1.0 |
| Middle | 0.73 (0.58–0.91)* | 0.76 (0.60–0.96)* | 0.79 (0.55–1.13) | 0.82 (0.55–1.22) | 0.71 (0.53–0.95)* | 0.75 (0.55–1.01) |
| Upper | 0.77 (0.62–0.95)* | 0.79 (0.62–1.01) | 0.87 (0.62–1.21) | 0.85 (0.57–1.27) | 0.72 (0.55–0.95)* | 0.80 (0.58–1.09) |
| Education (year) | ||||||
| Elementary | 1.0 | 1.0 | 1.0 | 1.0 | 1.0 | 1.0 |
| Incomplete secondary | 0.59 (0.41–0.86)* | 0.86 (0.58–1.28) | 0.45 (0.23–0.85) | 0.58 (0.30–1.15) | 0.80 (0.50–1.28) | 1.21 (0.73–2.01) |
| Complete secondary | 0.44 (0.31–0.63)* | 0.73 (0.49–1.08) | 0.35 (0.18–0.67)* | 0.51 (0.26–1.02) | 0.50 (0.33–0.78)* | 0.92 (0.56–1.50) |
| Vocational | 0.66 (0.44–0.98)* | 1.04 (0.68–1.61) | 0.70 (0.32–1.50)* | 1.03 (0.45–2.37) | 0.65 (0.41–1.03) | 1.12 (0.67–1.88) |
| University | 0.57 (0.39–0.82)* | 0.90 (0.59–1.36) | 0.53 (0.28–1.02) | 0.69 (0.34–1.41) | 0.60 (0.38–0.94)* | 1.11 (0.66–1.88) |
| Occupation | ||||||
| Social class I | 1.03 (0.82–1.29) | 1.81 (0.87–1.61) | 1.52 (1.05–2.18)* | 1.27 (0.78–2.09) | 0.81 (0.60–1.08) | 1.04 (0.69–1.56) |
| Social class II | 0.98 (0.76–1.26) | 1.01 (0.73–4.40) | 0.68 (0.44–1.06) | 0.51 (0.28–0.92)* | 1.07 (0.77–1.48) | 1.23 (0.82–1.84) |
| Social class III | 1.14 (0.74–1.76) | 1.36 (0.86–2.14) | 1.15 (0.53–2.49) | 1.55 (0.69–3.50) | 1.06 (0.62–1.79) | 1.24 (0.70–2.17) |
| Social class IV | 0.96 (0.59–1.54) | 1.20 (0.73–1.97) | 1.06 (0.61–1.84) | 1.28 (0.71–2.31) | 1.94 (0.55–6.80) | 2.03 (0.57–7.32) |
| Social class V | 1.01 (0.73–1.42) | 1.18 (0.82–1.69) | 1.60 (0.94–2.73) | 1.80 (1.02–3.15)* | 0.73 (0.47–1.15) | 0.88 (0.55–1.42) |
| Social class VI | 1.0 | 1.0 | 1.0 | 1.0 | 1.0 | 1.0 |
| Smoking habits | ||||||
| Non-smoker | 1.0 | 1.0 | 1.0 | 1.0 | 1.0 | 1.0 |
| Current smoker | 0.81 (0.66–1.00) | 0.82 (0.65–1.02) | 0.92 (0.68–1.25) | 0.98 (0.71–1.37) | 1.03 (0.68–1.57) | 0.97 (0.63–1.50) |
| Ex-smoker | 1.25 (0.82–1.88) | 1.16 (0.75–1.78) | 1.15 (0.72–1.86) | 1.15 (0.69–1.92) | – | – |
| Alcohol drinking habits | ||||||
| Non | 1.0 | 1.0 | 1.0 | 1.0 | 1.0 | 1.0 |
| Low moderate | 0.76 (0.59–0.98)* | 0.86 (0.66–1.12) | 1.12 (0.66–1.89) | 1.15 (0.66–2.00) | 0.68 (0.51–0.90)* | 0.76 (0.56–1.03) |
| High moderate | 0.72 (0.56–0.93)* | 0.86 (0.65–1.13) | 0.72 (0.46–1.12) | 0.82 (0.51–1.31) | 0.79 (0.57–1.10) | 0.94 (0.66–1.33) |
| Heavy | 0.75 (0.59–0.94)* | 0.88 (0.69–1.14) | 0.93 (0.65–1.33) | 1.09 (0.75–1.60) | 0.80 (0.55–1.16) | 0.90 (0.61–1.33) |
| Physical activity | ||||||
| Yes | 0.74 (0.57–0.96)* | 0.71 (0.54–0.93)* | 0.52 (0.34–0.79)* | 0.46 (0.29–0.71)* | 0.92 (0.65–1.29) | 0.95 (0.67–1.35) |
| No | 1.0 | 1.0 | 1.0 | 1.0 | 1.0 | 1.0 |
| Fruit consumption habits | ||||||
| Yes | 1.0 | 1.0 | 1.0 | 1.0 | 1.0 | 1.0 |
| No | 1.06 (0.87–1.29) | 0.92 (0.75–1.14) | 0.88 (0.66–1.18) | 0.70 (0.51–0.96)* | 1.34 (1.02–1.77)* | 1.19 (0.88–1.59) |
OR = odds ratio, CI = confidential interval. Multivariate OR: adjusted for all factors. Age was used as a continuous variable). Physical activity was defined in cases with at least 10 min walk a day.
P values: <0.05.
Odds ratio for the occurrence of chronic diseases as dependent variable and related factors as independent variables.
4. Discussion
The current paper described the outline at baseline of the Moncohort study, the first nationwide large-scale community-based cohort study of chronic diseases conducted in Mongolia. The data would be representative of a national state of rapid modernization and increasing CVD frequency [8,9]. The study includes a general cohort of people living in rural and urban regions of Mongolia. Basically, the response rate to the study was proportionally seen from each region, while it appeared to be high in Ulaanbaatar (55.6%) relative to the other regions. This response should be carefully taken into consideration in the future analysis. As a geographical viewpoint, even though a homogenous development of regions may occur across Mongolia with a nationwide modernization, a different infrastructure of Mongolia (i.e., food transportation and health services) may partly cause some regional differences in considering a previous study showing a regional difference in meat and alcohol consumption within Mongolia (e.g., heavy drinkers more prevalent in Khangai region) [29]. However, an opinion could be justified that the slight difference in the percentage of participants did not undermine or skew the overall study conclusions, partly based on the fact that the vast majority of Mongolia’s population maintains a partially migratory lifestyle, with frequent trips to and from rural/urban areas.
Mongolia has not always had all national trends of demographic data of Mongolian people. Nevertheless, the results of factors measured in our present study seemed to come up to our expectations based on the general perception. For instance, a higher percentage of women were widowed compared to men who were widowers. This may be due to the difference in the life expectancy between men (63.8 years old) and women (72.7 years) in Mongolia. More men had vigorous physical activity at work and in free time than women. In addition, the figures of smoking and drinking habits were likely comparable to those of a previous study conducted in Mongolia in 2009 [11]. Non-smokers and non-drinkers were more prevalent in women than in men. The data of other atherosclerotic risk factors also showed mostly prevailing trends. We saw a greater prevalence of hyperglycemia and dyslipidemias such as hypertriglyceridemia and hypo-HDL-cholesterolemia in men than in women.
With respect to the occurrence of previous histories of chronic diseases (a major concern of the Moncohort study), in the current study, there was a significant association between the disease histories and physical inactivity or unhealthy diet, especially in men. The Mongolian surveys indicated physical inactivity as a possible cause of NCDs [10,11,30]. The Knowledge Attitudes and Practices Questionnaire (KAPs survey)-General Public showed that having no time was the most common reason for not exercising in both genders (28.2% in men and 31.5% in women) [30]. Under the situation, how to increase physical activity especially in men is an issue. Additionally, insufficient fruit intake has been reported to increase the CVD-related mortality [31]. The average daily serving of fruits plus vegetables was 1.8 in the total Mongolian population, which is significantly lower than the WHO recommended 5 servings per day [11]. The KAPs survey on NCDs-General Public (2010) reported that women (42.8%) were significantly more likely than men (31.3%) to eat fruits per day [30]. Our current study also showed a greater preference for fruit intake in women than in men. These gender differences were consistently reported in the studies in the UK and USA [32]. The mechanisms of gender-oriented differences in factors associated with the previous histories of chronic diseases remain to be elucidated, but the difference in lifestyle between genders and/or the different gender-oriented effects of lifestyle on NCDs may partially account for our current study results. Moreover, the association between the socioeconomic factors, such as occupation/social class, and the occurrence of chronic diseases was found in men in this study. In the multivariate analysis, it is interesting to note that unskilled occupation (a positive factor) and managerial occupation (an inverse factor) were extracted for chronic diseases. This result is similar with a previous study reporting that subjects with unskilled work might suffer from the risk of CVD in men (more than in women) [33]. The association between SES and its effects of chronic diseases is controversially reported and should be further studied as future topics [34,35].
Given the finding, we would like to propose a thought that the gender-oriented strategies, for instance in making a national guideline and public health policy for chronic diseases, can be needed for the prevention in Mongolia. The different use of health care systems by gender has been pointed out [36,37]. The strategies should include the method of the use of the systems based on gender.
In seeing the whole, the current study was thought to be representative of the national trends of the demographic, lifestyle, and anthropometric and biochemical characteristics of Mongolian people. Therefore, the Moncohort study will provide important new information about the risk factors and prevention of chronic diseases in Mongolian adults. The geographical diversity of the cohort is the strength of the study which may provide significant insights into interactions among geographical diversity, risk factors and chronic diseases. The study results would be applicable to public health action and promote new approaches to prevent the progression of chronic diseases in Mongolia. Moreover, in a grovel view, the current study results will offer the data to easily compare with other countries, as worldwide, countries in modernization are suffering from NCDs, similar to Mongolia.
We must recognize study limitations. First, while the study was large, it was not the complete exhaustive survey of all residents. Second, the results based on the cross-sectional study design do not allow discussion as to the causality of the results. Third, the self-report of previous history of chronic diseases might result in diagnostic or recall bias. For instance, for the exact diagnosis of diabetes mellitus, glycated hemoglobin and 2-hour glucose levels by glucose tolerance test are applicable.
5. Conclusions
For the first time, a nationwide large-scale community-based cohort study of chronic diseases was launched in Mongolia. Factors associated with chronic diseases reveal gender-oriented strategies might be needed for their prevention. Detailed prospective analyses will illustrate the impact of risk factors on chronic diseases and lead to evidence for designing programs aimed at reducing chronic diseases and related disorders in Mongolia.
Conflict of interests
The authors declare that there is no conflict of interests regarding the publication of this paper.
References
Cite this article
TY  - JOUR
AU  - Tsogzolbaatar Enkh-Oyun
AU  - Dambadarjaa Davaalkham
AU  - Kazuhiko Kotani
AU  - Yasuko Aoyama
AU  - Satoshi Tsuboi
AU  - Ryusuke Ae
AU  - Gombojav Davaa
AU  - Dayan Angarmurun
AU  - Nanjid Khuderchuluun
AU  - Yosikazu Nakamura
PY  - 2016
DA  - 2016/01/29
TI  - A cohort study of chronic diseases for Mongolian people: Outline with baseline data of the Moncohort study
JO  - Journal of Epidemiology and Global Health
SP  - 187
EP  - 196
VL  - 6
IS  - 3
SN  - 2210-6014
UR  - https://doi.org/10.1016/j.jegh.2015.12.001
DO  - 10.1016/j.jegh.2015.12.001
ID  - Enkh-Oyun2016
ER  -