
Verification of measles elimination in Australia: Application of World Health Organization regional guidelines
- DOI
- 10.1016/j.jegh.2015.12.004How to use a DOI?
- Keywords
- Disease elimination; Measles; Surveillance
- Abstract
Background: The World Health Organization (WHO) Western Pacific Region (WPR) Guidelines on verification of measles elimination were established in 2012. This article outlines Australia’s approach to addressing the guideline’s five lines of evidence, which led to formal verification of elimination by the WHO Regional Verification Commission (RVC) in March 2014.
Methods: The criteria were addressed using national measles notifications, data from selected laboratories, the national childhood immunization register, and three national serosurveys (1998/1999, 2002, 2007).
Results: Australia met or exceeded all indicator targets with either national or sentinel data. Laboratory and epidemiological surveillance were of high quality, with 85% of cases documented as imported/import-related (target 80%); coverage with the first dose of measles vaccine was close to 94% in 2008–2012 and second dose coverage increased to 91% in 2012 (target >95%). There is ongoing commitment by the Australian Government to increase immunization coverage, and the absence of sustained transmission of any single measles genotype was demonstrated.
Conclusions: This is the first documentation of the successful application of the WPR RVC guidelines. The indicators afford some flexibility but appear to provide appropriate rigor to judge achievement of measles elimination. Our experience could assist other countries seeking to verify their elimination status.
- Copyright
- © 2016 Ministry of Health, Saudi Arabia. Published by Elsevier Ltd.
- Open Access
- This is an open access article under the CC BY-NC-ND license (http://creativecommons.org/licenses/by-nc-nd/4.0/)
1. Introduction
Globally, efforts to control measles have been very effective, with a 74% reduction in measles-related mortality between 2000 and 2010 [1]. Sustained high coverage with a two-dose vaccination schedule resulted in elimination of endemic measles from the Americas between 2002 and 2013 (since then endemic transmission has been reestablished in Brazil), and in individual countries from other regions [2]. These successes led the World Health Organization (WHO) to conclude that measles eradication (interruption of measles transmission globally) is feasible and cost effective [3] and all six WHO regions have set elimination targets [2].
In 2010, the Western Pacific Region (WPR) reaffirmed its goal of measles elimination by 2012. A Regional Verification Commission (RVC) for the Elimination of Measles was established in January 2012, which developed guidelines on verification of measles elimination in the WPR [4], based on the WHO framework for verifying measles elimination [5]. The WPR guidelines include three verification criteria for measles elimination: (1) documented interruption of endemic measles virus transmission for a period of at least 36 months from the last known endemic case; (2) the presence of high quality (“verification standard”) surveillance; and (3) genotyping evidence that supports interrupted transmission. These criteria are assessed using indicators across five lines of evidence including a description of measles epidemiology, quality of epidemiological and laboratory surveillance, population immunity, vaccination program sustainability, and genotyping data. The individual lines of evidence are evaluated together to establish the case for measles elimination, but the RVC has the discretion to accept alternative evidence from countries unable to provide complete data for all indicators.
An Australian National Verification Committee (NVC) for the Elimination of Measles was convened in February 2013 to oversee the compilation of data against the five lines of evidence for the period up until the end of 2012, and the NVC’s report, along with reports from 13 other counties, was considered by the RVC during its third meeting in October 2013 [6]. Based on the evidence provided, the RVC verified that measles elimination had been achieved by Australia, Macao Special Administrative Region of China, Mongolia, and the Republic of Korea [6]. Even though Heywood et al. [7] had argued that Australia achieved measles elimination by 2005, and probably several years earlier, this was prior to the development of regional guidelines and a formal verification process was not yet in place. Furthermore, national data to fulfill several criteria were unavailable at that time. This article summarizes Australia’s approach to addressing the WPR’s five lines of evidence and is the first to document the interruption of endemic measles virus transmission according to the WPR guidelines. Australia’s experience could assist other countries seeking to verify their measles elimination status.
2. Background: measles control in Australia
A number of measles control initiatives had been implemented in Australia prior to the end of the reporting period in 2012, including a two-dose vaccination schedule since 1993, a mass vaccination campaign for school-aged children in 1998, and a free vaccination program for young adults (2001) (Table 1) [8–10].
| Year | Intervention |
|---|---|
| 1968 | Measles vaccine registered |
| 1969 | Measles vaccination recommended for children aged 12–23 months |
| 1970 | Introduction of funded dose of measles vaccine for children aged 12–23 months |
| 1975 | First national vaccination schedule included measles vaccination for infants at 12 months of age |
| 1982 | Combined measles-mumps vaccine recommended and funded, replacing measles vaccine |
| 1989 | Combined measles-mumps-rubella (MMR) vaccine recommended and funded, replacing measles-mumps vaccine |
| 1993–1994 | Introduction of a publicly funded 2nd dose of MMR vaccine at age 10–14 years for males and females (school-based program), replacing female only rubella vaccination |
| 1998 | Funding of a national Measles Control Campaign (MCC) [9]
|
| 2001 | Young adult MCC [10] Free MMR vaccine offered to all adults aged between 18 and 30 years during 2001 via general medical practitioners |
Significant events in measles control in Australia to 2012 [8].
3. Lines of evidence and indicators
3.1. A detailed description of the epidemiology of measles
3.1.1. Data sources
Each country is required to describe the epidemiology of measles, ideally beginning prior to the introduction of measles vaccination, but with a focus on the most recent 5 years [4]. Measles is notifiable in Australia, and data from the National Notifiable Diseases Surveillance System (NNDSS), which was established in 1991, was used to describe the epidemiology of measles in Australia. Clinicians and laboratories are legally required to report individuals with clinical symptoms or signs suggestive of measles (suspected cases) and confirmed measles cases to health authorities in each of the six states and two territories (jurisdictions). All reported cases are actively investigated to confirm the diagnosis, determine travel and other exposure risks, and identify contacts and additional cases. From 2004, only laboratory confirmed cases or clinical cases epidemiologically linked to a laboratory confirmed case were reported to the NNDSS, following adoption of a standardized national case definition [4,11].
Trends in measles notifications from 1991 were analyzed. Method of diagnosis and vaccination data were described for the most recent 5 years (2008–2012), whilst information on chains of transmission and source of infection were only complete enough for meaningful analysis for 2009–2012. Categorizing the source of infection for notified cases is a vital measure of a country’s measles elimination status. Imported cases are those exposed to measles outside the country during the 7–21 days prior to rash onset; import-related measles cases are locally acquired infections occurring as part of a chain of transmission originating from an imported case [4]. Ideally, the majority of cases (⩾80%) should be able to be classified into these two categories, as if there is a high proportion of cases with an unknown source of infection, it raises doubts about surveillance quality.
3.1.2. Measles notifications
Prior to the establishment of the NNDSS in 1991, available notification data indicated a wide variation in annual notification rates, with a peak of 15,000 notifications in 1925 (a rate of 2742 cases per 100,000 population) [12]. The largest recorded outbreak since the introduction of measles vaccination was between 1993 and 1994, when there were more than 9000 notified cases (mean annual notification rate of 27 per 100,000 population; Fig. 1). While the 1993–1994 outbreak coincided with the roll-out of the second dose of a measles containing vaccine, coverage of one dose of measles-mumps-rubella (MMR) vaccine was estimated by survey in 1989 to be 86% for children 1–6 years of age [13], a level inadequate to prevent sustained transmission. Notification rates have been generally low since the Measles Control Campaign in 1998, with rates < 1 per 100,000 population in all years between 2000 and 2012. A clear seasonal peak in Spring was evident up until 1994, after which time a seasonal effect is less apparent, consistent with diminished measles transmission (Fig. 1).
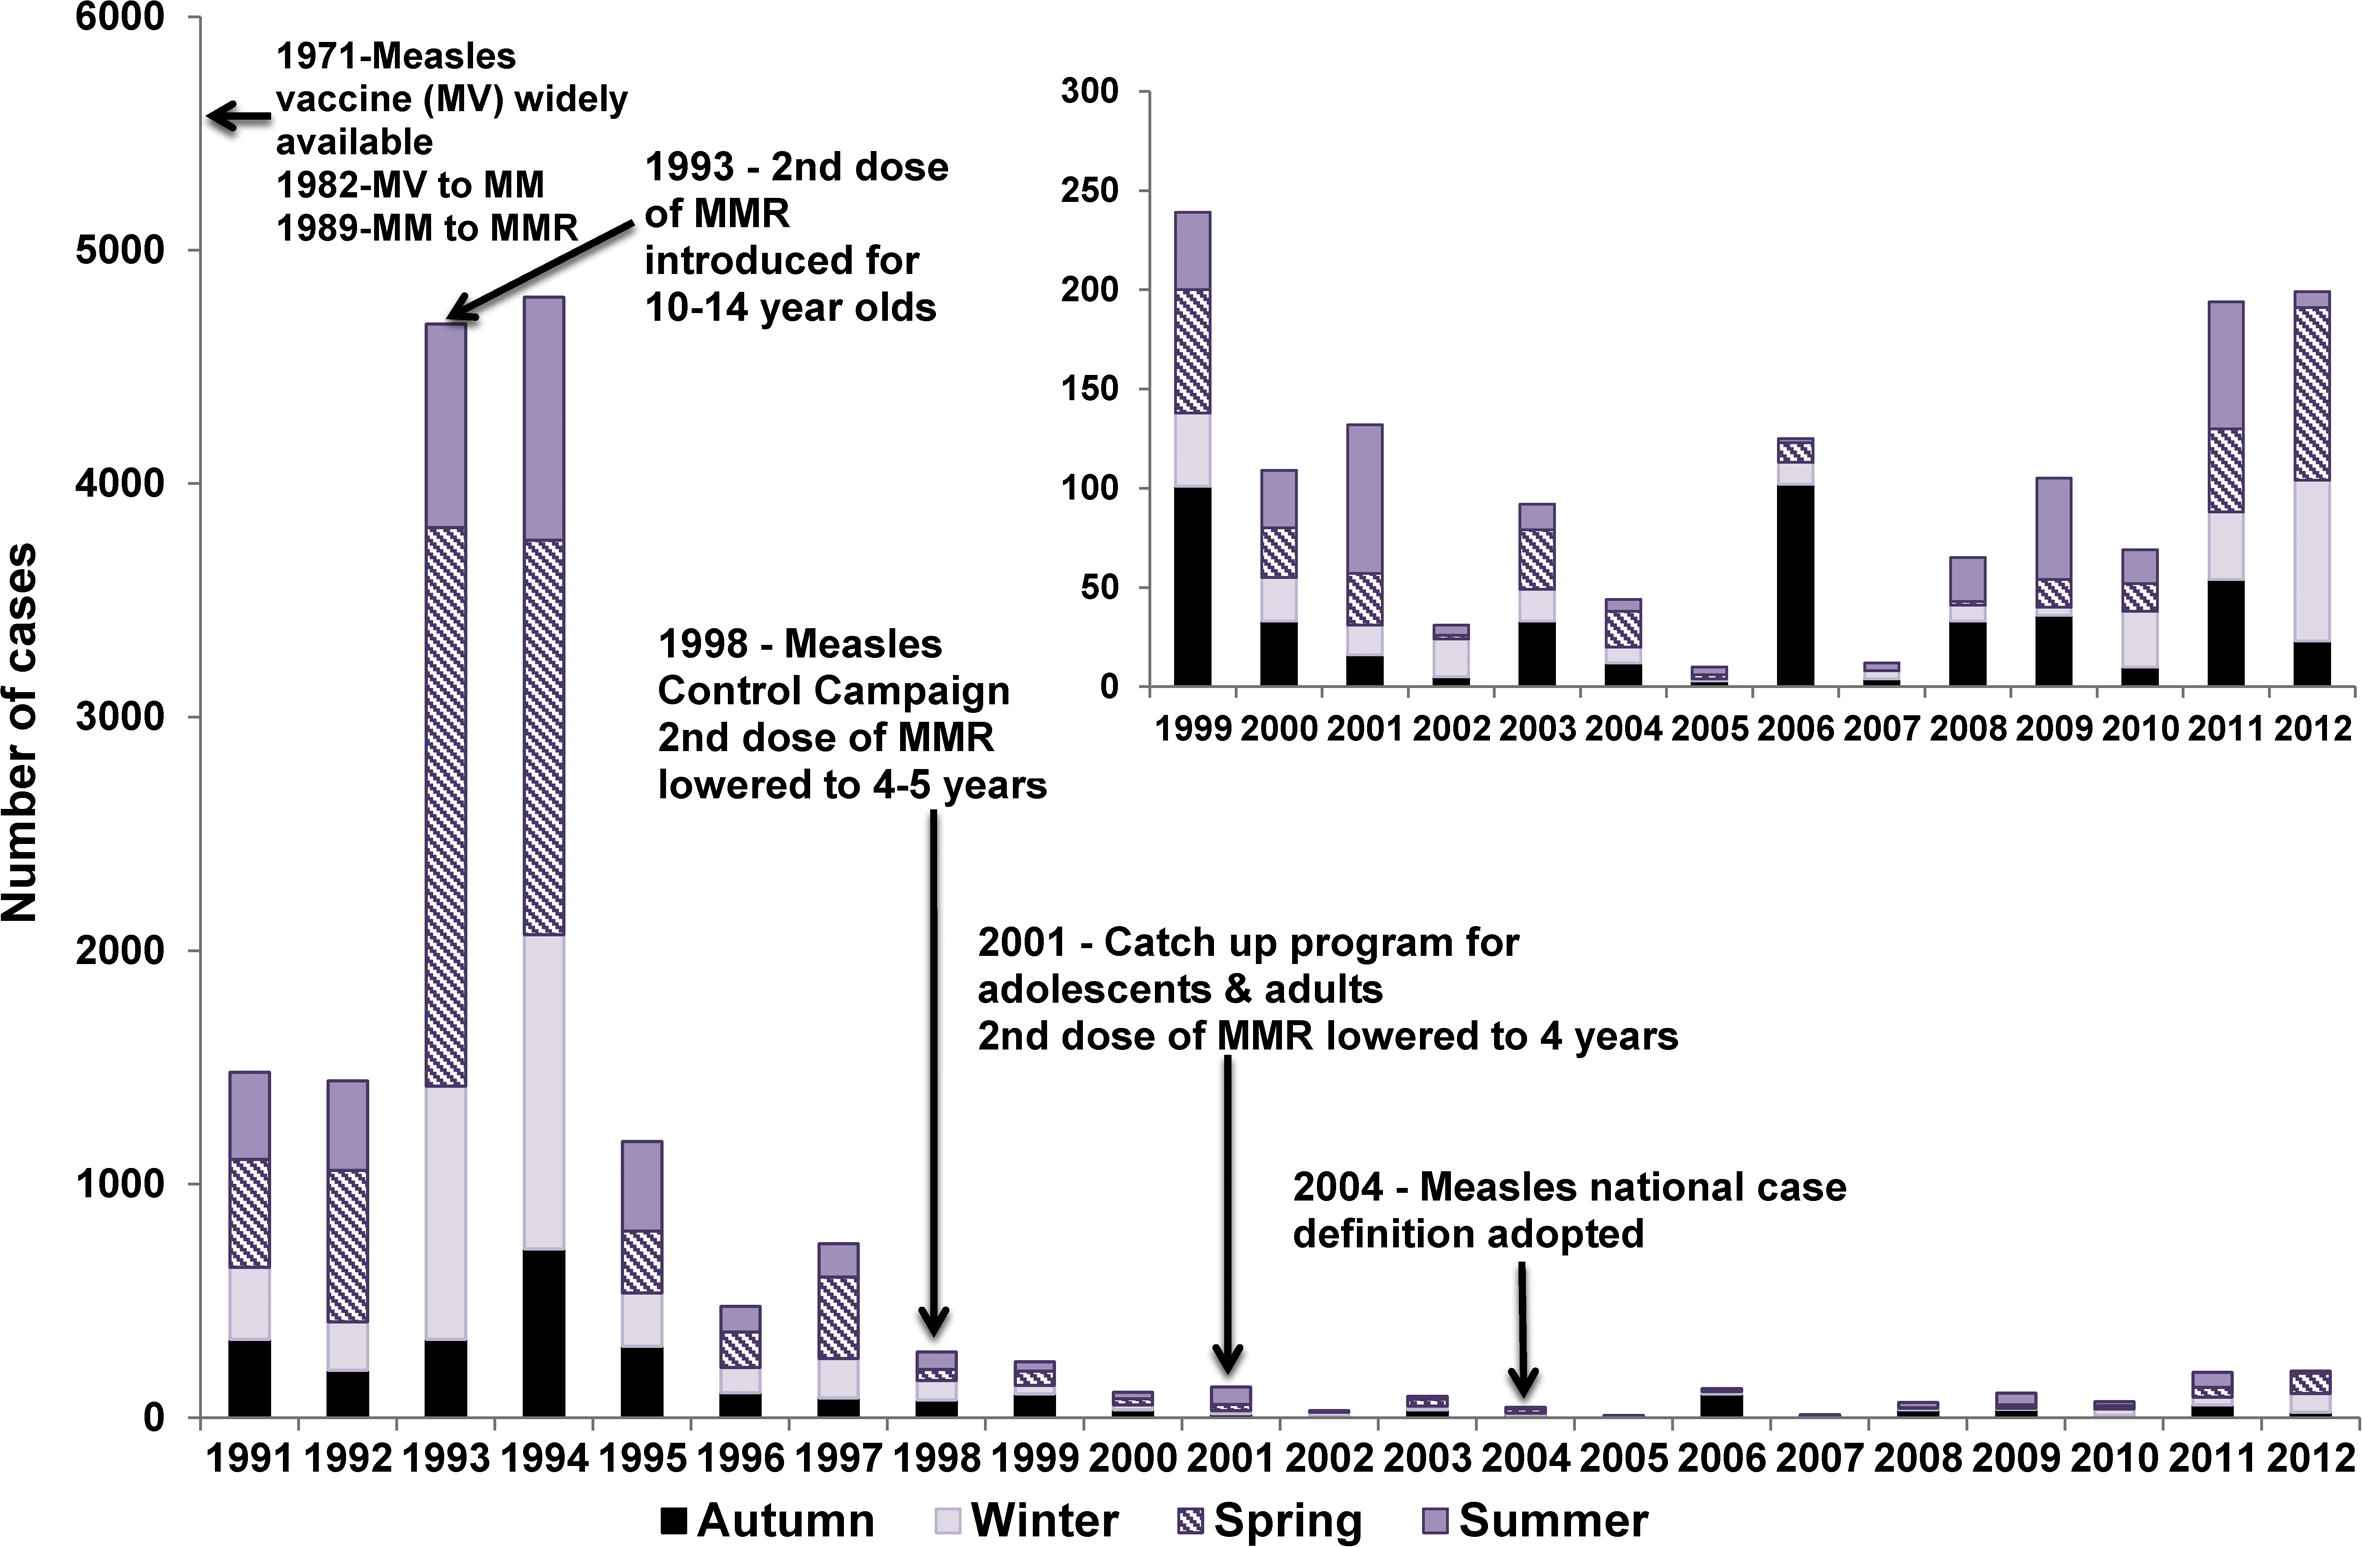
Measles control strategies and notifications by season, Australia, 1991–2012.
3.1.3. Age distribution
Since 1991, infants < 1 year of age have generally had the highest annual age-specific notification rates. The exceptions were 2005 and 2010, when notification rates were low across all age groups (Fig. 2). Since 2000, annual notification rates in age groups other than <1 year have fluctuated, but remained at or below 2.2 per 100,000 with a trend from 2004 onwards of proportionally fewer cases among 20–29-year-olds and more among 10–19-year-olds.
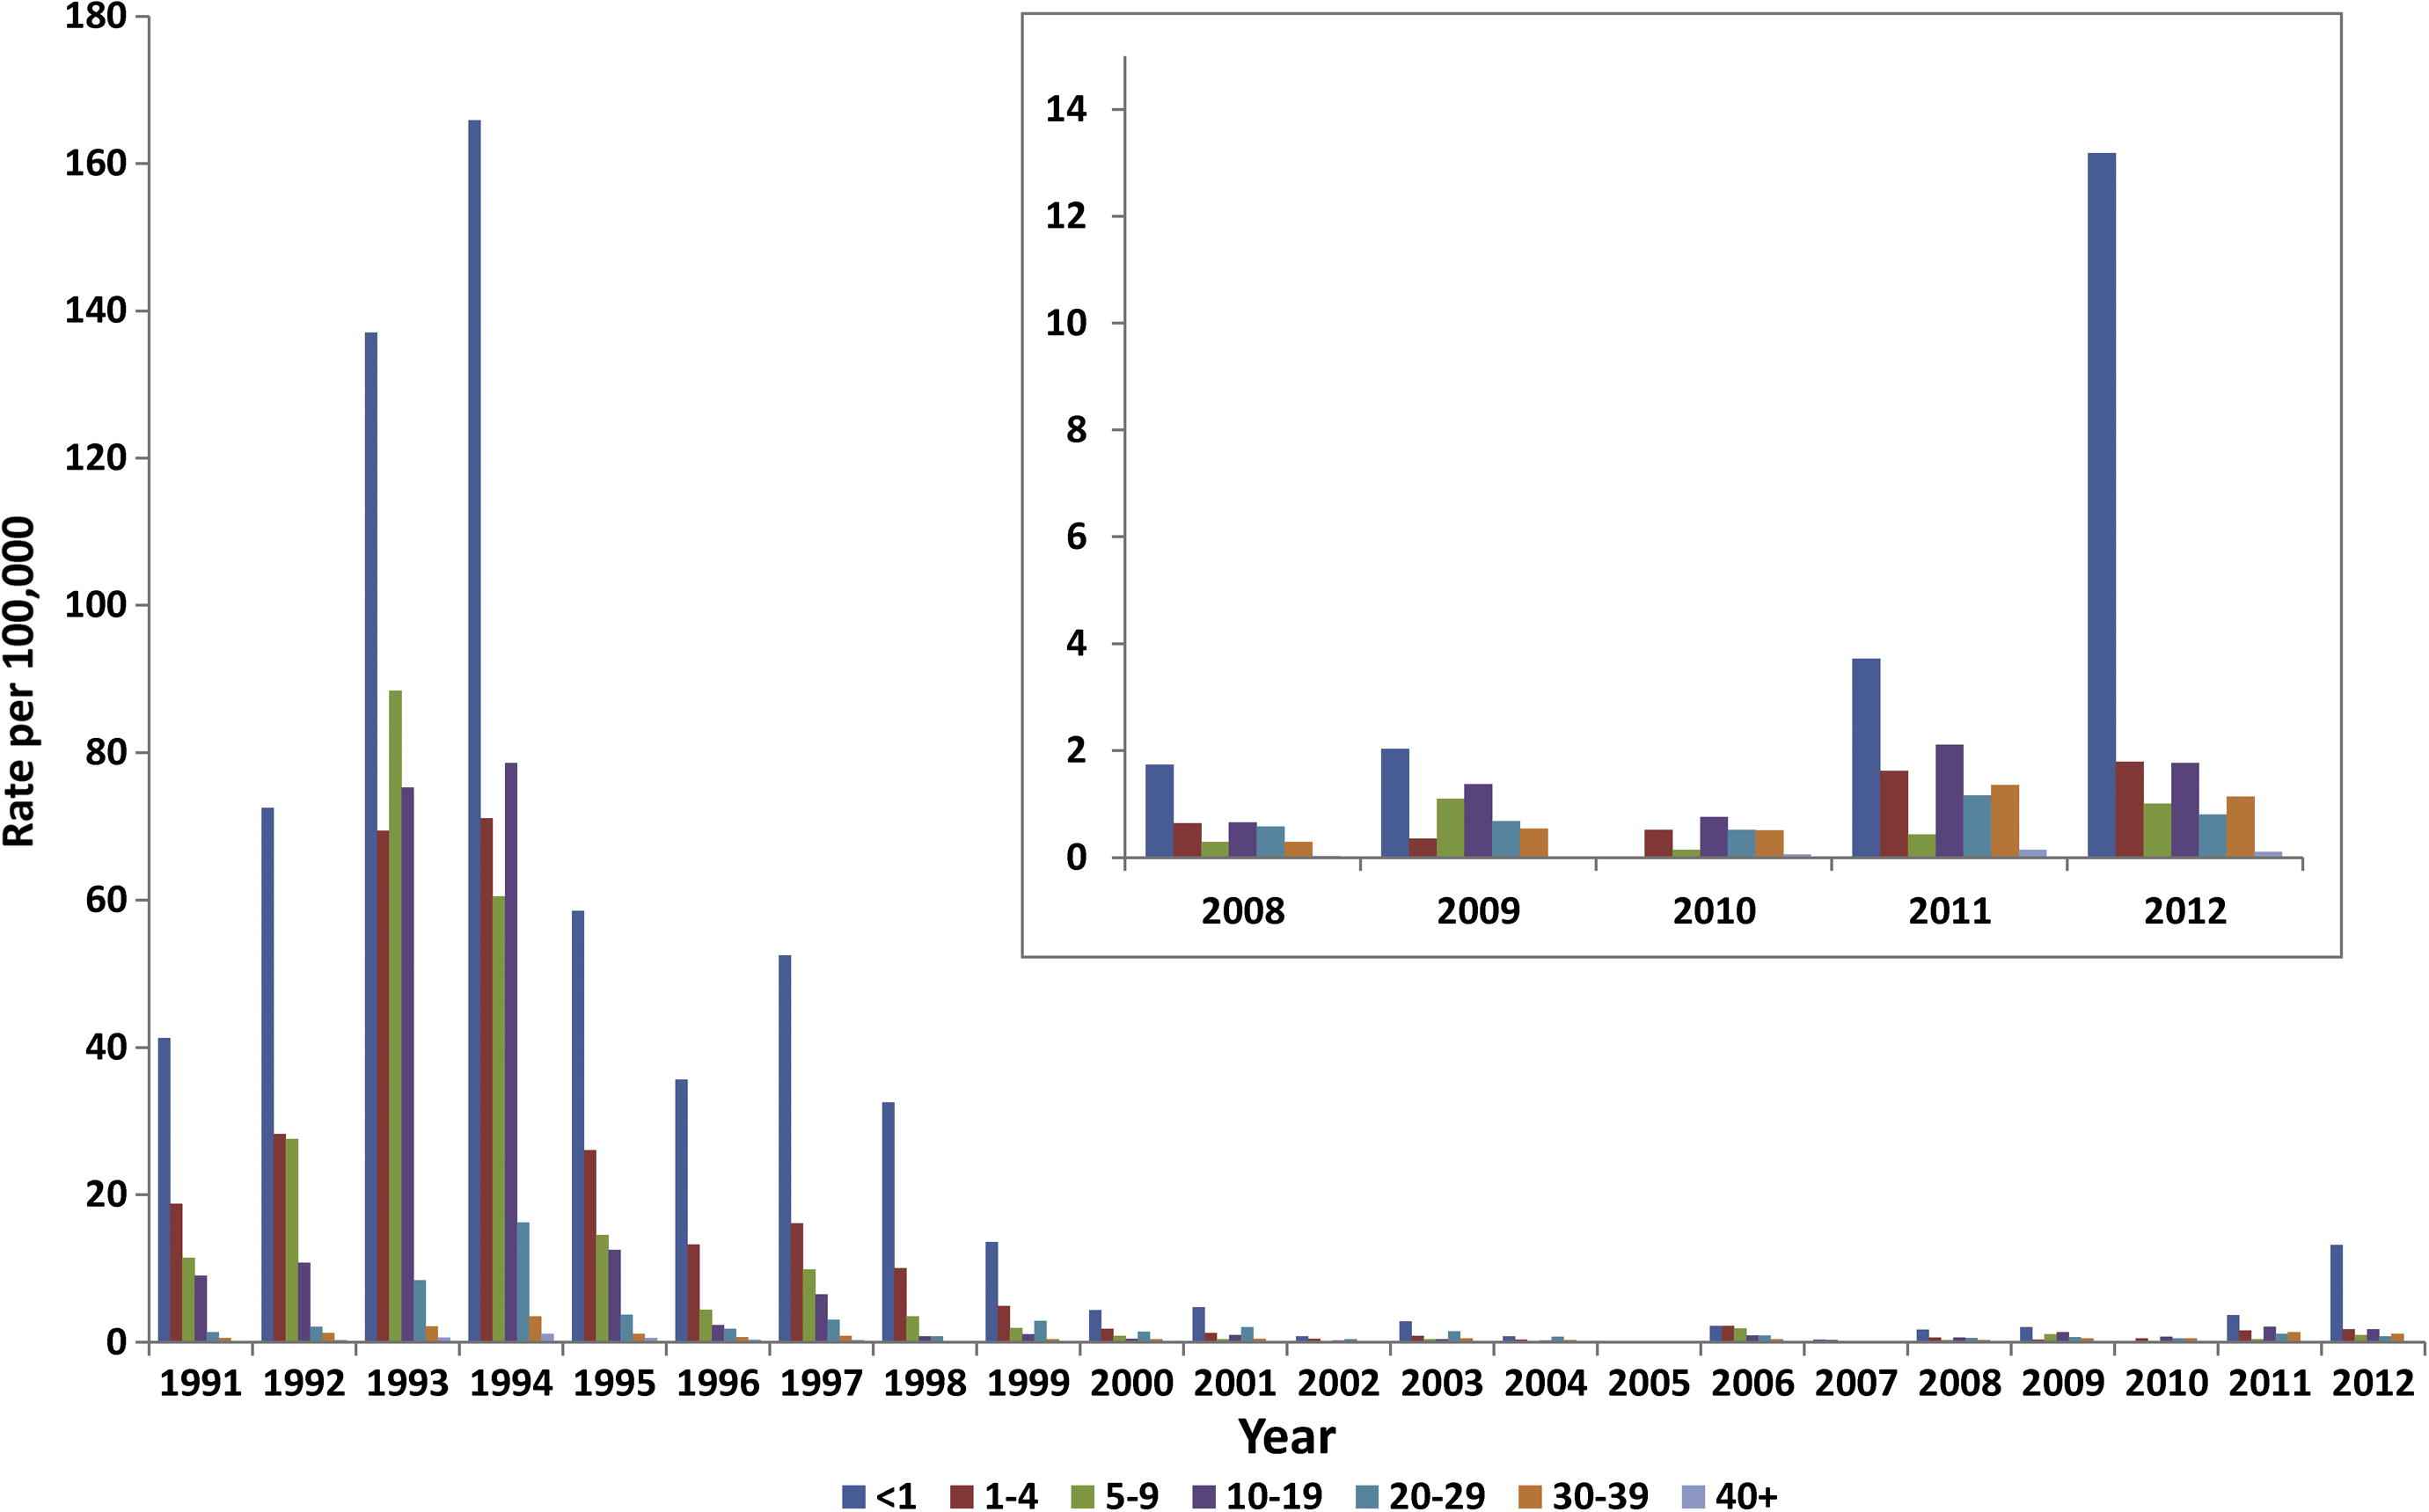
Measles notification rate by age group, Australia, 1991–2012.
3.1.4. Vaccination status of cases
The majority of cases between 2008 and 2012 were either unvaccinated (56%), partially vaccinated (16%), or had an unknown vaccination status (25%). Only 3% of all cases (n = 20) were reported to be fully vaccinated (at least 2 doses of a measles containing vaccine), 60% (n = 12) of whom were aged 5–14 years.
3.1.5. Case confirmation
During 2008–2012, 88% (555/632) of cases were laboratory confirmed (annual range 85–92%) and the remaining 12% met clinical criteria and were epidemiologically linked to a confirmed case.
3.1.6. Source of infection
The WHO indicator of 80% or more cases having a known source of infection was achieved in the period 2009–2012, with 85% of cases either imported or import-related (480/567). The proportion of cases with a known source of infection exceeded 95% in all years except for 2011 (59%; Fig. 3). All 87 cases with an unknown source of infection were fully investigated. The five cases in 2009 and one in 2012 were geographically and temporally distinct and therefore classified as sporadic cases. While the two cases in February 2010 were epidemiologically linked, there were no other unknown source cases in 2010 that would indicate an unidentified endemic chain of transmission. Most (79/87; 91%) of the cases with an unknown source were reported in 2011. Of these, 87% (69/79) were in New South Wales (NSW), of which 54 (78%) were from two neighboring regions (Sydney and Illawarra). All 12 epidemiologically linked clusters of unknown source cases in NSW in 2011 were temporally and geographically associated with one of 12 imported cases. However, genotyping results were only available for four of the imported cases and six of the clusters with an unknown source case. Therefore, a definitive link based on virological evidence was not possible, although genotyping results of the six clusters is consistent with repeated importations rather than prolonged transmission of a single virus. Furthermore, there were no reported cases in these local government areas or wider geographic locations in 2012. The remaining 10 cases (including 5 sporadic cases and 2 clusters) occurred in five different jurisdictions, which also suggests transmission associated with several unidentified imported cases.
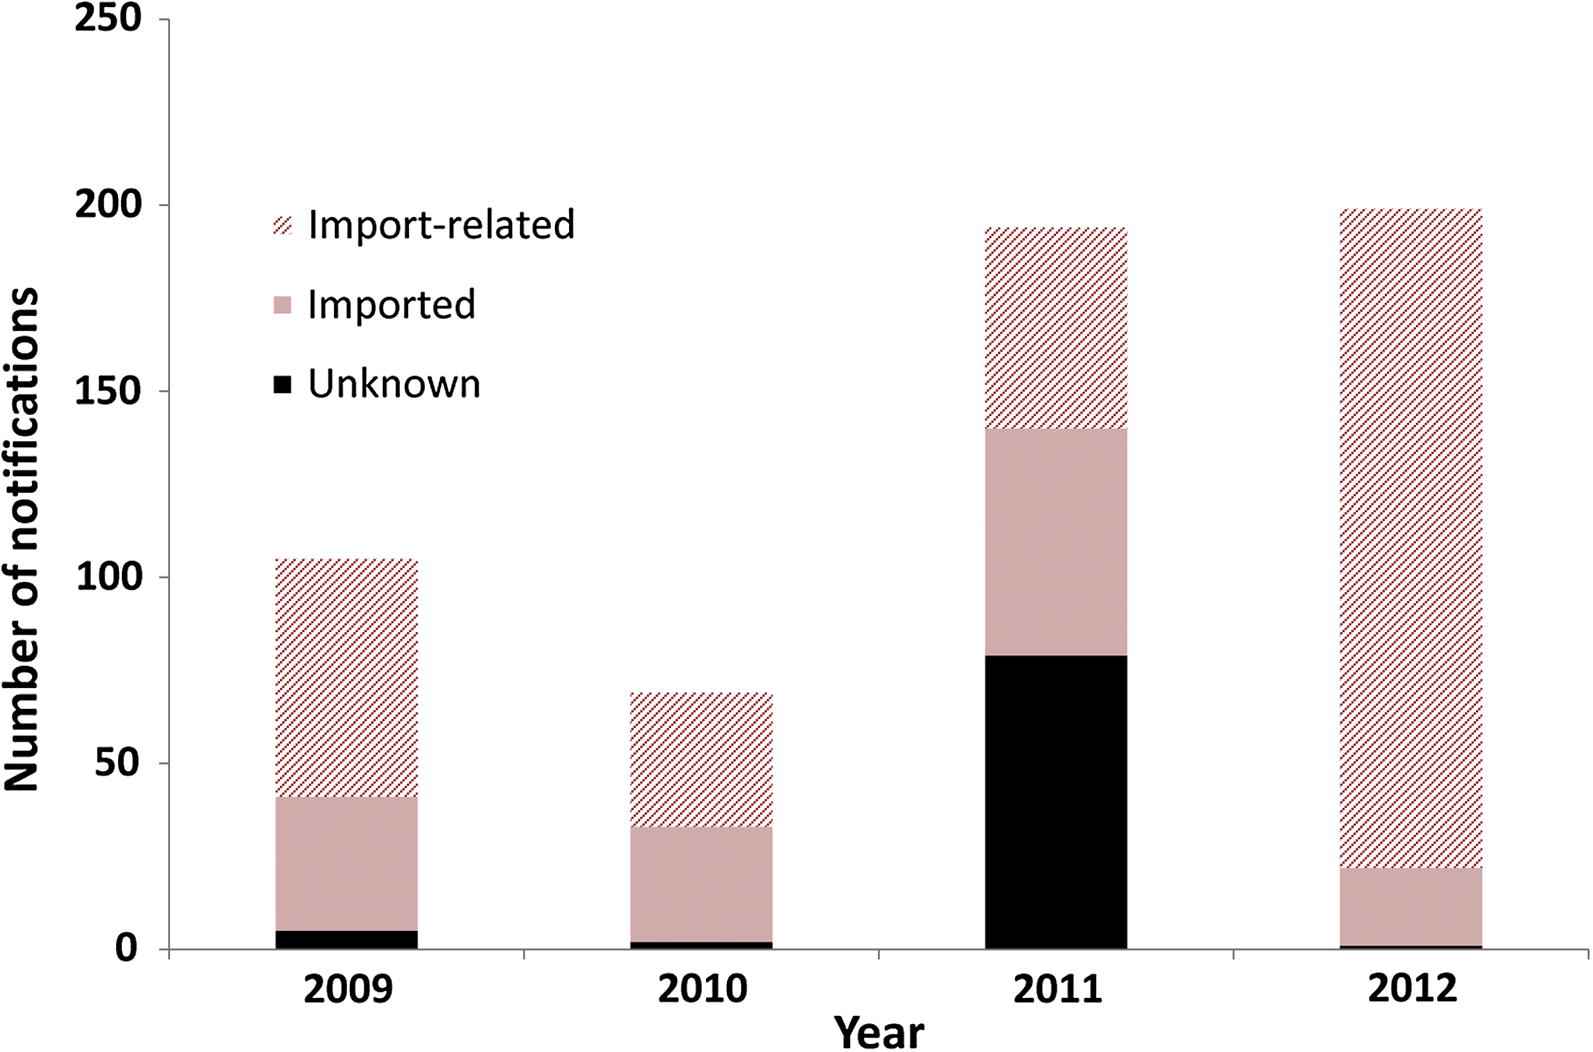
Measles notifications by source of infection, Australia 2009–2012.
3.1.7. Outbreaks
Between 2009 and 2012, there were 58 chains of measles transmission identified with two or more epidemiologically linked cases (range 6–33 chains per year), accounting for 80% of all cases in Australia during this time (Table 2). Most transmission chains were small [annual median number of cases in each chain was between 2 and 3 cases (range 2–173)] and 60% lasted ⩽3 weeks (range 5–236 days).
| Year | Number of cases | Number of chains (% all cases) | Number (%) chains genotyped | Median number (range) of chain cases | Median chain duration (range) in days | Genotypes |
|---|---|---|---|---|---|---|
| 2009 | 105 | 10 (71) | 8 (80) | 3 (2–25) | 14 (9–67) | D8, D4, D9, H1 |
| 2010 | 69 | 9 (72) | 9 (100) | 3 (2–14) | 22 (10–63) | D8, D9, B3, G3, H1 |
| 2011 | 194 | 33 (75) | 24 (73) | 3 (2–24) | 14 (5–43) | D4, D8, D9 |
| 2012 | 199 | 6 (92) | 6 (100) | 2 (2–173) | 17 (12–236) | D8, D9, B3, G3 |
| Total | 567 | 58 (80) | 47 (81) | 3 (2–173) | 15 (5–236) |
Summary of measles chains of transmission, Australia 2009–2012.
Seven chains of transmission involved >10 cases, all had genotyping information indicating an imported measles virus, and all except one chain (in 2011, 23 cases in Western Sydney, NSW, see above) were epidemiologically linked to an imported case. In 2012, the largest outbreak of measles in Australia since 1997 (n = 173 cases) occurred predominately in Western and South Western Sydney. Genotyping data suggested one incursion of measles virus D8 from Thailand with 24 generations of spread lasting 33 weeks. The last case had onset of symptoms in Week 49, after which there were no additional cases reported in NSW until an imported case occurred in Week 8 of 2013 [14].
3.2. Quality of epidemiological and laboratory surveillance systems for measles
One of three criteria essential for verification of measles elimination is a high-quality surveillance system that is sensitive and specific enough to detect imported and import-associated cases in order to confirm the absence of endemic measles transmission. Based on the WHO verification framework [5], there are 12 indicators to monitor the quality of field and laboratory surveillance [4] (Table 3). Each criterion should be assessed annually at the national and subnational level (state or territory level in Australia), and where data are unavailable alternate evidence can be submitted.
| WHO Indicator | Target | Were data available to address the WHO indicator criterion? | Target achieved annuallya |
|---|---|---|---|
| 1. Timely national reporting by surveillance units | ⩾80% | Yes, but only laboratory confirmed cases or clinical cases epidemiologically linked to a laboratory confirmed case are notifiable | Yes, daily automated electronic reporting by all states and territories |
| 2/3. Reporting rate for non-cases at national and subnational level | ⩾2 per 100,000 | No, negative test results for acute infection from selected labs divided by state populationsb,c | Yes, National: 2009–2011b: 5.8–13.0/100,000, 2012c: 17.3/100,000 State: Ranged from 2.9 to 21.4/100,000 per year |
| 4. Adequate case investigation | ⩾80% | Yes, but completeness of core data fields only available for notifiable cases (see WHO Indicator 1) | Yes, except “Date of investigation” is not recorded and “Date of last vaccination” is incomplete |
| 5. Adequate specimen collection within 28 days of rash onset | ⩾80% | Yes, but determined from% serum specimens tested at national reference lab only | Yes, but data only for cases with known onset dates (62% of suspect cases) |
| 6. Specimen receipt within 5 days of collection | ⩾80% | Yes, but determined from% serum specimens tested at national reference lab only | Yes, range: 98% (2011) to 99% (2012) |
| 7. % Of transmission chains with specimens for genotyping in accredited lab | ⩾80% | Yes,% genotyped at WHO accredited national reference lab | Yes, except 2011 (73%) see Table 2 |
| 8.% Network labs accredited | 100% | Yes, the national reference lab is WHO accredited | Yes |
| 9. Serology results reported within 4 days of specimen receipt | ⩾80% | Yes, but determined from% serum specimens at national reference lab only | Yes, range: 89% (2009) to 93% (2012) |
| 10. Adequate quality assurance (QA) in diagnostic labs | 100% | No, unknown number of diagnostic labs, but lab accreditation requires participation in biannual QA | No |
| 11. % Virus detection and genotyping results reported within 2 months of specimen receipt | ⩾80% | Yes, but determined from% at national reference lab only | Yes, virus detection reported within 20 days of specimen receipt; range 91% (2012) to 97% (2009) Genotype data reported within 2 months of specimen receipt: 100% (2009–2011), 89% (2012) |
| 12. Completeness and timeliness of reporting to WHO | ⩾80% | Yes, but determined from% of tests at national reference lab only (including all genotyping results) | Yes, reported monthly Completeness: 100% (2009–2012) Timeliness: 100% (2010–2012), 83% (2009) |
Using the Australian criteria.
Data collected from six labs in four Australian states comprising 88% of Australia’s population.
Data collected from five labs in three Australian states comprising 77% of Australia’s population.
Application of World Health Organization (WHO) quality indicators to Australia’s measles surveillance system.
We were able to address all criteria, except a laboratory quality assurance indicator (Indicator 10), using data from NNDSS and selected laboratories for the period 2009–2012 (Table 3). Data for notifiable cases were reported to NNDSS each day (Indicator 1) and core data fields in NNDSS were ⩾87% complete each year (Indicator 4) with two exceptions (see Table 3). However, information on cases subsequently classified as non-measles (discarded), were not collated at the national level. Therefore, to address the other criteria we relied on data from selected laboratories (one state public health reference laboratory, and three tertiary hospital-based laboratories), and from the Victorian Infectious Diseases Reference Laboratory (VIDRL), which is Australia’s national measles reference laboratory. To determine the rate of non-measles cases (Indicator 2 and Indicator 3), algorithms were developed for each laboratory (depending on testing practices) in order to capture only tests for recent infection, and repeat tests on an individual within 28 days were excluded. Even though the available laboratory data would not capture all cases confirmed as non-measles, the calculated annual discard rates were well above the target (Table 3).
3.3. Population immunity presented as a birth cohort analysis with the addition of evidence related to any subgroups
3.3.1. Administrative reports of vaccination coverage
Sustained high levels of immunity across the population achieved through a two dose MMR vaccination program is a prerequisite for measles elimination. The WPR targets for immunity are ⩾95% coverage with both MMR1 and MMR2 nationally and in each district [in Australia’s case Statistical Areas Level 3 (SA3) were used [15] with approximately 30,000–130,000 persons per SA3].
MMR coverage was measured using the Australian Childhood Immunisation Register (ACIR). The ACIR was established in 1996 and is considered a near complete (99%) population register which records all vaccinations for children <7 years of age [16]. Cohort immunization status was assessed at 24 months of age (for MMR1 due at 12 months), and 60 months of age (for MMR2 due at 48 months), with a minimum 3 month lag period to allow for delayed notification. While the targets were not met, MMR1 coverage nationally has been close to 94% for the past 10 years and MMR2 coverage has been steadily increasing from 82% in 2002 to 91% in 2012 [17]. Historically, there have been differences in coverage between indigenous and nonindigenous children [17,18], but in 2012, the coverage disparity was minimal: MMR1 (94.3% coverage in indigenous vs. 93.9% in nonindigenous children) and MMR2 (91.7% coverage in indigenous vs. 91.8% in nonindigenous children). However, there was some heterogeneity at the SA3 level, with lower coverage particularly in northern NSW and inner city regions in some jurisdictions (Fig. 4A and B).
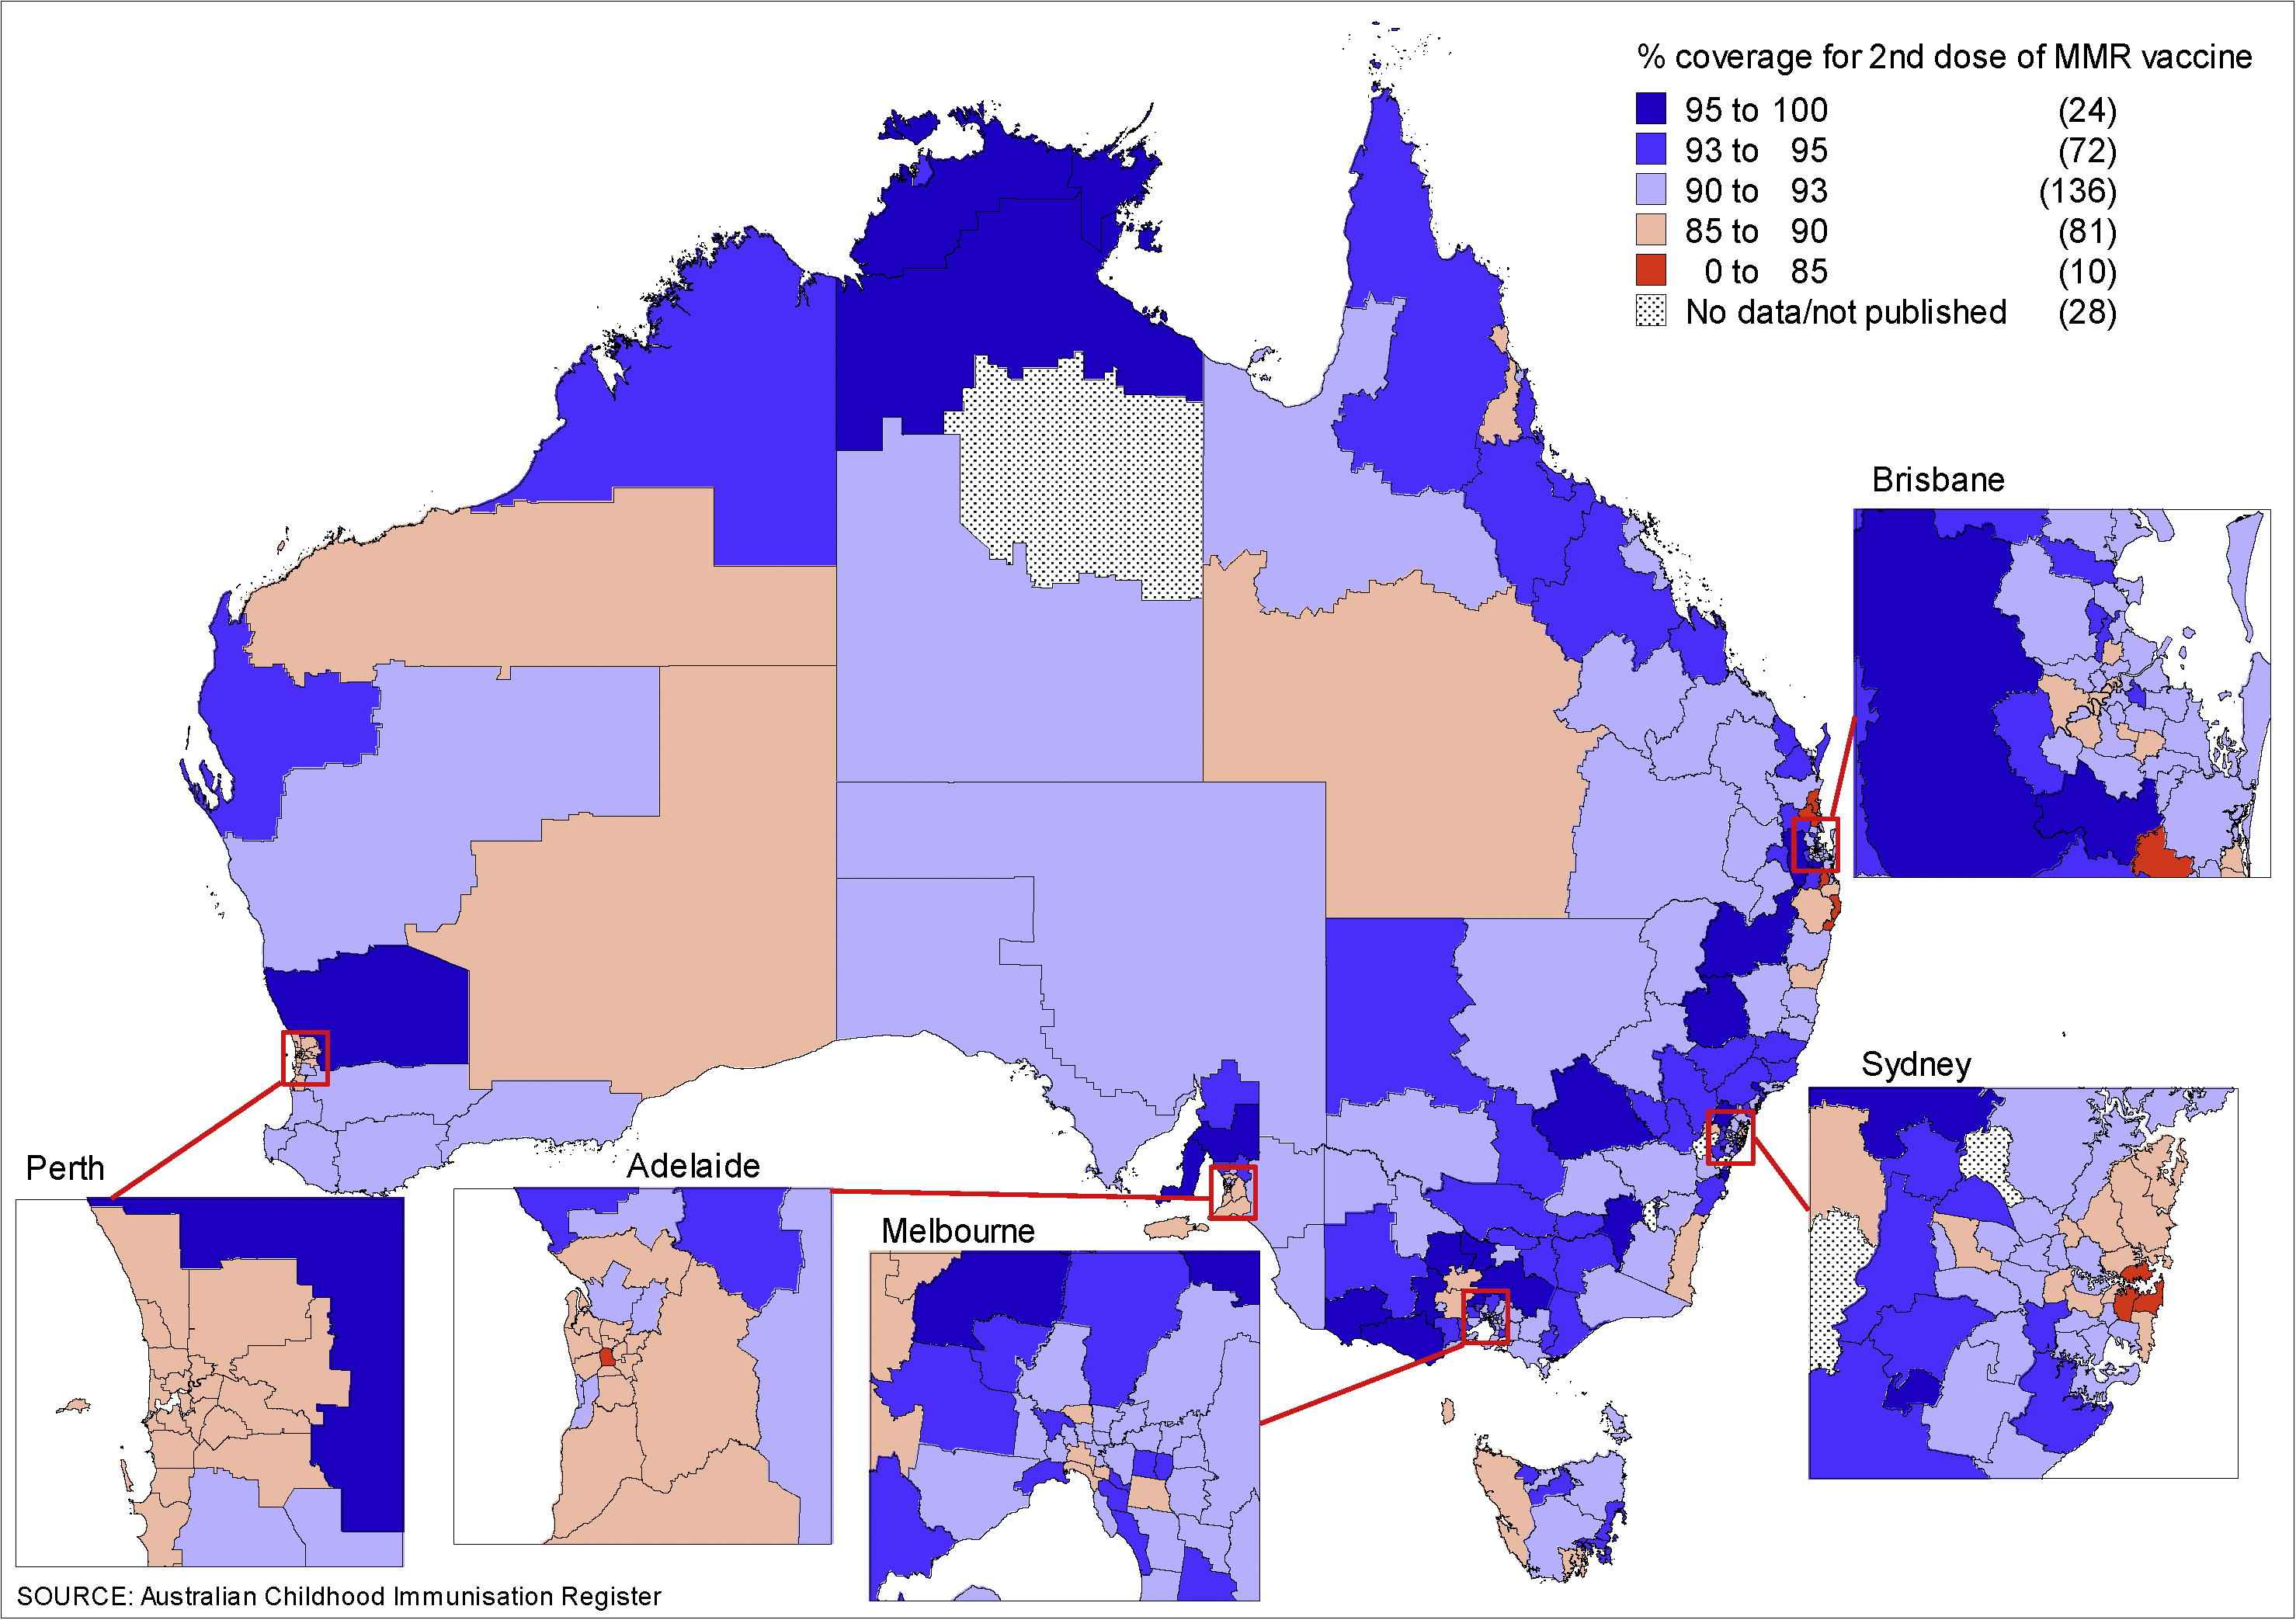

(A) Percentage of children aged 2 years immunized with the first dose of measles-mumps-rubella (MMR1) vaccine, by Statistical Areas Level 3 (SA3), Australia, 2012a. (B) Percentage of children aged 5 years immunized with the second dose of measles-mumps-rubella (MMR2) vaccine, by SA3, Australia, 2012b. aBirth cohort born January 2010 to December 2010. bBirth cohort born January 2007 to December 2007.
3.3.2. Seroepidemiologic data
Australia’s established serosurvey program [19] complements childhood vaccination coverage surveillance by providing estimates of cumulative immunity from both natural infection and vaccination and immunity for older age groups. The opportunistic collection method has been shown, in one study, to be representative of the population by age, sex and geographic region [20]. While the proportion of positive sera declined across the three serosurveys in 1996–9, 2002, and 2007 (Table 4), this has been largely offset by higher proportions with equivocal results, particularly in those aged 5–29 years, such that the proportion of 1–49 year olds seronegative in 2007 remained low at 8.0% (6.7–9.4%) and below 11% for each age group except 1-year-olds (Fig. 5).
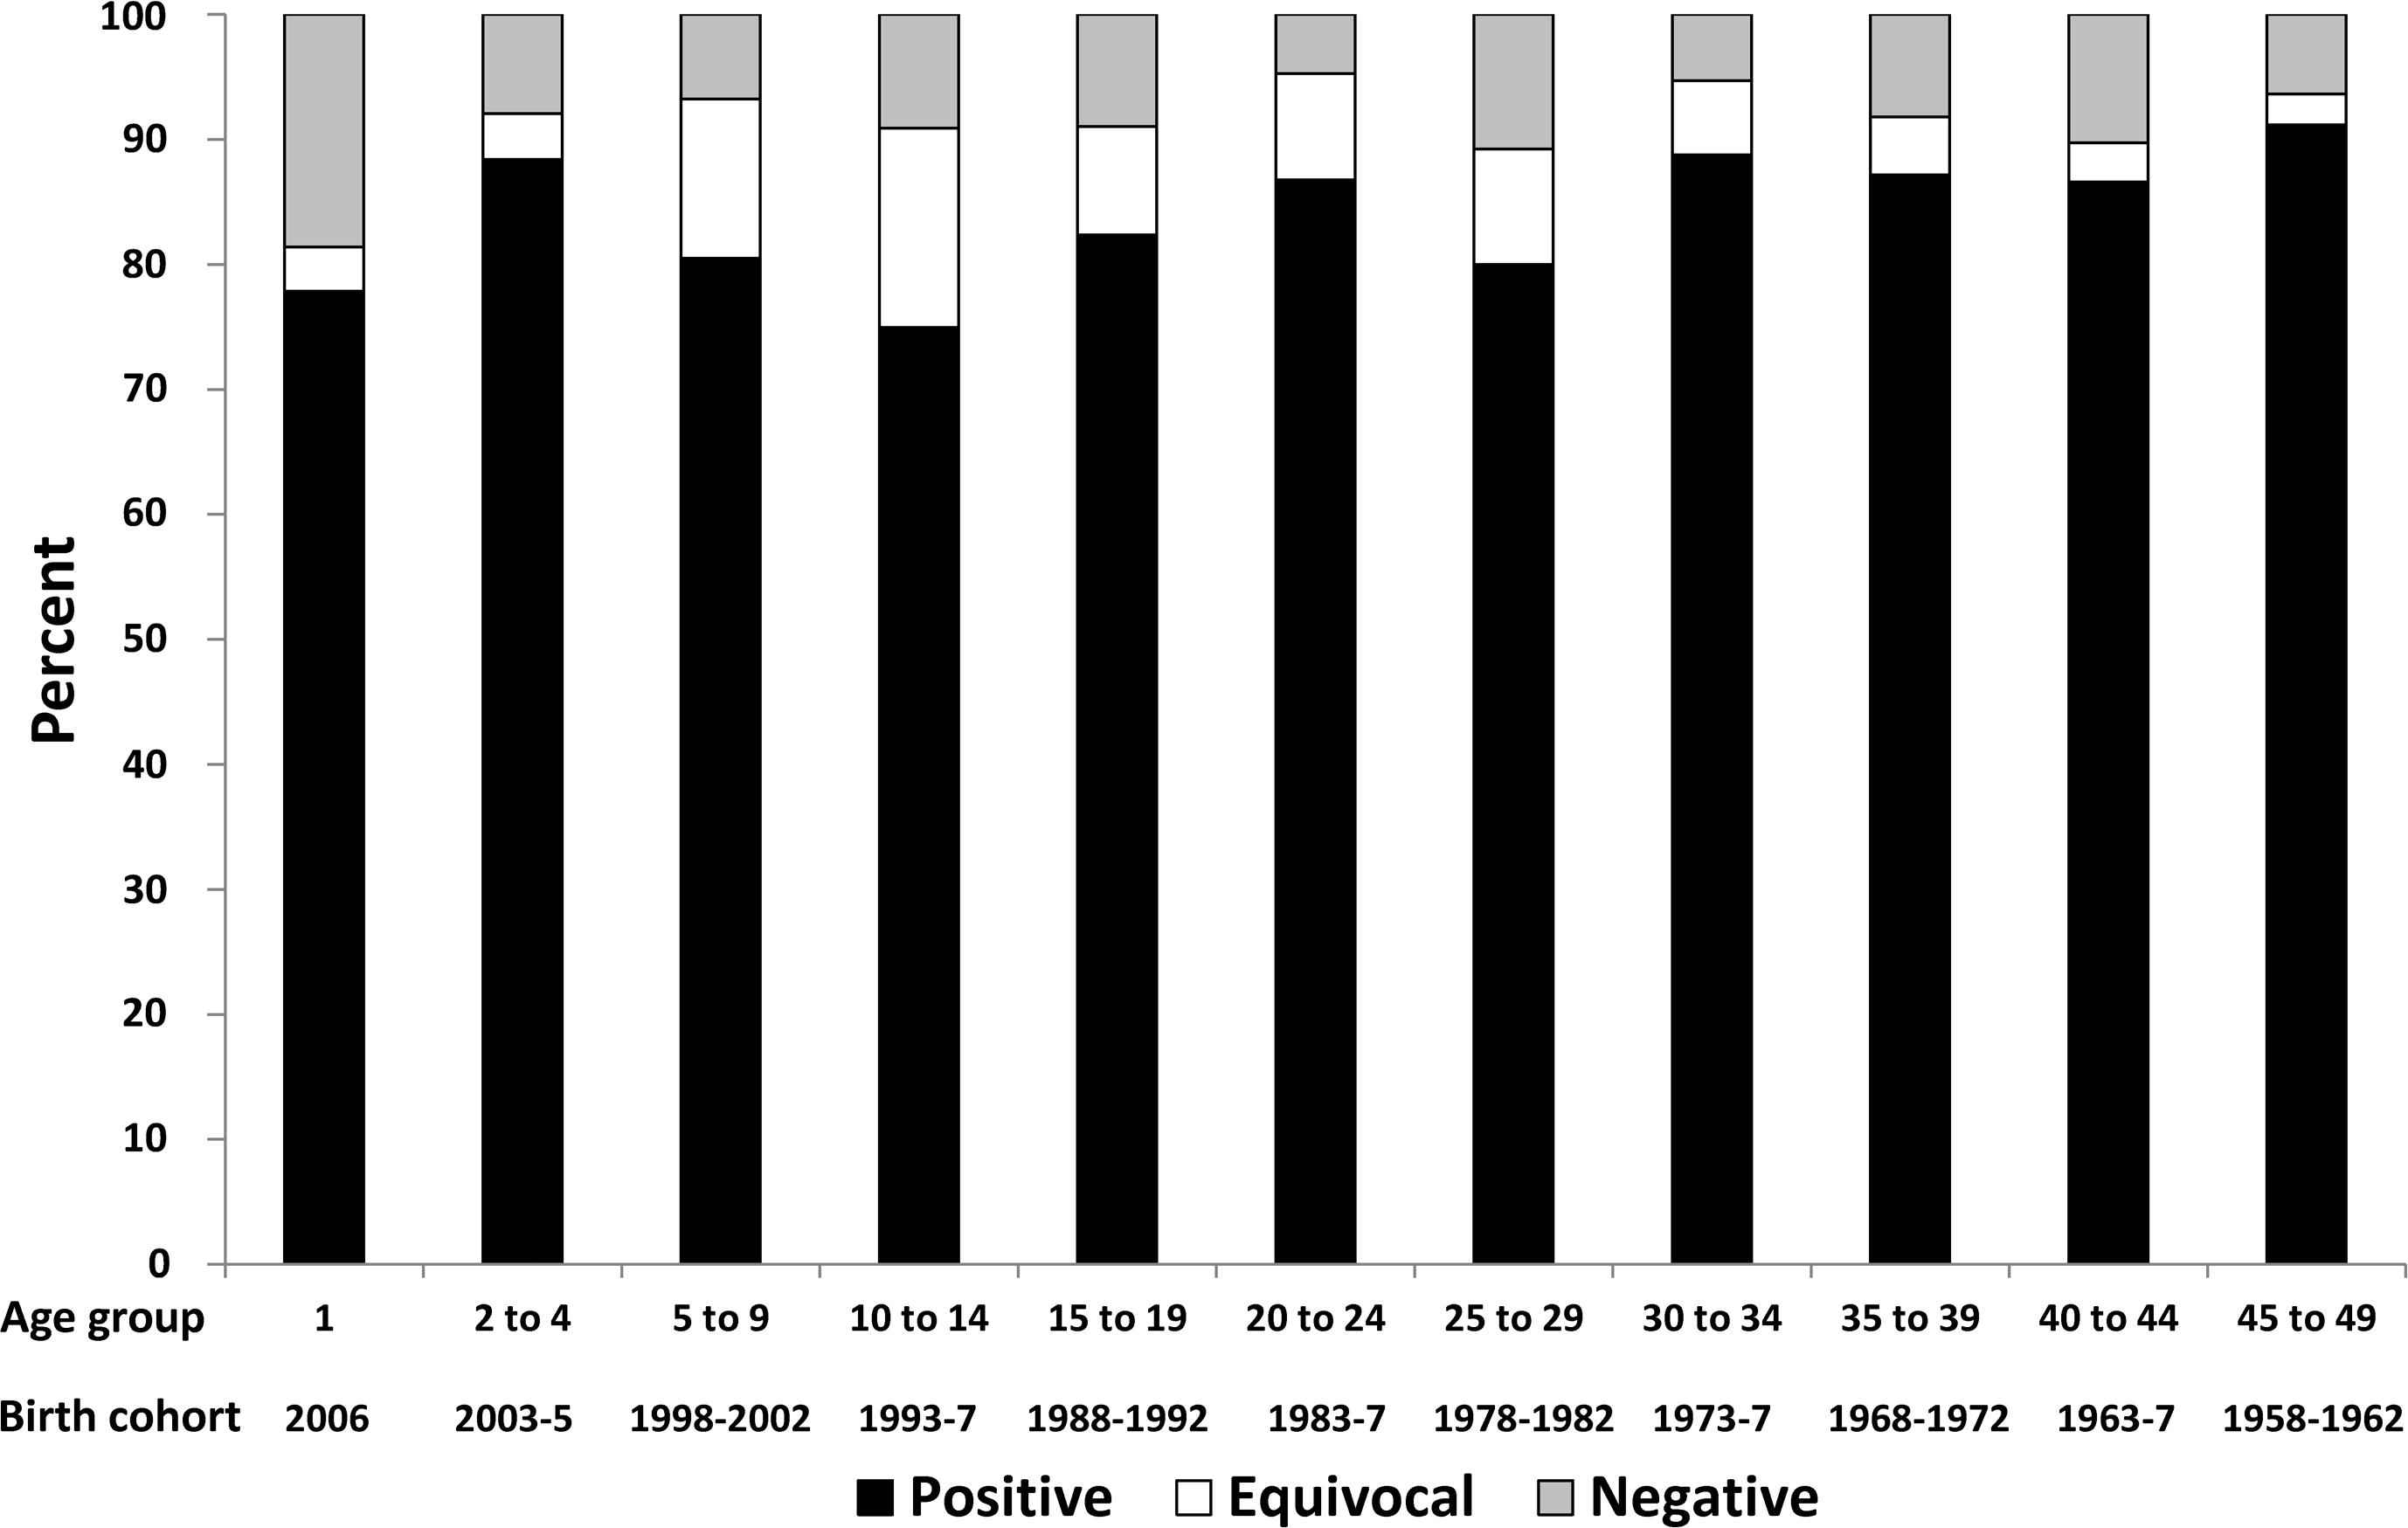
Seroprevalence for anti-measles immunoglobulin G (IgG) antibody by age group and birth cohort, 2007 Australian serosurvey.
| Serosurvey | Age (y) | Numbers tested | % Positive (95% CI) | % Positive + equivocal (95% CI) |
|---|---|---|---|---|
| 1996–1999 | 1–34a | 4425 | 91.9 (91.1–92.7) | 94.7 (94.1–95.3) |
| 1–49a | 5038 | 94.1 (93.5–94.7) | 96.3 (95.8–96.7) | |
| 2002 | 1–34 | 3774 | 89.9 (89.4–90.4) | 91.6 (91.1–92.1) |
| 2007 | 1–34 | 3149 | 82.7 (81.1–84.3) | 92.1 (91.0–93.2) |
| 1–49 | 3396 | 84.6 (83.0–86.3) | 92.1 (90.8–93.4) |
MCC = Measles Control Campaign.
1–18-year-olds post MCC (1999), 19–49-year-olds pre MCC (1996–1998).
Age standardized measles immunoglobulin G (IgG) antibody prevalence by serosurvey.
3.3.3. Estimates of the effective reproduction number R
The effective reproduction number (R) is the average number of secondary cases produced by a typical infectious case in a given population. If R is maintained constantly below one (the epidemic threshold), endemic transmission will be eliminated [21]. The estimates provided here are updates on previously published reports using national notification and serosurveillance data [10,22,23]. The estimated values of R for Australia are below one in each of the three serosurveys (0.57 in 1999, 0.69 in 2002, and 0.84 in 2007), for all years (2009–2012), and for each method applied to notification data (Table 5), providing additional evidence that elimination is being maintained.
| Methods [21,22] | 2009 | 2010 | 2011 | 2012 | ||||
|---|---|---|---|---|---|---|---|---|
| R | 95% CI | R | 95% CI | R | 95% CI | R | 95% CI | |
| Proportion of imported cases | 0.66 | 0.57–0.75 | 0.55 | 0.43–0.67 | 0.68 | 0.62–0.75 | 0.89 | 0.84–0.93 |
| Distribution of outbreak sizes | 0.64 | 0.28–0.78 | 0.59 | 0.32–0.73 | 0.65 | 0.51–0.74 | 0.89 | 0.08–0.96 |
| Distribution of generations of spread | 0.48 | 0.20–0.67 | 0.57 | 0.30–0.72 | 0.56 | 0.45–0.64 | 0.31 | 0.09–0.94 |
CI = confidence interval.
Estimation of reproduction number (R) in Australia using different methods, by individual year, 2009–2012, National Notifiable Diseases Surveillance System (NNDSS) data.
3.4. Sustainability of the national immunization program
Australia has a two-dose measles vaccination schedule, which is included in the National Immunisation Program (NIP). The NIP is fully funded by the Australian Government with vaccines available free of charge to targeted age groups. The addition of any changes to the NIP is accompanied by a comprehensive communication strategy for immunization providers and parents.
3.5. Genotyping evidence that supports interruption of transmission
Genetic characterization of measles isolates is required to confirm the absence of endemic strains, with the absence of previously endemic measles virus strains for >12 months consistent with elimination. Measles genotyping results from VIDRL in 2008–2012 confirmed 354 measles cases detected by reverse transcription polymerase chain reaction assay. Genotyping was available for 309 cases (87%) with 293 identified as wild-type strains and 16 as vaccine-associated (genotype A, not notified to NNDSS). Of the remaining cases, 40 had a viral load that was too low for genotyping (cycle threshold >36, untypable) and five were epidemiologically linked to laboratory confirmed cases from an outbreak of known genotype and typing was not attempted (untyped). Genotypic patterns of measles seen in Australia (Fig. 6) are consistent with the elimination of measles demonstrating a diversity of genotypes throughout the review period (3–5 different genotypes per year, Table 2) with no single genotype detected for a period >33 weeks.
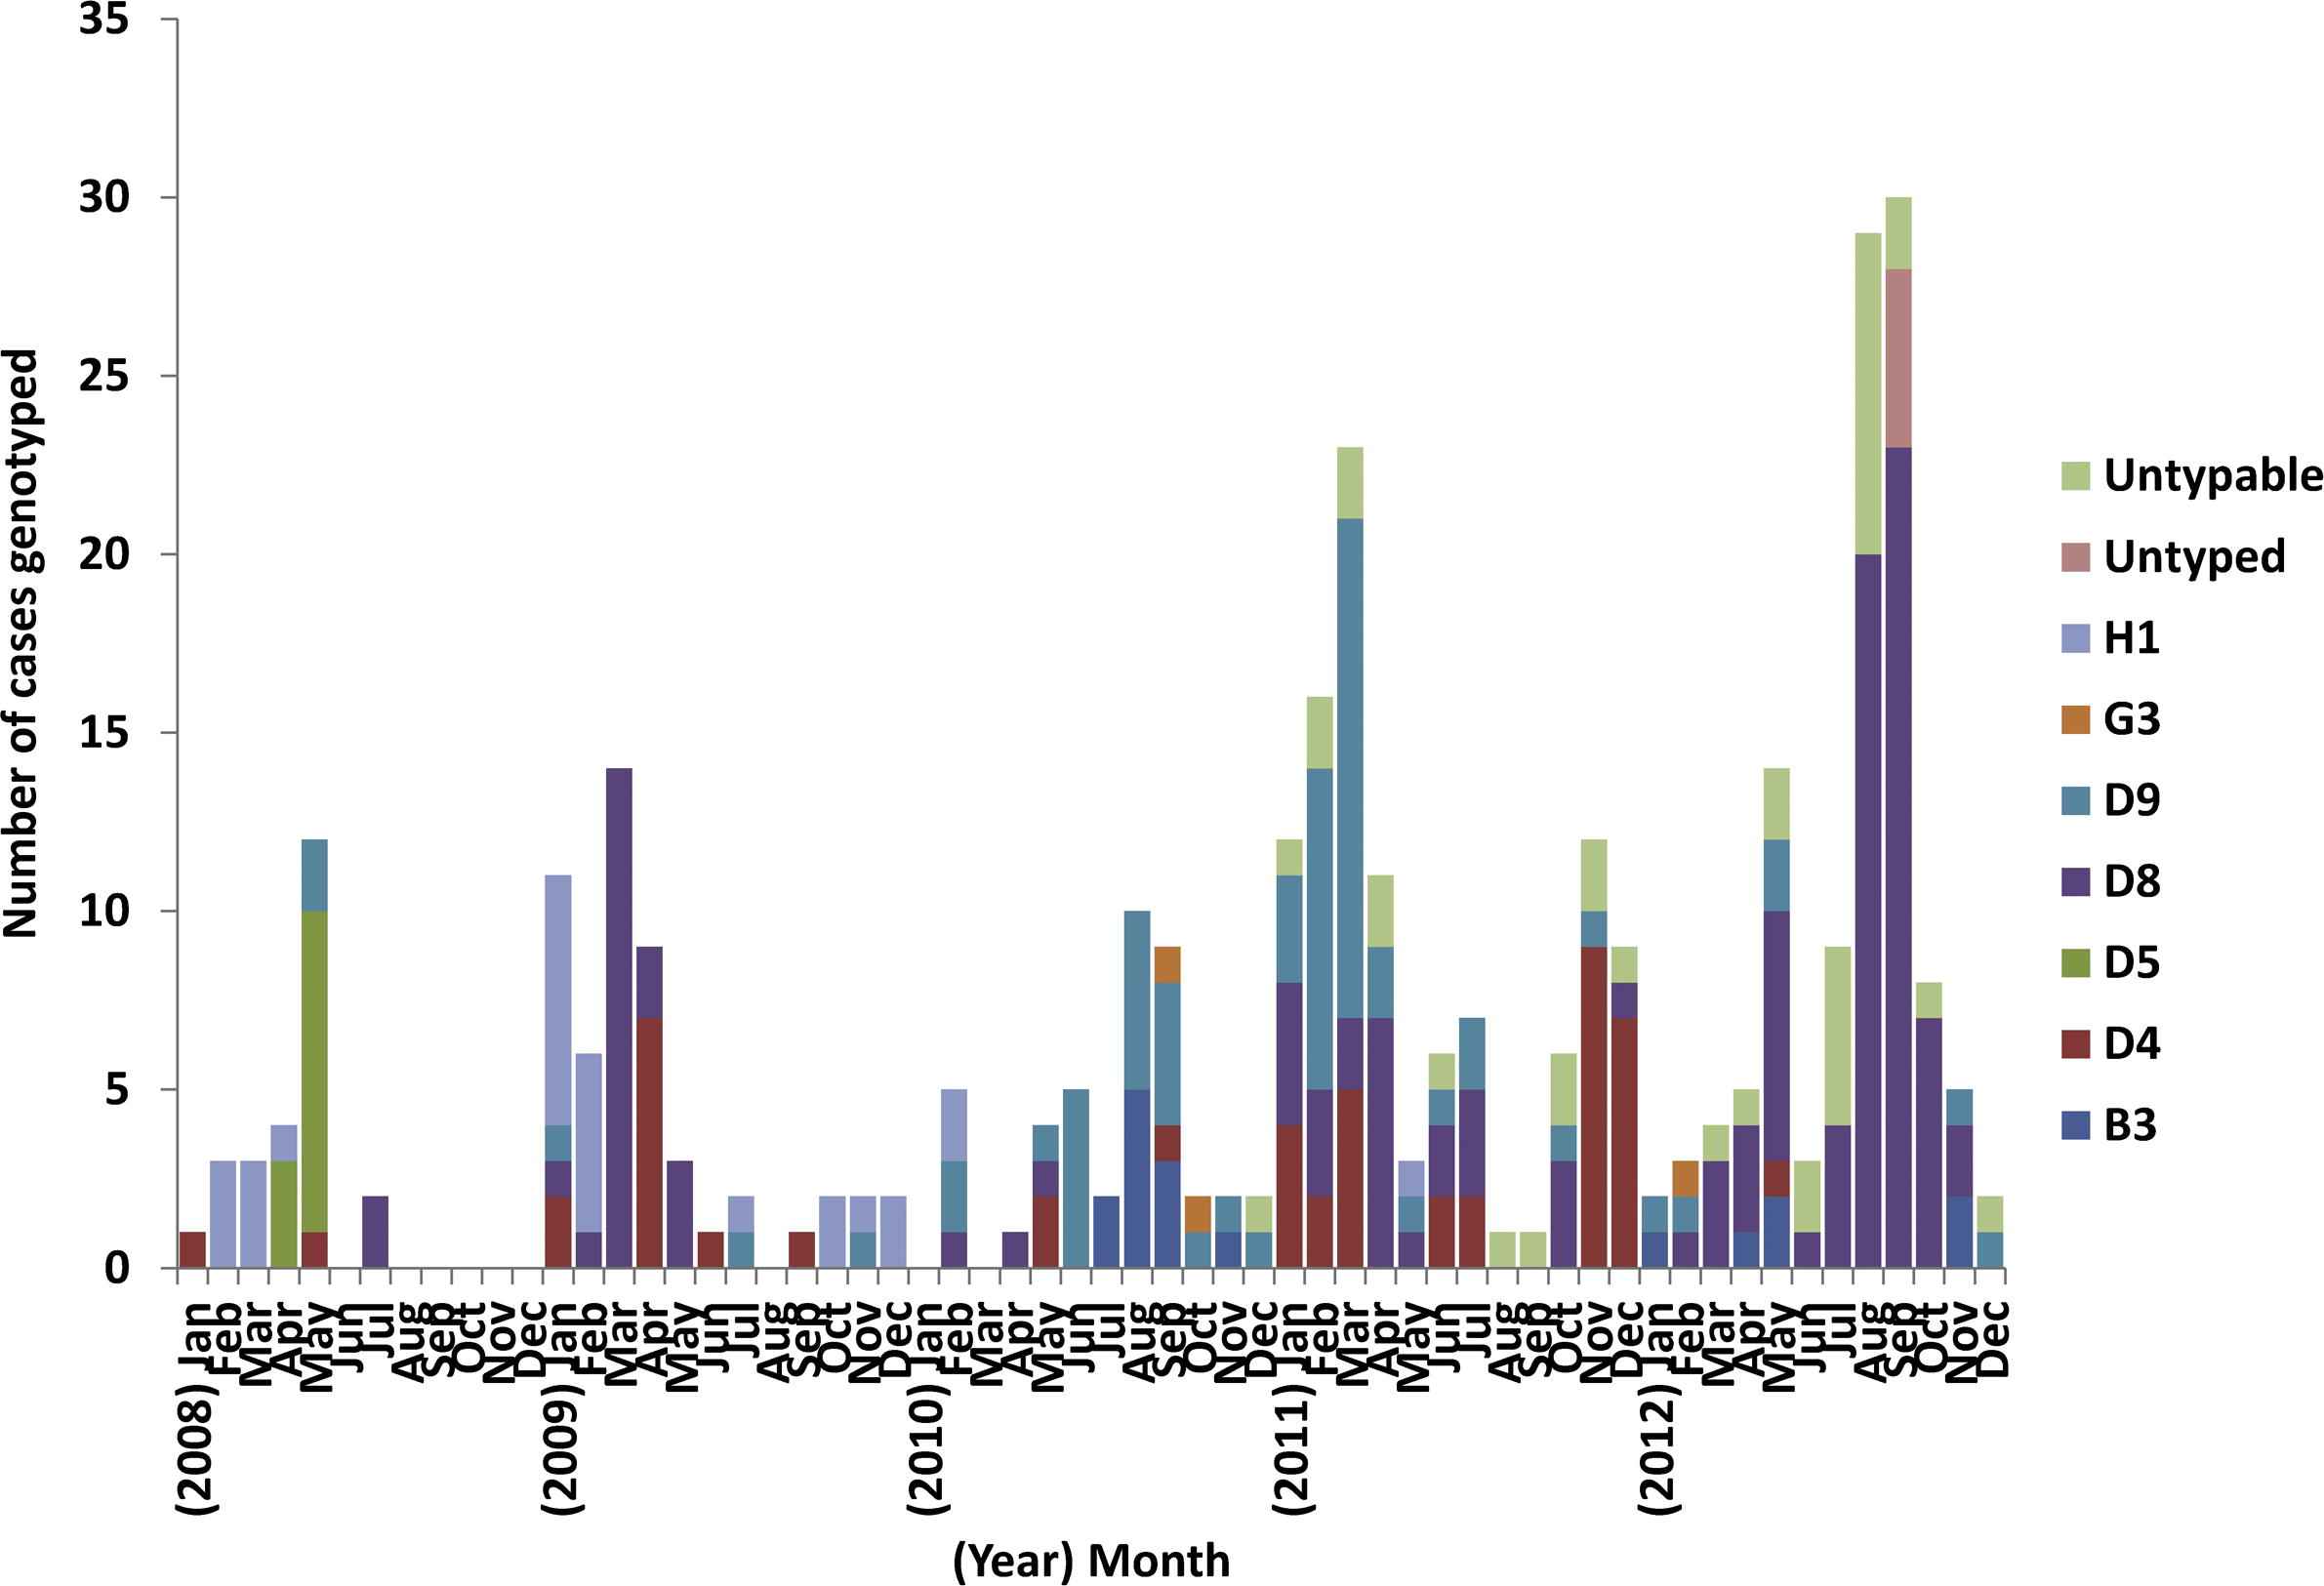
Monthly distribution of measles genotypes identified in Australia, 2008–2012.
4. Discussion
This is the first report to document the application of the WPR RVC guidelines for the elimination of measles in a Western Pacific country. Australia was able to address all lines of evidence with either national or sentinel data and most indicator targets were met or exceeded. The fully funded, sustainable NIP produced high, stable coverage over the 5 year review period of close to 94% at 1 year of age for the first dose of MMR and a gradually increasing second dose coverage which reached 91% in 2012. This had led to high levels of population immunity (a prerequisite for measles elimination) and low measles notification rates, which is reflected in national estimates of the effective reproduction number, R, consistently below the epidemic threshold. Timely and adequate case detection and investigation identified a high proportion of imported or import-linked cases (85%) and most (81%) chains of transmission were genotyped, confirming importation from endemic regions in other countries. As a consequence, Australia was able to adequately demonstrate to the RVC the absence of endemic transmission of the measles virus between 2009 and 2012 [6].
Even though Australia has eliminated measles, there remain some concerning immunity gaps. As in the latest post elimination phase reports from Canada [24] and the United States [25], suboptimal vaccination coverage of infants and adolescents accounted for most cases, with only a small proportion of cases due to vaccine failure. Based on these findings, the RVC made the following recommendations to avoid reestablishment of endemic measles transmission in Australia: improve coverage with the routine childhood schedule (particularly with MMR2), and identify and target vulnerable community groups including susceptible adolescents [6].
In response to the outbreaks in NSW in 2011 and 2012 (which involved a sizable proportion of cases in adolescents) school-based “catch-up” vaccination campaigns are being conducted in all NSW secondary schools over a 4 year period commencing in 2014. In addition, a number of national strategies have been implemented to improve vaccination coverage. The recently published National Immunisation Strategy’s 2013–2018 [26] key priorities are to improve coverage in high risk population groups, identify geographic areas or cohorts with low coverage, and implement strategies to improve immunization coverage in these areas. With this in mind, in 2015 the Australian Government announced funding of $26 million over 4 years to improve immunization coverage including additional payment incentives to vaccine service providers to catch up overdue children. Furthermore, since July 2013, the second dose of MMR (given as a combined MMR-varicella vaccine) has been moved from 4 years to 18 months of age. Finally, from 1 January 2016 when the “No Jab, No Pay” measure is introduced (removing all exemptions, excluding those for medical reasons, for access to child care payments and an end of year Tax supplement), free catch up vaccinations will be available for all children under 10 years of age (ongoing) and children 10–19 years of age from families who currently receive family assistance payments (until December 2017) [27]. All of these strategies should lead to improved uptake of scheduled vaccinations.
High-dose MMR coverage can also accelerate the control of rubella and congenital rubella syndrome, and a target date for rubella elimination in the WPR is being considered. Therefore, for future reports, the RVC has recommended that countries provide evidence of progress towards rubella and congenital rubella syndrome elimination (using a similar format to that used for the measles report) [6] and Australia is currently working towards collecting the required surveillance data.
There are some limitations with the available surveillance data in Australia, which were also highlighted by the RVC in their assessment of our verification report [6]. First, there are few data to identify and characterize vulnerable community groups with low vaccination coverage–the ACIR and national serosurveys only collect a limited amount of information [such as age, sex, indigenous status (ACIR only), and postcode of residence] and national serosurveys have a limited sample size which precludes detailed geographical analysis. However, all cases are investigated to determine risk factors, including ethnicity. In addition, a study is currently underway using linked ACIR and other population administrative data sets to enable enhanced identification of Aboriginal children and other at-risk populations, and the estimation of vaccination coverage in these groups. Another limitation is that there are no nationally collected data on discarded non-measles non-rubella cases, resulting in an inability to report national discard rates using the WHO criteria. However, non-measles case rates were calculated using measles testing data from major laboratories in four states in 2009–2011 and three in 2012. Even though these rates were based on incomplete numerator data, all discard rates, apart from one value, were above 2 per 100,000 population, demonstrating a high rate of testing and the utility of sentinel laboratory data when national surveillance data are not available. Finally, the serosurvey available at the time of the report was from 2007. However, the 2012–2013 serosurvey is currently being analyzed and will provide an update on immunity gaps in the population.
In conclusion, Australia has successfully applied the WHO WPR criteria for the verification of measles elimination, with the process proving sufficiently flexible for use of alternative evidence in some instances. It appears that the comprehensive set of indicators supporting the five lines of evidence provide appropriate rigor to judge achievement of endemic measles elimination. Preservation of Australia’s measles-free status will require continued efforts to maintain high vaccination coverage, improve coverage in vulnerable community groups, and to sustain high quality epidemiological and virological surveillance.
Conflicts of interest
All contributing authors declare no conflicts of interest. The authors received no specific funding for this work.
Acknowledgments
The authors wish to thank the laboratories that provided data for the verification report. We acknowledge State and Territory health authorities and the Australian Government Department of Health for data from the National Notifiable Diseases Surveillance System and the Australian Childhood Immunisation Register. Jennie Leydon, May Chiew, and Emma Denehy are acknowledged for their contribution in the Measles Elimination Working Party. We thank the members of the Australian National Verification Committee for commenting on and presenting the report to the RVC. NCIRS is funded in part by The Australian Government Department of Health, the New South Wales Ministry of Health, and The Children’s Hospital at Westmead. HG and SBL are supported by a NHMRC Early Career Fellowship and SBL is also supported by a Fellowship from the Queensland Children’s Hospital Foundation.
All authors provided input into the study design. N.M., T.T., A.D., V.S., H.G., G.D., and S.L. conducted the analyses. H.G. drafted the paper and H.K., D.D., N.M., S.L., and G.D. provided critical review. All authors have approved the final version.
References
Cite this article
TY  - JOUR
AU  - H.F. Gidding
AU  - N.V. Martin
AU  - V. Stambos
AU  - T. Tran
AU  - A. Dey
AU  - G.K. Dowse
AU  - H.A. Kelly
AU  - D.N. Durrheim
AU  - S.B. Lambert
PY  - 2016
DA  - 2016/01/27
TI  - Verification of measles elimination in Australia: Application of World Health Organization regional guidelines
JO  - Journal of Epidemiology and Global Health
SP  - 197
EP  - 209
VL  - 6
IS  - 3
SN  - 2210-6014
UR  - https://doi.org/10.1016/j.jegh.2015.12.004
DO  - 10.1016/j.jegh.2015.12.004
ID  - Gidding2016
ER  -