
HIV Prevalence, Risk Factors for Infection, and Uptake of Prevention, Testing, and Treatment among Female Sex Workers in Namibia
 , Frieda Katuta1, Andrew D. Maher4, *, , Karen M. Banda1, Krysta Gerndt4, Ismelda Pietersen1, Neia Menezes de Prata2, 3, Nicholus Mutenda1, Tuli Nakanyala1, , Esme Kisting1, Brown Kawana4, Ann-Marie Nietschke1, Dimitri Prybylski2, 3, Willi McFarland4, David W. Lowrance2, 3,
 - DOI
- 10.2991/jegh.k.200603.001How to use a DOI?
- Keywords
- Sex workers; HIV prevalence; key populations; respondent-driven sampling; biobehavioral surveillance; Namibia
- Abstract
Background: In most settings, Female Sex Workers (FSW) bear a disproportionate burden of Human Immunodeficiency Virus (HIV) disease worldwide. Representative data to inform the development of behavioral and biomedical interventions for FSW in Namibia have not been published.
Objectives: Our objectives were to measure HIV prevalence, identify risk factors for infection, and describe uptake of prevention, testing, and treatment among FSW in Namibia.
Methods: We conducted cross-sectional surveys using Respondent-driven Sampling (RDS) in the Namibian cities of Katima Mulilo, Oshikango, Swakopmund/Walvis Bay, and Windhoek. Participating FSW completed behavioral questionnaires and rapid HIV testing.
Results: City-specific ranges of key indicators were: HIV prevalence (31.0–52.3%), reached by prevention programs in the past 12 months (46.9–73.6%), condom use at last sex with commercial (82.1–91.1%) and non-commercial (87.0–94.2%) partners, and tested for HIV within past 12 months or already aware of HIV-positive serostatus (56.9–82.1%). Factors associated with HIV infection varied by site and included: older age, having multiple commercial or non-commercial sex partners, unemployment, being currently out of school, and lower education level. Among HIV-positive FSW, 57.1% were aware of their HIV-positive serostatus and 33.7% were on antiretroviral treatment.
Discussion: Our results indicate extremely high HIV prevalence and low levels of case identification and treatment among FSW in Namibia. Our results, which are the first representative community-based estimates among FSW in Namibia, can inform the scale-up of interventions to reduce the risk for HIV acquisition and onward transmission, including treatment as prevention and pre-exposure prophylaxis.
- Copyright
- © 2020 The Authors. Published by Atlantis Press International B.V.
- Open Access
- This is an open access article distributed under the CC BY-NC 4.0 license (http://creativecommons.org/licenses/by-nc/4.0/).
1. INTRODUCTION
Female Sex Workers (FSW) bear a disproportionate burden of Human Immunodeficiency Virus (HIV) disease in most settings, directly or indirectly accounting for an estimated 40–50% of all new HIV infections worldwide [1]. Approximately one in three FSW are infected with HIV in low- and middle-income countries [2]. Multiple concurrent commercial and non-commercial partnerships [3], barriers to condom use [4–7], and elevated prevalence of sexually transmitted infections [8–11] are the factors that may contribute to elevate risk for infection and onward transmission among FSW. Stigmatization, marginalization, or criminalization by societies may disempower FSW to modify their risk and access services [12]. Suboptimal case identification, Antiretroviral Treatment (ART) and viral load suppression among HIV-positive FSW may undermine the achievement of population impact goals [13]. Reliable estimates of HIV prevalence, risk factors for infection, and access to services are needed to inform the development of behavioral, biomedical, and structural interventions for this key population.
We conducted cross-sectional surveys using Respondent-driven Sampling (RDS) to estimate the prevalence of HIV, risk behaviors and uptake of prevention, testing, and treatment services among FSW in four cities of Namibia, a country in southwest Africa with a mature, generalized HIV epidemic where approximately 14% of the general population was living with HIV.
2. MATERIALS AND METHODS
2.1. Study Setting and Participants
We conducted cross-sectional surveys in the Namibian cities of Katima Mulilo, Oshikango, Swakopmund/Walvis Bay, and Windhoek. Study cities were chosen based on data from a formative assessment, which indicated high concentrations of FSW and the presence of organizations working with FSW in these cities who could receive referrals for HIV care and prevention. Persons who self-identified as female, were aged 18 years or older, exchanged sex for money in the past 30 days, and resided in one of the study cities for at least the past 6 months were eligible.
2.2. Sampling Design and Recruitment
Participants were recruited by RDS, a peer-referral-based method that has been used to engage hidden populations in settings worldwide [14]. Women who were well-connect to FSW were selected as “seeds” to initiate recruitment chains at each study site. Seeds were diverse with regards to marital status, sexual identity, engagement in sex work, age, employment or student status, income, and having known access to FSW-friendly services. Seeds were instructed to recruit FSW from their social network, who, if eligible, were enrolled and instructed to recruit other FSW peers. Sampling continued until the target sample size was met and equilibrium was achieved on key variables, including HIV testing, HIV serostatus, student status, education, age, and marital status. Unique coupon codes were used to link who recruited whom for statistical adjustment. The number of recruitment coupons given for each person ranged from three to 11 coupons based on the need for diversity and on the progress of recruitment for each study site.
2.3. Behavioral Measures
Trained study staff collected behavioral data through in-person interviews with FSW using a standardized questionnaire. Survey questionnaires were based on those used in surveys of FSW elsewhere [15] and incorporated UNAIDS Global AIDS Response Progress Reporting (GAPR) indicators for key-populations [16]. Items included basic demographic characteristics, risk behaviors, and indicators of the utilization of prevention services. HIV diagnosis, linkage to care, retention in care, receipt of ART, and retention on ART was also measured by self-report among HIV-positive FSW during face-to-face interviews.
2.4. Laboratory Methods
Participants were screened for HIV antibodies using the national standard, parallel algorithm [Determine HIV 1/2 test (Abbott Diagnostic Division, Hoofddorp, The Netherlands), and Uni-Gold Recombigen HIV test (Trinity Biotech, Brey, Ireland) rapid tests performed simultaneously with Clearview® Complete HIV1/2 (Inverness Medical, Parker, CO, USA) used as a tie-breaker in the case of discrepant results] [17]. Participants testing positive for HIV were given standardized post-test counseling and were referred to HIV care.
2.5. Data Management and Statistical Analysis
Interviewers entered behavioral and HIV rapid-test results data into QDS™ software (Version 4.0, Nova Research, Silver Spring, MD, USA) at the study site during the face-to-face interview. We used RDSAT software (Version 7.1, Cornell University, Ithaca, NY, USA), which applies the RDS-II estimator described by Volz and Heckathorn [18], to produce point estimates and 95% confidence intervals of the demographic and risk behavior variables and HIV prevalence by study site. We set re-samples for bootstrapping to 150,000 and the “enhanced data-smoothing” algorithm was used. Interviewers assessed the RDS network size by asking FSW, “Approximately how many other female sex workers older than 18 years do you know who live in this city and that you have seen in the past 30 days?”. We exported RDSAT-produced survey weights to Stata (Intercooled Version 12.1, StataCorp LP, College Station, TX, USA) for multivariate logistic regression analysis. We selected candidate variables for inclusion in analysis of HIV correlates if they had potential use to target interventions and if they produced p-values ≤0.20 in bivariate models. A final model retained variables that produced p-values ≤0.1 in association with HIV infection. We calculated survey Adjusted Odds Ratios (AOR) using Stata’s svy: logistic command. We considered associations at p < 0.05 to be statistically significant. We pooled data on previous HIV diagnoses, care, and treatment among HIV-positive FSW in all four sites were pooled and analyzed them without adjustment for the RDS design due to the smaller sample size of HIV-positive FSW.
2.6. Ethical Considerations
Participants received N$100 (∼10 US$) for transportation and an incentive package valued at $10. For each success recruit of a peer, participants received a mobile phone network voucher valued at $2. Participants provided verbal informed consent to participate in the study. The Research Committee of the Directorate for Policy, Planning and Human Resources of the Ministry of Health and Social Services in Windhoek, Namibia, the Committee on Human Research at the University of California, San Francisco in San Francisco, and the Division of Global HIV/AIDS in the Centers for Disease Control and Prevention, Atlanta reviewed and approved the study protocol. The study complied with the Ethical Principles for Medical Research Involving Human Subjects of the World Medical Association and the Recommendations for the Conduct, Reporting, Editing, and Publication of Scholarly work in Medical Journals of the International Committee of Medical Journal Editors.
3. RESULTS
3.1. Recruitment
We conducted the surveys from September 2012 to August 2013 in Swakopmund/Walvis Bay and Windhoek and from October 2013 to June 2014 in Katima Mulilo and Oshikango. Nine seeds initiated recruitment in the Katima Mulilo site; one was ineligible and eight generated recruitment chains, three of whose chains accounted for 50.5% of the final sample. The longest chain in Katima Mulilo was 11 waves of recruitment. Nine seeds initiated recruitment in the Oshikango site; three were ineligible and six generated recruitment chains, one of which initiated the recruitment of 75.0% of the final sample through 15 waves. Five seeds initiated recruitment in Swakopmund/Walvis Bay site; one seed recruited through nine waves while the other four terminated after two waves of recruitment. We added an additional 14 seeds due to slow recruitment. Four of the 19 total seeds contributed more than one-third of the total number of participants. Ten seeds initiated recruitment in the Windhoek site, all of whom were eligible. Due to the slow pace of recruitment, we added nine additional seeds. Of the 19 seeds included, one contributed to more than 50% of the recruitment. The maximum number of recruitment waves was eight in the Windhoek site. The final sample included 309, 256, 307, and 316 FSW in the Katima Mulilo, Oshikango, Swakopmund/Walvis Bay, and Windhoek study sites, respectively. The eligibility rate (i.e., number participants screened eligible/the number of coupons returned by potential participants) was 72.5%, 77.6%, 77.5%, and 86.3% in the Katima Mulilo, Oshikango, Swakopmund/Walvis Bay, and Windhoek study sites, respectively.
3.2. Demographic and Behavioral Characteristics
The percentage of FSW aged <25 years ranged from 22.4% in Swakopmund/Walvis Bay to 46.7% in Katima Mulilo (Table 1). Between 4.8% (Katima Mulilo) and 18.2% (Windhoek) of FSW had been physically abused or assaulted during the past 12 months. Alcohol abuse (defined as an AUDIT-C score of ≥3) [19] was highly prevalent among FSW in each site (range: 79.5%, Swakopmund/Walvis Bay – 93.6%, Windhoek). Illicit drug use ranged from 8.8% in Swakopmund/Walvis Bay to 19.3% in Windhoek.
| Variable | Katima Mulilo | Oshikango | Swakopmund/Walvis Bay | Windhoek | ||||
|---|---|---|---|---|---|---|---|---|
| N | RDS Adj. % (95% CI) | N | RDS Adj. % (95% CI) | N | RDS Adj. % (95% CI) | N | RDS Adj. % (95% CI) | |
| Age group (years) | ||||||||
| 18–24 | 123 | 46.7 (37.7–54.2) | 98 | 34.7 (26.5–43.8) | 57 | 22.4 (15.3–30.8) | 103 | 34.3 (26.9–43.8) |
| 25–34 | 137 | 37.8 (29.8–46.4) | 137 | 56.8 (47.7–65.2) | 191 | 59.1 (51.0–66.5) | 120 | 39.3 (30.2–46.8) |
| 35+ | 48 | 15.5 (10.3–22.5) | 21 | 8.5 (4.1–13.8) | 59 | 18.4 (12.9–24.5) | 93 | 26.5 (19.2–34.3) |
| Secondary education or more | 219 | 69.4 (61–77.3) | 196 | 77.7 (69.8–85.7) | 252 | 84.9 (79.6–89.9) | 198 | 60.3 (52.4–68.8) |
| Currently a student | 30 | 9.4 (5.9–13.7) | 7 | 2.7 (0.2–7.2) | 24 | 8.1 (4.4–12.4) | 5 | 1.6 (0.0–2.2) |
| Employed in the past 12 months | 42 | 14.5 (9.8–19.8) | 36 | 17.2 (10.8–24.5) | 62 | 22.8 (15.5–31.0) | 120 | 33.0 (26.1–40.5) |
| Ever married or cohabitating | 59 | 21.2 (15.4–27.7) | 20 | 9.9 (4.9–16.1) | 29 | 9.1 (5.4–13.7) | 40 | 9.9 (6.3–14.6) |
| Physically abused or assaulted in the past 12 months | 15 | 4.8 (1.8–8.8) | 23 | 7.4 (3.9–11.5) | 24 | 6.8 (3.2–11.0) | 83 | 18.2 (12.3–25.1) |
| Screened positive for alcohol abuse (AUDIT-C)a | 296 | 93.3 (88.6–97.1) | 229 | 88.5 (83.2–93.2) | 243 | 79.5 (72.2–84.9) | 300 | 93.6 (88.3–97.5) |
| Ever used any illicit drugs | 37 | 13.1 (7.8–18.7) | 31 | 11.4 (5.5–18.1) | 32 | 8.8 (4.8–14.0) | 74 | 19.3 (13.8–25.7) |
| Age first exchanged sex for money (years) | ||||||||
| <15 | 13 | 2.5 (1.1–4.6) | 6 | 1.1 (0.2–2.4) | 3 | 2.3 (0.0–5.4) | 22 | 5.4 (2.1–8.5) |
| 15–19 | 142 | 46.9 (38.7–55.4) | 104 | 48.6 (37.7–58.3) | 60 | 20.6 (13.9–28.5) | 155 | 51.5 (43.2–60.4) |
| 20+ | 154 | 50.6 (42–58.6) | 146 | 50.3 (40.5–61.2) | 244 | 77.1 (69.2–84.0) | 139 | 43.1 (34.5–52.1) |
| Number of commercial sex partners in the past 30 daysb | ||||||||
| <5 | 186 | 68.2 (61.3–75.2) | 24 | 12.4 (6.6 – 19.0) | 151 | 50.5 (40.5–59.2) | 139 | 45.3 (37.8–54.0) |
| 5–9 | 88 | 21.7 (16.8–27.6) | 83 | 37.6 (28.4–46.9) | 95 | 30.9 (23.7–38.9) | 94 | 31.8 (24.2–40.1) |
| 10–14 | 19 | 5.0 (2.2–8.2) | 33 | 13.1 (7.5–19.6) | 22 | 8.2 (3.9–13.1) | 24 | 6.4 (3.5–9.7) |
| 15+ | 16 | 5.1 (1.8–8.7) | 116 | 36.9 (27.1–47.3) | 39 | 10.4 (6.1–16.9) | 59 | 16.5 (10.5–21.7) |
| Number of non-commercial sex partners in the past 30 daysc | ||||||||
| None | 129 | 46.4 (38.7–54.6) | 151 | 55.5 (45.7–66.6) | 132 | 44.4 (36.7–52.0) | 61 | 22.2 (14.8–29.9) |
| 1–3 | 78 | 23 (17.1–29.4) | 42 | 17.6 (10.9–25.2) | 109 | 35.0 (27.7–42.7) | 97 | 32.7 (25.3–40.8) |
| 4+ | 102 | 30.5 (23.8–37.2) | 63 | 26.9 (17.2–36.1) | 66 | 20.6 (14.5–27.2) | 158 | 45.1 (36.9–53.6) |
| Total partners in the past 30 days | ||||||||
| <5 | 107 | 43.3 (35.7–50.8) | 16 | 9.8 (4.6–16.2) | 93 | 33.0 (24.7–41.5) | 71 | 22.5 (14.0–29.2) |
| 5–9 | 142 | 39.6 (32.6–47.1) | 70 | 27.7 (18.9–36.2) | 136 | 44.5 (36.0–51.5) | 115 | 41.2 (34.1–51.3) |
| 10–14 | 31 | 9 (5.5–13.3) | 45 | 22.5 (15.3–32.5) | 35 | 12.2 (7.7–18.1) | 46 | 12.8 (8.3–17.8) |
| 15+ | 29 | 8.2 (4.1–12.8) | 125 | 40 (29.6–49.5) | 43 | 10.2 (6.0–16.6) | 84 | 23.4 (17.0–30.5) |
| Symptoms or diagnosis of sexually transmitted infection in the past 12 months | 99 | 31.2 (24.3–38.3) | 54 | 15.3 (9.9–21.7) | 81 | 21.7 (15.8–28.2) | 118 | 35.6 (28.0–43.7) |
| Reached by prevention programs in the past 6 monthsd | 135 | 46.9 (39.3–54.9) | 207 | 73.6 (64.9–81.5) | 227 | 68.4 (60.1–76.1) | 161 | 50.8 (41.8–59.0) |
| Received HIV-related peer outreach in the past 6 months | 47 | 13.1 (8.3 – 18.0) | 75 | 25.2 (16.1–34.9) | 42 | 10.6 (5.6–15.7) | 61 | 18.8 (12.9–26.1) |
| Condom used at last sex with most recent commercial sex partner | 131 | 91.1 (79.8–96.3) | 165 | 82.1 (73.1–91.7) | 232 | 86.8 (74.5–94.0) | 198 | 84.2 (74.2–89.9) |
| Condom used at last sex with most recent non-commercial sex partnere | 93 | 88.5 (78.9–96.3) | 77 | 88.7 (84.6–99.4) | 131 | 94.2 (89.8–99.0) | 156 | 87.0 (75.1–93.2) |
| Used condoms with all commercial sex partners in the past 30 days | 92 | 29.3 (21.6–37.4) | 98 | 38.2 (28.2–48.9) | 186 | 60.9 (52.1–70.5) | 146 | 50.1 (41.6–58.6) |
| Used condoms with all non-commercial sex partners in the past 30 dayse | 79 | 45.1 (34.3–55.1) | 52 | 45.1 (29.1–62.1) | 109 | 35.8 (28.1–44.2) | 97 | 29.4 (23.1–37.4) |
| Tested for HIV within the past 12 months or already aware of HIV-positive serostatus | 204 | 64.4 (57.0–72.0) | 210 | 82.1 (73.7–88.7) | 220 | 71.9 (64.5–80.7) | 198 | 56.9 (47.8–65.7) |
AUDIT-C measure is composed of three questions: 1. “How often did you drink alcohol in the past 12 months?”, “How many glasses of alcohol do you consume on a typical day when drinking?” and “How often do you consume six or more alcoholic beverages on one occasion?” The AUDIT-C is scored on a scale of 0–12 (scores of 0 reflect no alcohol use). In women, a score of three or more is considered positive.
“Client” refers to a partner with whom engagement in sexual intercourse is exclusively for monetary payment in exchange for sex.
“Non-commercial” refers to partners with whom sexual intercourse is not exclusively transactional (e.g., spouse, boyfriend, casual partner).
Global AIDS Progress Reporting (GARPR) indicator as answered yes to: “Do you know where to receive a free HIV test?”, “Have you received free condoms during the past 12 months?”
Calculated only among FSW who had a non-commercial sex partner during the past 30 days.
Demographic characteristics and HIV risk-related behaviors, female sex workers in four cities of Namibia (Katima Mulilo, Oshikango, Swakopmund/Walvis Bay, and Windhoek), 2012–14
The majority of FSW in Katima Mulilo (50.6%), Oshikango (50.3%), and Swakopmund/Walvis Bay (77.1%) first engaged in sex work at the age of 20 years or later, while 51.5% starting between the ages of 15 and 19 years in Windhoek. Between 5.1% (Katima Mulilo) and 36.9% (Oshikango) of FSW had more than 15 commercial sex partners during the past 30 days. Non-commercial sex partnerships were also common among FSW, contributing to a high total number of partners in the past 30 days. The percentage of FSW with symptoms or diagnosis of an STI during the past 12 months ranged from 15.3% (Oshikango) to 35.6% (Windhoek).
Between 46.9% (Katima Mulilo) and 73.6% (Oshikango) of FSW received an HIV prevention intervention during the past 12 months. Far fewer FSW (10.6% in Swakopmund/Walvis Bay to 25.2% in Oshikango) received HIV-related outreach from a peer. The percentage of FSW in each site who reported condom use at most recent sex with a commercial sex partner ranged from 82.1% in Oshikango to 91.1% in Katima Mulilo. Fewer FSW used condoms with all of their commercial partners (range: 29.3% Katima Mulilo to 60.9% Swakopmund/Walvis Bay) and non-commercial sex partners (range: 29.4% Windhoek to 45.1% Katima Mulilo and Oshikango) during the past 30 days.
3.3. HIV Prevalence and Risk Factors for Infection
Human Immunodeficiency Virus prevalence among FSW was 52.3% (95% CI: 44.3–60.3) in Katima Mulilo, 31.0% (95% CI: 20.7–40.8) in Oshikango, 39.3% (95% CI: 30.8–47.7) in Swakopmund/Walvis Bay, and 37.5% (95% CI: 30.0–46.7) in Windhoek (Table 2). Among FSW in Katima Mulilo older age (AOR: 1.19 per advancing year, p < 0.001), not being currently a student (AOR: 2.94, p = 0.02) and having a greater number of commercial sex partner during the past 30 days (AOR: 1.62, p = 0.03) were significantly associated with an increased probability of HIV infection (Table 3). Among FSW in Oshikango older age (AOR: 1.13 per advancing year, p = 0.004), completion of primary school level of education or less (AOR: 3.68, p = 0.007), having a greater number of commercial sex partner during the past 30 days (AOR: 1.98, p = 0.002), and having one to three non-commercial sex partners during the past 30 days (AOR: 4.23, p = 0.002) were significantly associated with an increased probability of HIV infection. Among FSW in Swakopmund/Walvis Bay older age (AOR: 1.09 per advancing year, p = 0.01), completion of primary school level of education or less (AOR: 3.77, p = 0.003), not being employed (AOR: 2.85, p = 0.008), having fewer than ten commercial sex partners during the past 30 days (AOR: 2.36, p = 0.05), and having a greater number of non-commercial sex partners during the past 30 days (AOR: 1.11 per additional partner, p = 0.05) were significantly or borderline significantly associated with an increased probability of HIV infection. In Windhoek older age (AOR: 1.08 per advancing year, p < 0.001), not being employed (AOR: 2.33, p = 0.02), and having ever used illicit drugs (AOR: 2.11, p = 0.05) were significantly associated with an increased probability of HIV infection.
| Katima Mulilo | Oshikango | Swakopmund/Walvis Bay | Windhoek | |||||||||
|---|---|---|---|---|---|---|---|---|---|---|---|---|
| N | RDS Adj. % (95% CI) | p | N | RDS Adj. % (95% CI) | p | N | RDS Adj. % (95% CI) | p | N | RDS Adj. % (95% CI) | p | |
| HIV prevalence overall | 177 | 52.3 (44.3–60.3) | 77 | 31.0 (20.7–40.8) | 130 | 39.3 (30.8–47.7) | 103 | 37.5 (30.0–46.7) | – | |||
| HIV prevalence by variable | ||||||||||||
| Age group (years) | ||||||||||||
| 18–24 | 43 | 31.0 (22.8–44.8) | Ref | 22 | 26.4 (10.7–40.8) | Ref. | 6 | 14.9 (1.6 – 31.0) | Ref. | 16 | 19.8 (10.3–34.7) | Ref. |
| 25–34 | 90 | 58.7 (46.1–69.1) | <0.001 | 40 | 27.3 (15.2–41.9) | 0.94 | 91 | 44.0 (34.6 – 55.0) | <0.001 | 43 | 38.1 (24.8–49.4) | 0.04 |
| 35+ | 43 | 94.8 (87.2–99.7) | <0.001 | 15 | 70.6 (37.0 – 96.0) | <0.001 | 33 | 46.2 (30.2–64.4) | <0.001 | 44 | 56.6 (40.5–74.8) | 0.08 |
| Education completed | ||||||||||||
| Primary or less | 55 | 55.8 (42.8–69.2) | Ref | 28 | 47.7 (29.7–66.5) | Ref. | 36 | 72.3 (55.1–86.7) | Ref. | 40 | 44.4 (33.6–58.3) | Ref. |
| Secondary or more | 122 | 52.3 (41.8–62.0) | 0.6 | 49 | 26.2 (14.6–38.3) | 0.06 | 94 | 36.2 (27.9–46.5) | <0.001 | 62 | 33.7 (24.5–46.4) | 0.2 |
| Currently a student | ||||||||||||
| Yes | 9 | 26.0 (11.5–44.2) | Ref | 2 | 7.2 (0.0–91.4) | Ref. | 118 | 45.2 (15.5–71.3) | Ref. | 2 | 53.5 (0–100) | Ref. |
| No | 162 | 57.1 (47.8–65.8) | <0.001 | 71 | 29.4 (18.4–38.7) | 0.36 | 10 | 37.6 (29.1–46.6) | 0.62 | 93 | 34.6 (27.1–43.9) | 0.46 |
| Employed in the past 12 months | ||||||||||||
| Yes | 21 | 53.4 (35.7–71.6) | Ref | 14 | 36.6 (15.7–58.1) | Ref. | 21 | 20.5 (9.2–35.3) | Ref. | 31 | 25.2 (12.5–35.9) | Ref. |
| No | 156 | 52.4 (44.1–61.4) | 0.92 | 63 | 29.9 (18.7–40.9) | 0.58 | 109 | 44.3 (35.1–53.2) | <0.001 | 72 | 41.9 (31.8–52.4) | 0.04 |
| Marital status | ||||||||||||
| Ever married | 46 | 68.9 (50.5–86.0) | Ref | 8 | 53.7 (23.4–81.6) | Ref. | 15 | 33.6 (14.4–61.9) | Ref. | 13 | 29.4 (13.5–48.7) | Ref. |
| Never married | 131 | 47.9 (39.7–57.2) | 0.04 | 69 | 29.4 (18.4–39.6) | 0.12 | 115 | 39.9 (30.5–48.5) | 0.62 | 90 | 38.7 (30.5–49.2) | 0.36 |
| Positive for alcohol abuse (AUDIT-C) | ||||||||||||
| Yes | 172 | 52.3 (43.4–60.7) | Ref | 69 | 32.3 (21–42.8) | Ref. | 99 | 38.2 (30–48.6) | Ref. | 97 | 38.4 (30.7–47.3) | Ref. |
| No | 5 | 53.4 (13.1–84.1) | 0.96 | 8 | 24.7 (5.5–46.2) | 0.52 | 31 | 42.3 (24.8–58.7) | 0.68 | 6 | 29.2 (2.1–69.6) | 0.6 |
| Ever used any illicit drugs | ||||||||||||
| Yes | 24 | 52.1 (30.8–78.7) | Ref | 8 | 32.4 (7.5–60.7) | Ref. | 8 | 8.0 (0.4–16.2) | Ref. | 29 | 50.9 (32.5–66.8) | Ref. |
| No | 153 | 52.0 (43.6–60.1) | 1 | 69 | 31.1 (20.5–41.6) | 0.92 | 122 | 42.3 (32.1–49.9) | <0.001 | 74 | 35.0 (26.8–46.2) | 0.12 |
| Age at first sex work | ||||||||||||
| <15 years | 9 | 54.0 (20.7–93.9) | Ref | 3 | 75.9 (0–100) | Ref. | 2 | 82.8 (0–100) | Ref. | 6 | 27.2 (6.2–67.2) | Ref. |
| 15–19 | 67 | 37.2 (25.7–46.7) | 0.19 | 23 | 29.4 (11.9–46.5) | 0.08 | 23 | 42.7 (20.8–58.7) | 0.14 | 50 | 39.6 (28.1–51.5) | 0.46 |
| 20+ | 101 | 64.6 (54.8–74.2) | 0.58 | 51 | 29.6 (19.4–39.1) | 0.08 | 105 | 37.7 (28.1–47.4) | 0.08 | 47 | 35.7 (24.8–49.5) | 0.62 |
| Client sex partners in the past 30 days | ||||||||||||
| <10 | 153 | 50.7 (42.3–58.8) | Ref | 28 | 21.4 (12.7–32.2) | Ref. | 109 | 41.4 (31.7–51.1) | Ref. | 75 | 38.4 (28.8–48.9) | Ref. |
| 10+ | 24 | 65.7 (42.9–88.0) | 0.22 | 49 | 39.6 (22.6–53.1) | 0.04 | 21 | 26.7 (14.4–40.7) | 0.08 | 28 | 32.9 (20.7–48.5) | 0.52 |
| Non-commercial sex partners in the past 30 days | ||||||||||||
| 0 | 78 | 55.3 (43.5–67.7) | Ref | 48 | 23.6 (14.4–33.6) | Ref. | 54 | 32.9 (22.4–44.1) | Ref. | 20 | 42.1 (23.7–63.2) | Ref. |
| 1–3 | 41 | 50.2 (34.5–65.5) | 0.62 | 14 | 41.2 (16.8–64) | 0.18 | 44 | 41.4 (26.7–54.5) | 0.34 | 32 | 36.4 (23.4–53.1) | 0.66 |
| 4+ | 58 | 51.0 (37.7–63.0) | 0.64 | 15 | 36.1 (11.5–52.9) | 0.28 | 32 | 48.7 (30.6–65.0) | 0.12 | 51 | 34.9 (26.2–48.0) | 0.54 |
HIV prevalence and bivariate associations, female sex workers in four urban areas of Namibia (Katima Mulilo, Oshikango, Swakopmund/Walvis Bay, and Windhoek), 2012–14
| Study city | Independent variable | Full multivariable model | Final multivariable model | ||
|---|---|---|---|---|---|
| AOR (95% CI) | p | AOR (95% CI) | p | ||
| Katima Mulilo | Age (per advancing year) | 1.20 (1.11–1.30) | <0.001 | 1.19 (1.12–1.27) | <0.001 |
| Currently not a student vs. currently a student | 2.94 (1.20–7.19) | 0.02 | 2.94 (1.12–7.19) | 0.02 | |
| Ever married vs. never married | 0.71 (0.23–2.16) | 0.54 | — | — | |
| First sex work age 15–19 years vs. <15 years | 0.92 (0.25–3.34) | 0.90 | — | — | |
| Client partners in 30 days (per additional four partners) | 1.57 (1.03–2.38) | 0.04 | 1.62 (1.06–2.46) | 0.03 | |
| Oshikango | Age (per advancing year) | 1.14 (1.04–1.24) | 0.005 | 1.13 (1.04–1.24) | 0.004 |
| Primary education or less vs. secondary or more | 3.71 (1.46–9.41) | 0.006 | 3.68 (1.44–9.39) | 0.007 | |
| Ever married vs. never married | 2.63 (0.72–9.57) | 0.14 | — | — | |
| Age at first sex work <15 years vs. 15+ years | 3.11 (040–24.05) | 0.28 | — | — | |
| Client partners in 30 days (per additional four partners) | 2.06 (1.31–3.22) | 0.002 | 1.98 (1.28–3.07) | 0.002 | |
| 1–3 non-commercial partners in 30 days vs. none | 4.56 (1.49–13.97) | 0.008 | 4.23 (1.42–12.64) | 0.01 | |
| Swakopmund/Walvis Bay | Age (per advancing year) | 1.09 (1.02–1.16) | 0.01 | 1.09 (1.02–1.18) | 0.01 |
| Primary education or less vs. secondary or more | 3.69 (1.54–8.84) | 0.004 | 3.77 (1.57–9.10) | 0.003 | |
| Unemployed at any time in last year vs. employed | 2.65 (1.22–5.77) | 0.01 | 2.85 (1.32–6.17) | 0.008 | |
| Age at first sex work <15 years vs. 15+ years | 2.31 (0.28–19.03) | 0.44 | — | — | |
| <10 Commercial partners last 30 days vs. 10+ | 2.46 (1.00–6.00) | 0.05 | 2.36 (1.01–5.53) | 0.05 | |
| Non-commercial partners last 30 days (per partner) | 1.12 (1.00–1.26) | 0.05 | 1.11 (1.00–1.24) | 0.05 | |
| Ever used any illicit drugs vs. never used | 0.44 (0.13–1.48) | 0.18 | — | — | |
| Windhoek | Age (per advancing year) | 1.08 (1.03–1.13) | 0.001 | 1.08 (1.03–1.13) | <0.001 |
| Primary education or less vs. secondary or more | 1.15 (0.53–2.53) | 0.72 | — | — | |
| Unemployed at any time in last year vs. employed | 2.24 (1.09–4.61) | 0.03 | 2.33 (1.33–4.81) | 0.02 | |
| Ever used any illicit drugs vs. never used | 2.14 (1.02–4.49) | 0.04 | 2.11 (1.00–4.46) | 0.05 | |
Independent associations with HIV infection among female sex workers in four urban areas of Namibia (Katima Mulilo, Oshikango, Swakopmund/Walvis Bay, and Windhoek), 2012–14
3.4. Testing and Treatment among HIV-positive FSW
Among the 487 HIV-positive FSW in all four study sites, 278 (57.1%) were aware of their HIV infection (i.e., previously identified), 172 (62.0%) ever received ART, and 164 (33.7%) were currently receiving ART (Figure 1). Among FSW who were aware of their HIV infection, 61.9% had initiated ART. Of those ever initiating ART, 95.3% were retained on ART.
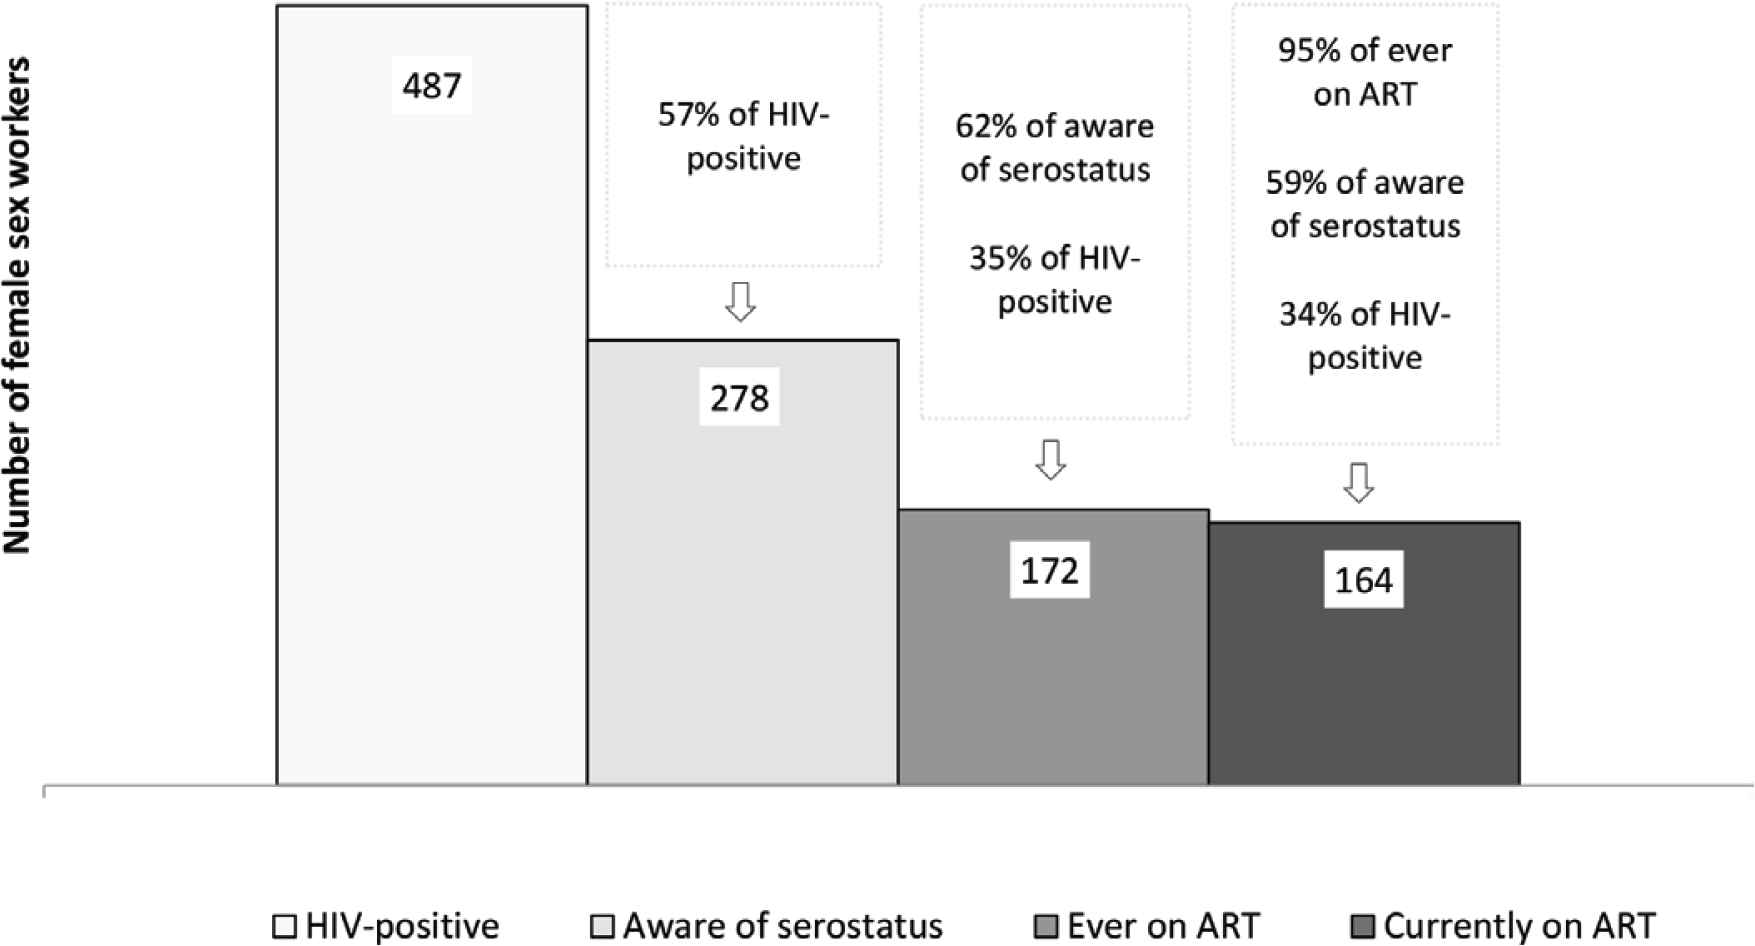
Pooled estimates of HIV testing and treatment among HIV-positive female sex workers in four urban areas of Namibia (Katima Mulilo, Oshikango, Swakopmund/Walvis Bay, and Windhoek), 2012–14.
4. DISCUSSION
This is the first study to measure HIV prevalence, risk factors for infection, and uptake of prevention, testing, and treatment in community-based samples of FSW in Namibia. These results can serve as a baseline to gauge the future impact of the HIV response for this key population. More than half of FSW in Katima Mulilo and approximately one-third of FSW in Oshikango, Swakopmund/Walvis Bay, and Windhoek were HIV-positive. Each of these estimates is far above the regional estimates for general population women in 2013 (30.9% in Zambezi, 22.1% in Ohangwena, 14.6% in Erongo, and 12.2% in Khomas) [20] and district level estimates for pregnant women in 2014 (36.0% in Katima Mulilo, 22.8% in Engela, 19.6% in Walvis Bay, and 19.6% in Katutura) [21]. Our estimates are also comparable to, although somewhat lower than, results from recent studies of FSW in other urban areas of southern Africa (59.6% in South Africa, 61.2% in Zimbabwe, and 70.7% in Malawi) [2]. Such findings may be interpreted that levels of HIV prevalence among FSW in Namibia may yet increase to levels observed in urban areas of surrounding countries. Consequently, if action to prioritize prevention and treatment among FSW in Namibia is not taken soon, prevention challenges will augment in the future.
Our analysis revealed significant correlates of HIV infection that highlight additional points for prevention interventions. HIV infection was significantly higher among FSW with more commercial sex partners. Coupled with the finding that most FSW had one or more non-commercial sex partners (e.g., spouse, steady boyfriend or casual partner), these results highlight the high potential for HIV acquisition and transmission between FSW, their commercials, and non-commercial sex partners. As such, prevention interventions like Treatment as Prevention (TasP) [22,23] and Pre-exposure Prophylaxis (PrEP) [24] are needed to address the sexual risks of all three of these groups. Independent of having multiple commercial or non-commercial sex partners, HIV prevalence was elevated in FSW who were unemployed, currently out of school, and who had completed a lower level of education. These findings suggest that livelihood interventions may help remove women from depending on sex work or at least mitigate the high rate of infection over time. The relentless progression of infection was also evident in that HIV prevalence increased with increasing age in all sites. Thus, primary prevention interventions need to reach to the youngest age groups in order to have the greatest impact on the burden of infection borne by FSW and on control of the epidemic in Namibia.
Condomless sex was common among FSW in our study, which likely increases the risk for HIV transmission between FSW and their sex partners [3,7]. Most FSW in our study reported that they used a condom during the most recent time they had sex with a commercial partner (site range: 82.1–91.1%) or non-commercial partner (site range: 87.0–94.2%), estimates that are higher than the percentage of general population who reported condom use with their last partner during the 2013 Namibia Demographic and Health Survey (NDHS) (67.5%) [20] and comparable to the estimated 85% of FSW who reported using a condom during their last sexual intercourse, as reported by a survey of capital cities in 85 countries in 2012 [25]. However, consistent condom use (i.e., 100%) with all partners during the last 30 days was much lower, especially for non-commercial partners. These results are consistent with recent studies from Ghana [26], Kenya [27], and the Democratic Republic of Congo [28], where condom use varied by partner type and tended to be lower among non-commercial partners. According to other studies, factors related to inconsistent condom use among FSW includes refusal by commercials, higher payment for not using condoms, erratic availability of condoms, and alcohol use [4,26–28], which was highly prevalent among FSW in our study.
Our results highlight the challenges of reaching key populations with HIV prevention interventions and services. Although many FSW were “reached by prevention programs” according to the GAPR definition [15], levels varied by study site. That prevention program reach was lowest in Katima Mulilo - the health district of Namibia with the highest HIV prevalence in the 2013 NDHS [20], HIV sentinel surveillance surveys [21], and the more recent NAMPHIA population-based impact assessment [29] – is cause for alarm. More than half of FSW in Katima Mulilo were infected. The vast majority of FSW in our study, in all four cities, did not receive HIV-related outreach from a peer or community member, an approach that may help improve utilization of prevention and services among FSW [27]. This suggests that FSW-focused organizations and their partners should enhance efforts to deliver peer outreach and bring services like HIV counseling and testing to community-based settings.
Our estimates of serostatus awareness and ART among HIV-positive FSW indicate that this key population is lagging far behind the UNAIDS targets for achieving epidemic transition [30]. Only 56.9–64.4% of HIV infected FSW in our survey were aware of their HIV serostatus. These results are comparable to those from the 2014 Global AIDS Progress Report, where a median of 65% of sex workers from 35 sub-Saharan African countries were aware of their serostatus [31], but substantially lower than the 89.5% of general population HIV-positive women in Namibia, as measured in a population-based survey 3 years after our survey [29]. Through viral suppression, ART can prevent onward transmission from people living with HIV to their sex partners [22,23]. Thus, with only three in five HIV-positive FSW in our survey currently on ART, the potential for onward transmission of infection to HIV-negative sex partners of FSW is high. Once diagnosed, treatment coverage among HIV-positive FSW in our survey was relatively high. In particular, greater than 95% of those who ever received ART were sustained on ART. These estimates closely approximate those for the general population of women in Namibia [27]. Thus, FSW-friendly programs to promote more frequent testing and linkage to ART could have far-reaching implications for reducing HIV transmission in Namibia. It should be noted that our results were obtained under pre-“Treat All” guidelines and, as such, were more restrictive in terms of ART eligibility. More restrictive eligibility criteria would have led to lower ART coverage than expected under current “Treat All” guidelines and as reflected in the 2017 population-based estimates for Namibia [29]. Nonetheless, a follow-up survey is needed to see if the apparent disparity serostatus awareness and ART among HIV-positive FSW and general population is widening or closing, and whether ART coverage is also associated with viral load suppression.
5. LIMITATIONS
We recognize errors and potential biases that may affect interpretation of our results. Although RDS surveys are held to approximate probability-based data, it is possible that certain groups of FSW were not reached. While we included four cities likely to have large numbers of sex workers, we cannot guarantee that they are representative of all of Namibia. Finally, as is the case for surveys of this type, key measures rely on self-report and may be subject to social desirability response bias.
6. CONCLUSION
Programs that are able to reach FSW with effective prevention interventions stand to avert many new infections among FSW and their commercial and non-commercial sex partners. Effective biological interventions, such as TaSP and PrEP, may be most cost-effective when prioritized for FSW. Success in implementing these recommendations and their impact on the HIV epidemic among FSW in Namibia can be measured in future rounds of bio-behavioral surveillance. Accordingly, we envision that future surveys like ours will play an important role in demonstrating Namibia’s success in achieving epidemic control and transition, and that FSW have not been left behind.
CONFLICTS OF INTEREST
The authors declare they have no conflicts of interest.
AUTHORS’ CONTRIBUTION
SP, WM, AJ and DL designed the study. AM and KG managed implementation. BK, TN, EK, NM, KB, AN and DB collected and managed the data. NMdP, AM, KB, BK and TN analyzed the data. All authors contributed to writing and reviewing the manuscript.
FUNDING
This research has been supported by the
ACKNOWLEDGMENTS
The investigators thank and acknowledge the dedication of the survey staff during the planning and implementation of this study and the women who participated in the survey for their time and interest.
ABBREVIATIONS
- HIV,
human immunodeficiency virus;
- FSW,
female sex workers;
- ART,
antiretroviral treatment;
- RDS,
respondent driven sampling;
- GAPR,
Global AIDS Response Progress Reporting;
- AOR,
adjusted odds ratios;
- TasP,
treatment as prevention;
- PrEP,
pre-exposure prophylaxis;
- NDHS,
Namibia Demographic and Health Survey.
Footnotes
Data availability statement: The data that support the findings of this study are available upon reasonable request to the Research Ethics Committee of the Ministry of Health and Social Services of Namibia. Request can be submitted to the study co-author, Mr. Nicholus Mutenda [mutendan@nacop.net], Chief Control of Health Programs, Response Monitoring and Evaluation Subdivision, Directorate for Special Programs, Ministry of Health and Social Services of Namibia.
REFERENCES
Cite this article
TY  - JOUR
AU  - Anna Jonas
AU  - Sadhna V. Patel
AU  - Frieda Katuta
AU  - Andrew D. Maher
AU  - Karen M. Banda
AU  - Krysta Gerndt
AU  - Ismelda Pietersen
AU  - Neia Menezes de Prata
AU  - Nicholus Mutenda
AU  - Tuli Nakanyala
AU  - Esme Kisting
AU  - Brown Kawana
AU  - Ann-Marie Nietschke
AU  - Dimitri Prybylski
AU  - Willi McFarland
AU  - David W. Lowrance
PY  - 2020
DA  - 2020/06/19
TI  - HIV Prevalence, Risk Factors for Infection, and Uptake of Prevention, Testing, and Treatment among Female Sex Workers in Namibia
JO  - Journal of Epidemiology and Global Health
SP  - 351
EP  - 358
VL  - 10
IS  - 4
SN  - 2210-6014
UR  - https://doi.org/10.2991/jegh.k.200603.001
DO  - 10.2991/jegh.k.200603.001
ID  - Jonas2020
ER  -