
Role of Ascertainment Bias in Determining Case Fatality Rate of COVID-19

- DOI
- 10.2991/jegh.k.210401.001How to use a DOI?
- Keywords
- Epidemiology; health policy; ascertainment bias; Global health; bias; epidemiologic methods; Africa; Asia; Europe; North America; South America; virus; COVID-19; SARS-COV-2; log-log linear regression; log slope
- Abstract
Case fatality rate (CFR) is used to calculate mortality burden of COVID-19 under different scenarios, thus informing risk-benefit balance of interventions both pharmaceutical and nonpharmaceutical. However, observed CFR is driven by testing: as more low-risk cases are identified, observed CFR will decline. This report quantifies test bias by modeling observed CFR as log-log-linear function of test density (tests per population) in 163 countries. CFR declined almost 20% (e.g. from 5% to 4%) for each doubling of test density (p < 0.0001); this association did not vary by continent (interaction p > 0.10) although at any given test density CFR was higher in Europe or North America than in Asia or Africa. This effect of test density on observed CFR is adequate to hide all but the largest true differences in case survivorship. Published estimates of CFR should specify test density, and comparisons should correct for it such as by applying the provided model.
- Copyright
- © 2021 The Author. Published by Atlantis Press International B.V.
- Open Access
- This is an open access article distributed under the CC BY-NC 4.0 license (http://creativecommons.org/licenses/by-nc/4.0/).
1. INTRODUCTION
Case Fatality Rate (CFR) is used to calculate mortality burden of COVID-19 under different scenarios and, thus, to inform the risk-benefit balance of interventions. These risks range from the financial (e.g. job loss) to the medical (e.g. missed prenatal care [1]) or even the emotional (e.g. impaired mood homeostasis during lockdown) [2]. Accurate estimates of CFR are thus essential to allow policymakers to balance risks against benefits.
However, observed CFR is driven by availability of testing. If tests are reserved for individuals at high risk of complications, many low-risk cases will be missed. Since asymptomatic or less-symptomatic cases often outnumber those with severe symptoms [3], observed CFR is likely to be inflated. Indeed, seroprevalence data [4] suggest that CFR in the US is usually below 1% and often below 0.50%, far below the 9.7% currently reported [5]. However, the seroprevalence study did not distinguish active cases of COVID-19 from recovered ones and thus missed any deaths that occurred after testing. Thus, true CFR of resolved cases of COVID-19 is unknown.
While ascertainment bias cannot be eliminated, its association with observed CFR can be quantified. This report does so by establishing the shape of the association between observed CFR and geography-level test density, and using this model to suggest a plausible range for the true CFR of COVID-19.
2. MATERIALS AND METHODS
2.1. Study Design and Data Collection
Using the software SAS (Cary, NC), I estimate associations between observed CFR in resolved cases of COVID-19, and test density, in every geography for which data were available and at least one death had occurred, from a publicly-available real-time counter [5] for July 3, 2020.
2.2. Data Availability
All data are publicly available.
2.3. Data Analysis
I calculate linear associations between CFR (ratio between total deaths and total resolved cases) and test density per million residents, weighted by total cases. CFR, test density, and total cases were each approximately log-normally distributed and thus were log-transformed for normality. Locally-weighted regression was used to estimate the shape of the association, identify any inflection points, and choose a statistical model.
Based on the observed shape of the association, a regression was run predicting CFR from test density. Exploratory analyses examined both confounding and effect modification by continent (Africa, Asia, Europe, North America, South America, and Oceania). Backward selection at p = 0.10 was used to create the final model.
3. RESULTS
In countries with complete data (n = 163) median CFR was 4.08% (25th and 75th percentiles, 2.13–6.93) Median CFR by continent ranged from 1.43 (Oceania) to 8.18 (North America). Median test density was 24,115 tests per million residents (25th and 75th percentiles, 6194–64,227).
Median CFR in the bottom quartile of test density was 5.36%; this dropped to 4.04% in the middle half, and 2.92 in the top quartile.
For each doubling of test density, CFR dropped by almost 20% (p < 0.0001, Table 1). The decline was near-linear on the log–log scale. For a given test density, CFR varied between continents by a factor of up to 3.9 (Asia vs. Europe; Table 1 and Figure 1) but its association with test density did not (p for interaction >0.10).
| Parameter estimate | 95% confidence interval | p | ||
|---|---|---|---|---|
| Bottom | Top | |||
| Intercepta | 41.4 | 16.9 | 101 | <0.0001 |
| Test density, doubling | 0.805 | 0.758 | 0.854 | <0.0001 |
| Continentb | <0.0001 | |||
| Africa | 1.033 | 0.696 | 1.533 | 0.87 |
| Asia | 1 (reference) | 1 | 1 | – |
| Europe | 3.936 | 2.753 | 5.628 | <0.0001 |
| North America | 3.427 | 2.236 | 5.252 | <0.0001 |
| Oceania | 1.244 | 0.375 | 4.125 | 0.72 |
| South America | 2.366 | 1.458 | 3.838 | 0.0005 |
| Interaction: test density * continent | (removed) | 0.26 | ||
Intercept corresponds to a test density of one test per million inhabitants.
p-values in the top row are for the global null (all continents equal). Those for each continent are pairwise comparison with the reference (Asia).
Model fit using log–log regression and shown in Figure 1. Parameter estimates have been reverse-transformed for interpretability and are multiplicative, not additive.
Case fatality rate of COVID-19 declines with test density R2 = 0.40
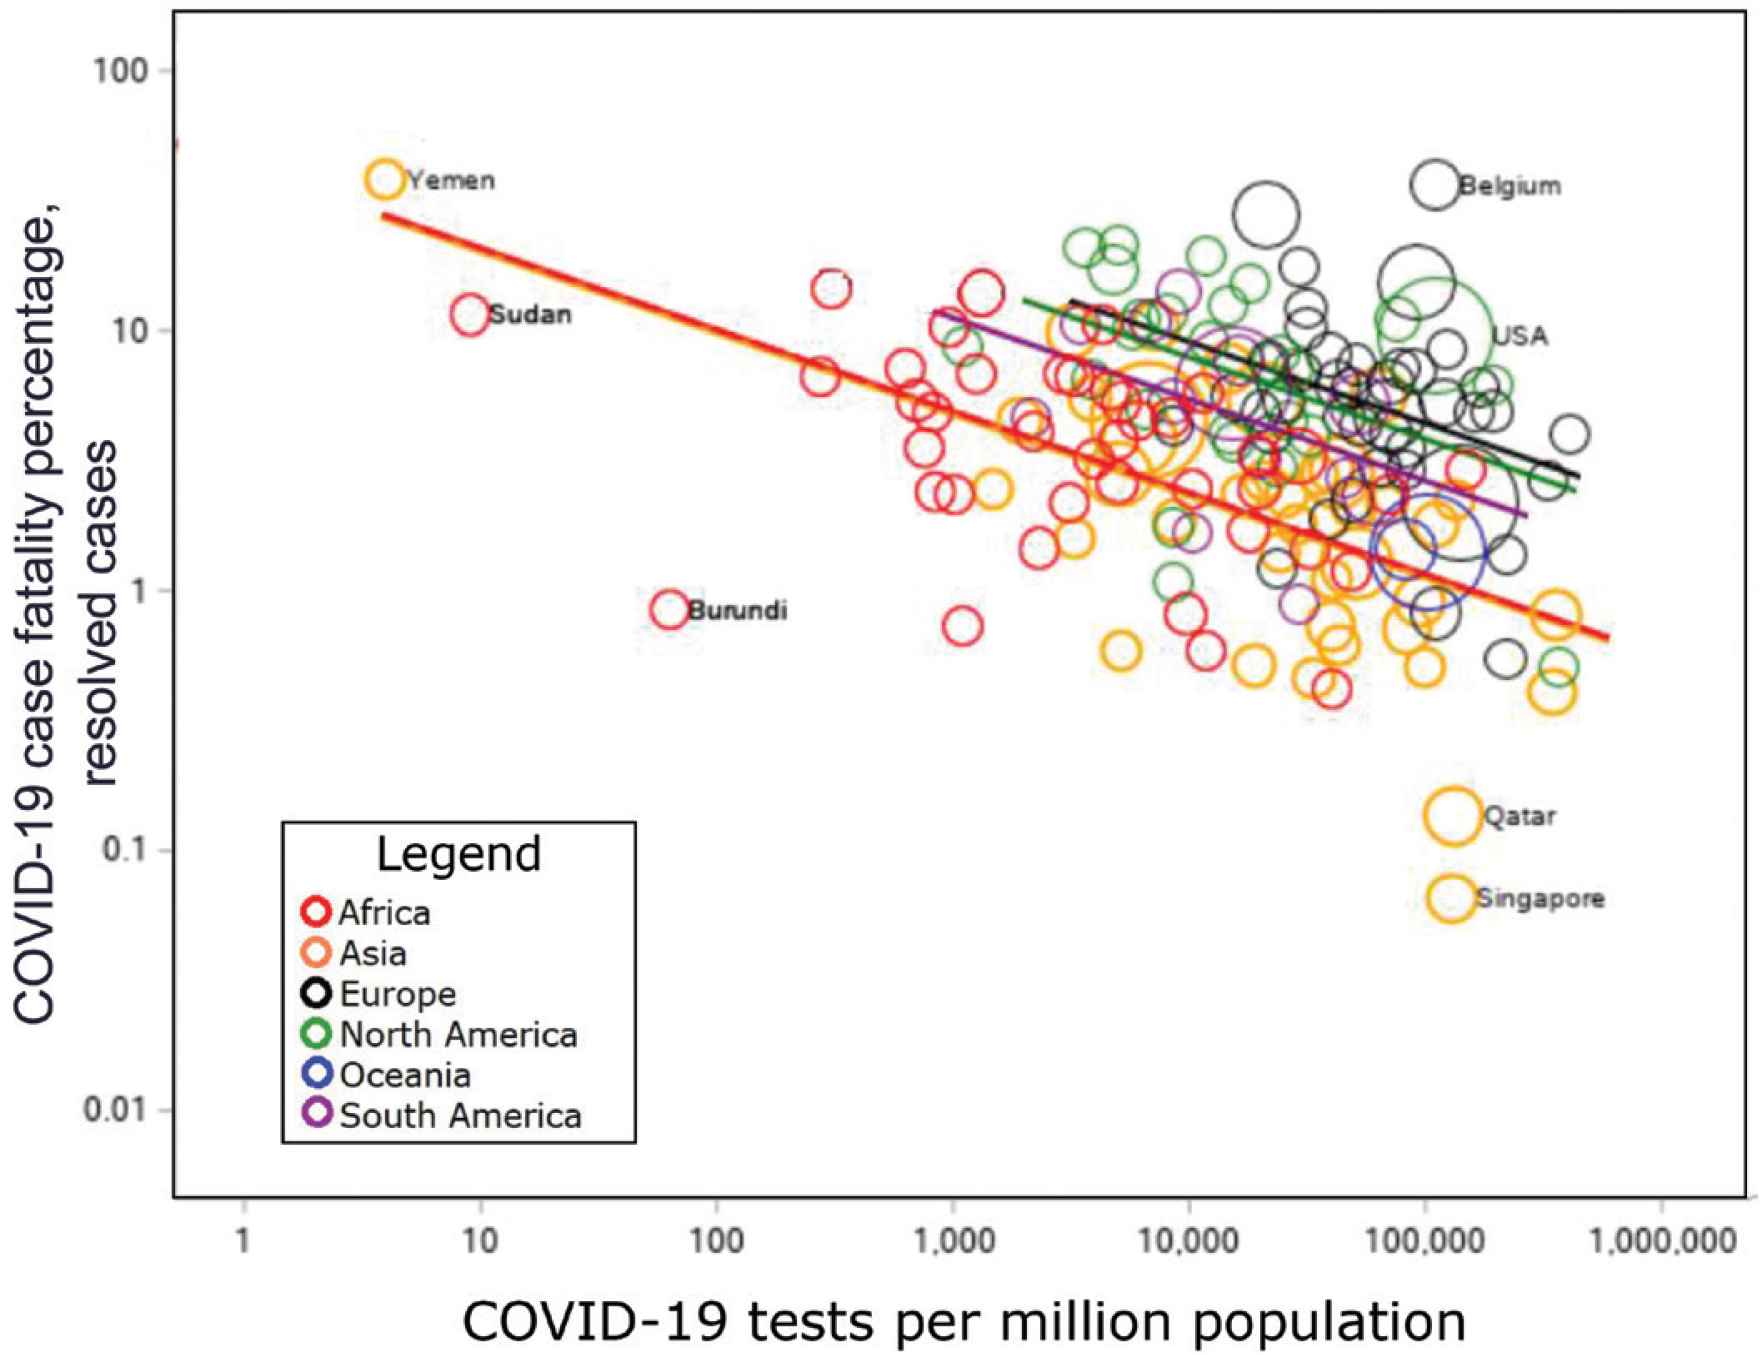
Case fatality rate of COVID-19 declines with test density. Least-squares regression lines shown. Bubble size for each location corresponds to total cases. Selected points are labeled.
In the model containing an interaction between test density and continent, the estimated effect of test density was nonsignificantly stronger than that in the simple model presented here. (0.739 vs. 0.805). However, the interaction term was not statistically significant; and in this model the main effect of continent also lost significance, and most slope estimates were extreme and unstable. Thus the interaction was dropped in the final model.
The final model yielded the following regression equation:
For a test density of 4096 (212) tests per million people, the model predicts the following CFR for Africa:
For the same test density, the model predicts for Europe:
If test density were to increase to 1,048,576 tests per million people (220; just over one per person) the predicted CFR for Europe would be 2.13%, and that for Africa would be 0.56%.
4. DISCUSSION
Observed CFR of COVID-19 declines with increasing test density, suggesting ascertainment bias. Published estimates of CFR, and thus of total mortality burden in different scenarios, may be too high. At a density of one test per person, this model predicts that CFRs will average about 0.5% in Asia and Africa and 2% in North America and Europe: higher than that estimated by Ioanniddis et al. [4] in the USA from seroprevalence but below most values in the current dataset.
As test density increases and re-testing becomes common, the decline in CFR with each additional test will likely plateau. However, no such plateau occurred within the range of these data. Based on this model, we suggest that saturation has not been reached and CFR may continue to decline. As testing becomes more available, many mild cases of COVID-19 will be found.
However, increases in testing may also reveal serious cases who did not have symptoms previously associated with COVID-19. Although initial screening focused on those with respiratory symptoms, COVID-19 is now being shown to have potentially severe cardiovascular effects such as thromboembolism [6]. Those who died of these symptoms, such as by myocardial infarction or stroke, may not be recognized as COVID-19 cases, and thus CFR will be underestimated.
5. PUBLIC HEALTH IMPLICATIONS
Bias in estimated CFR will prevent accurate balancing of the risks and benefits of proposed interventions. This study suggests a true CFR between 0.5% and 2% for test densities not too far outside the range of our data. Bias can be minimized by combining the presented model with universal postmortem testing.
CONFLICTS OF INTEREST
The author declares no conflicts of interest.
REFERENCES
Cite this article
TY  - JOUR
AU  - Maia P. Smith
PY  - 2021
DA  - 2021/04/08
TI  - Role of Ascertainment Bias in Determining Case Fatality Rate of COVID-19
JO  - Journal of Epidemiology and Global Health
SP  - 143
EP  - 145
VL  - 11
IS  - 2
SN  - 2210-6014
UR  - https://doi.org/10.2991/jegh.k.210401.001
DO  - 10.2991/jegh.k.210401.001
ID  - Smith2021
ER  -