
Factors Associated with the Incidence and Mortality of Coronavirus Disease 2019 (COVID-19) after 126-million Cases: A Meta-analysis
 , Kullaya Takkavatakarn1, †, Pisut Katavetin1, Thanin Asawavichienjinda2, , Kriang Tungsanga1, , Kearkiat Praditpornsilpa1, Somchai Eiam-Ong1, Paweena Susantitaphong1, 3, *
Both JP and KuT contribute equally as first co-author in this work.
- DOI
- 10.2991/jegh.k.210527.001How to use a DOI?
- Keywords
- Coronavirus disease-19; pandemics; epidemiology; mortality; incidence; health system
- Abstract
Objectives: This meta-analysis was conducted to investigate the current global incidence and mortality of COVID-19 and also explored the associated factors including geographic variations, transmission scenarios, country economic status, and healthcare performance.
Methods: The search was conducted in online databases based on reports from national authorities by March 28, 2021. Random-effects model meta-analyses and meta-regression analyses were used to generate summary estimates and explored sources of heterogeneity.
Results: The cumulative number of confirmed COVID-19 cases was 125,704,789 reported by 216 countries. The pooled Daily Cumulative Index (DCI) was 1423.87 cases/day which was highest in South America (2759.15 cases/day) followed by North America (2252.49 cases/day), Europe (1858.44 cases/day), Asia (1484.84 cases/day), Africa (193.09 cases/day), and Australia/Oceania (18.55 cases/day). The overall pooled mortality rate of COVID-19 was 1.53%. Higher income countries and countries with community transmission had higher DCI. By meta-regression, country total health expenditure per capita, percentage of universal health coverage, and total number of tests were associated with higher DCI. On the contrary, country Gross Domestic Product (GDP) per capita were negatively correlated with mortality rate.
Conclusion: To date, 216 countries around the world are affected by COVID-19. Higher income, GDP, and countries’ investments on heath are associated with higher DCI while higher GDP correlates with lower mortality. Community transmission route have more impact on the incidence and mortality of COVID-19.
- Copyright
- © 2021 The Authors. Published by Atlantis Press International B.V.
- Open Access
- This is an open access article distributed under the CC BY-NC 4.0 license (http://creativecommons.org/licenses/by-nc/4.0/).
1. INTRODUCTION
Starting in Wuhan China since December 2019, the emergence of Coronavirus Disease-2019 (COVID-19), caused by the severe acute respiratory syndrome coronavirus 2, rapidly spreads across the world and has become the deadliest pandemic of this decade [1,2]. To date, COVID-19 has affected over 126 millions of people and caused almost 3 million deaths [3]. Due to its accelerated rates of infection, healthcare resources have been expensed, resulting in shortage of supply in certain areas. COVID-19 has not only affected wellness of people and healthcare systems but has also impacted on the global economics and caused tremendous social crises [4].
In order to control the infection and keep national economic systems running, various governmental measures have been implemented in each country such as wearing mask, handwashing, social distancing, working from home, state quarantine, digital contact tracing, curfew, and lockdown. Now, approximately 15 months after the initial outbreak, data showed different incidences and mortality rates in each country. These discrepancies of outcomes might result from varieties of background, resources of healthcare systems, and governmental policy to contain disease spreading and prevent further deaths.
The present meta-analysis was conducted to investigate the current global incidence and mortality of COVID-19 and to describe geographic variations according to regions, economic status, and transmission scenarios (sporadic cases, cluster of cases, and community transmission). Of more importance, we investigated the factors associated with the incidence and mortality of COVID-19, including regions; economic status, such as the country income and Gross Domestic Product (GDP); current health expenditure; and healthcare performance.
2. MATERIALS AND METHODS
2.1. Data Sources and Selection
Among the ongoing outbreak of COVID-19, the complete published information has not yet been fully addressed. Therefore, we performed a search in the online database and reported the most recent number of COVID-19 cases and deaths. The search was conducted in the following open online databases: World Health Organization (WHO) dashboard [3], Our World in Data.com [5], and the European Center of Disease Control and Prevention [6] which were based on reports from national authorities by 10:00 CEST, March 28, 2021. Additional data from Taiwan, which were not included in WHO database, were also retrieved on the same day.
All data were retrieved from open online databases on March 28, 2021. All sources were informed for permission to publish prior to submission.
2.2. Data Extraction
The data were extracted by two authors (JP and KuT). Disagreements were resolved through consensus by the third author (PS). Data extraction included cumulative incidence, Daily Cumulative Index (DCI), day since first case, mortality rate of COVID-19, and transmission scenario of each country. According to WHO, the transmission scenario was classified into three groups as follows: (1) Sporadic cases (with one or more cases, imported or locally detected), (2) Clusters of cases (experiencing cases, clustered in time, geographic location and/or by common exposures), and (3) Community transmission (experiencing larger outbreaks of local transmission defined through an assessment of factors including, but not limited to: large numbers of cases not linkable to transmission chains; large numbers of cases from sentinel lab surveillance; and/or multiple unrelated clusters in several areas of the country/territory/area) [3].
Countries were grouped by geographic continents defined by United Nations Statistics Division [7]. Economic status among countries was assessed according to four ranges of gross national income per capita derived from the World Bank’s classification of income of economies [8] [low (≤US$1005), lower-middle (US$1006–$3975), upper-middle (US$3976–$12,275), and high (≥US$12,276) income countries], GDP ($), and GDP per capita ($). We also explored the characteristics of healthcare systems in each country by using the World Bank’s healthcare-associated development indicators [9], including current health expenditure (% of GDP), health expenditure per capita ($), universal health coverage service index (scale 0–100%), total life expectancy at birth (years), availability of basic handwashing facilities with soap and water (% of population), number of hospital beds (per 100,000 people), and critical care beds (per 1000 people). For each of these indicators, we used the latest report from the WHO and World Bank ranged from 2017 to 2018 [3,8,9].
2.3. Data Synthesis and Statistical Analyses
The total numbers of confirmed COVID-19 cases were corrected by number of population in each region (per 1000 population) while the mortality rate was reported as percentage calculated by total number of deaths from COVID-19 divided by total number of cases [10]. DCI was defined as the total number of confirmed cases divided by days after the first case reported in each country. Random-effects model meta-analyses were conducted to generate pooled DCI, and mortality rates of COVID-19. All pooled estimates are provided with 95% Confidence Intervals (95% CIs). Heterogeneity was assessed using the I2 index and the Q-test p-value.
To examine the global pattern of COVID-19, we conducted subgroup analysis on DCI and mortality rates by regions, World Bank’s classification of income of economies, and transmission scenario. We performed meta-regression analyses to explore the association of day since first case reported, GDP per capita ($), health expenditure per capita ($), universal health coverage service index (scale 0–100%), total life expectancy at birth (years), availability of basic handwashing facilities with soap and water (% of population), number of hospital beds (per 100,000 people), and critical care beds (per 1000 people) with DCI and mortality outcomes of COVID-19. The analyses were performed using the Comprehensive Meta-Analysis software version 2.0 (www.meta-analysis.com; Biostat, Englewood, NJ, USA).
3. RESULTS
3.1. Study Characteristics
A total of 216 countries and dependent territories were included in this meta-analysis. Fifty-six countries/territories were from Africa, 46 from Asia, 51 from Europe, 36 from North America, 19 from South America, and eight from Australia and Oceania. Countries and dependent territories were classified as high-income (74 countries/territories), upper middle income (52 countries/territories), lower middle income (42 countries/territories), low income (30 countries/territories), and no available data (18 countries/territories). Most countries (74.8%) spent ≥5% of GDP on total health expenditure.
3.2. The Global Incidence of COVID-19
The cumulative number of COVID-19 confirmed cases was 125,704,789 on March 28, 2021. When corrected with population, there were 16.22 cases per 1000 population globally, highest in North America (58.37 cases per 1000), followed by Europe (51.89 cases per 1000), South America (47.45 cases per 1000), Asia (6.03 cases per 1000), Africa (3.11 cases per 1000), and Australia/Oceania (1.54 cases per 1000) (Figure 1).
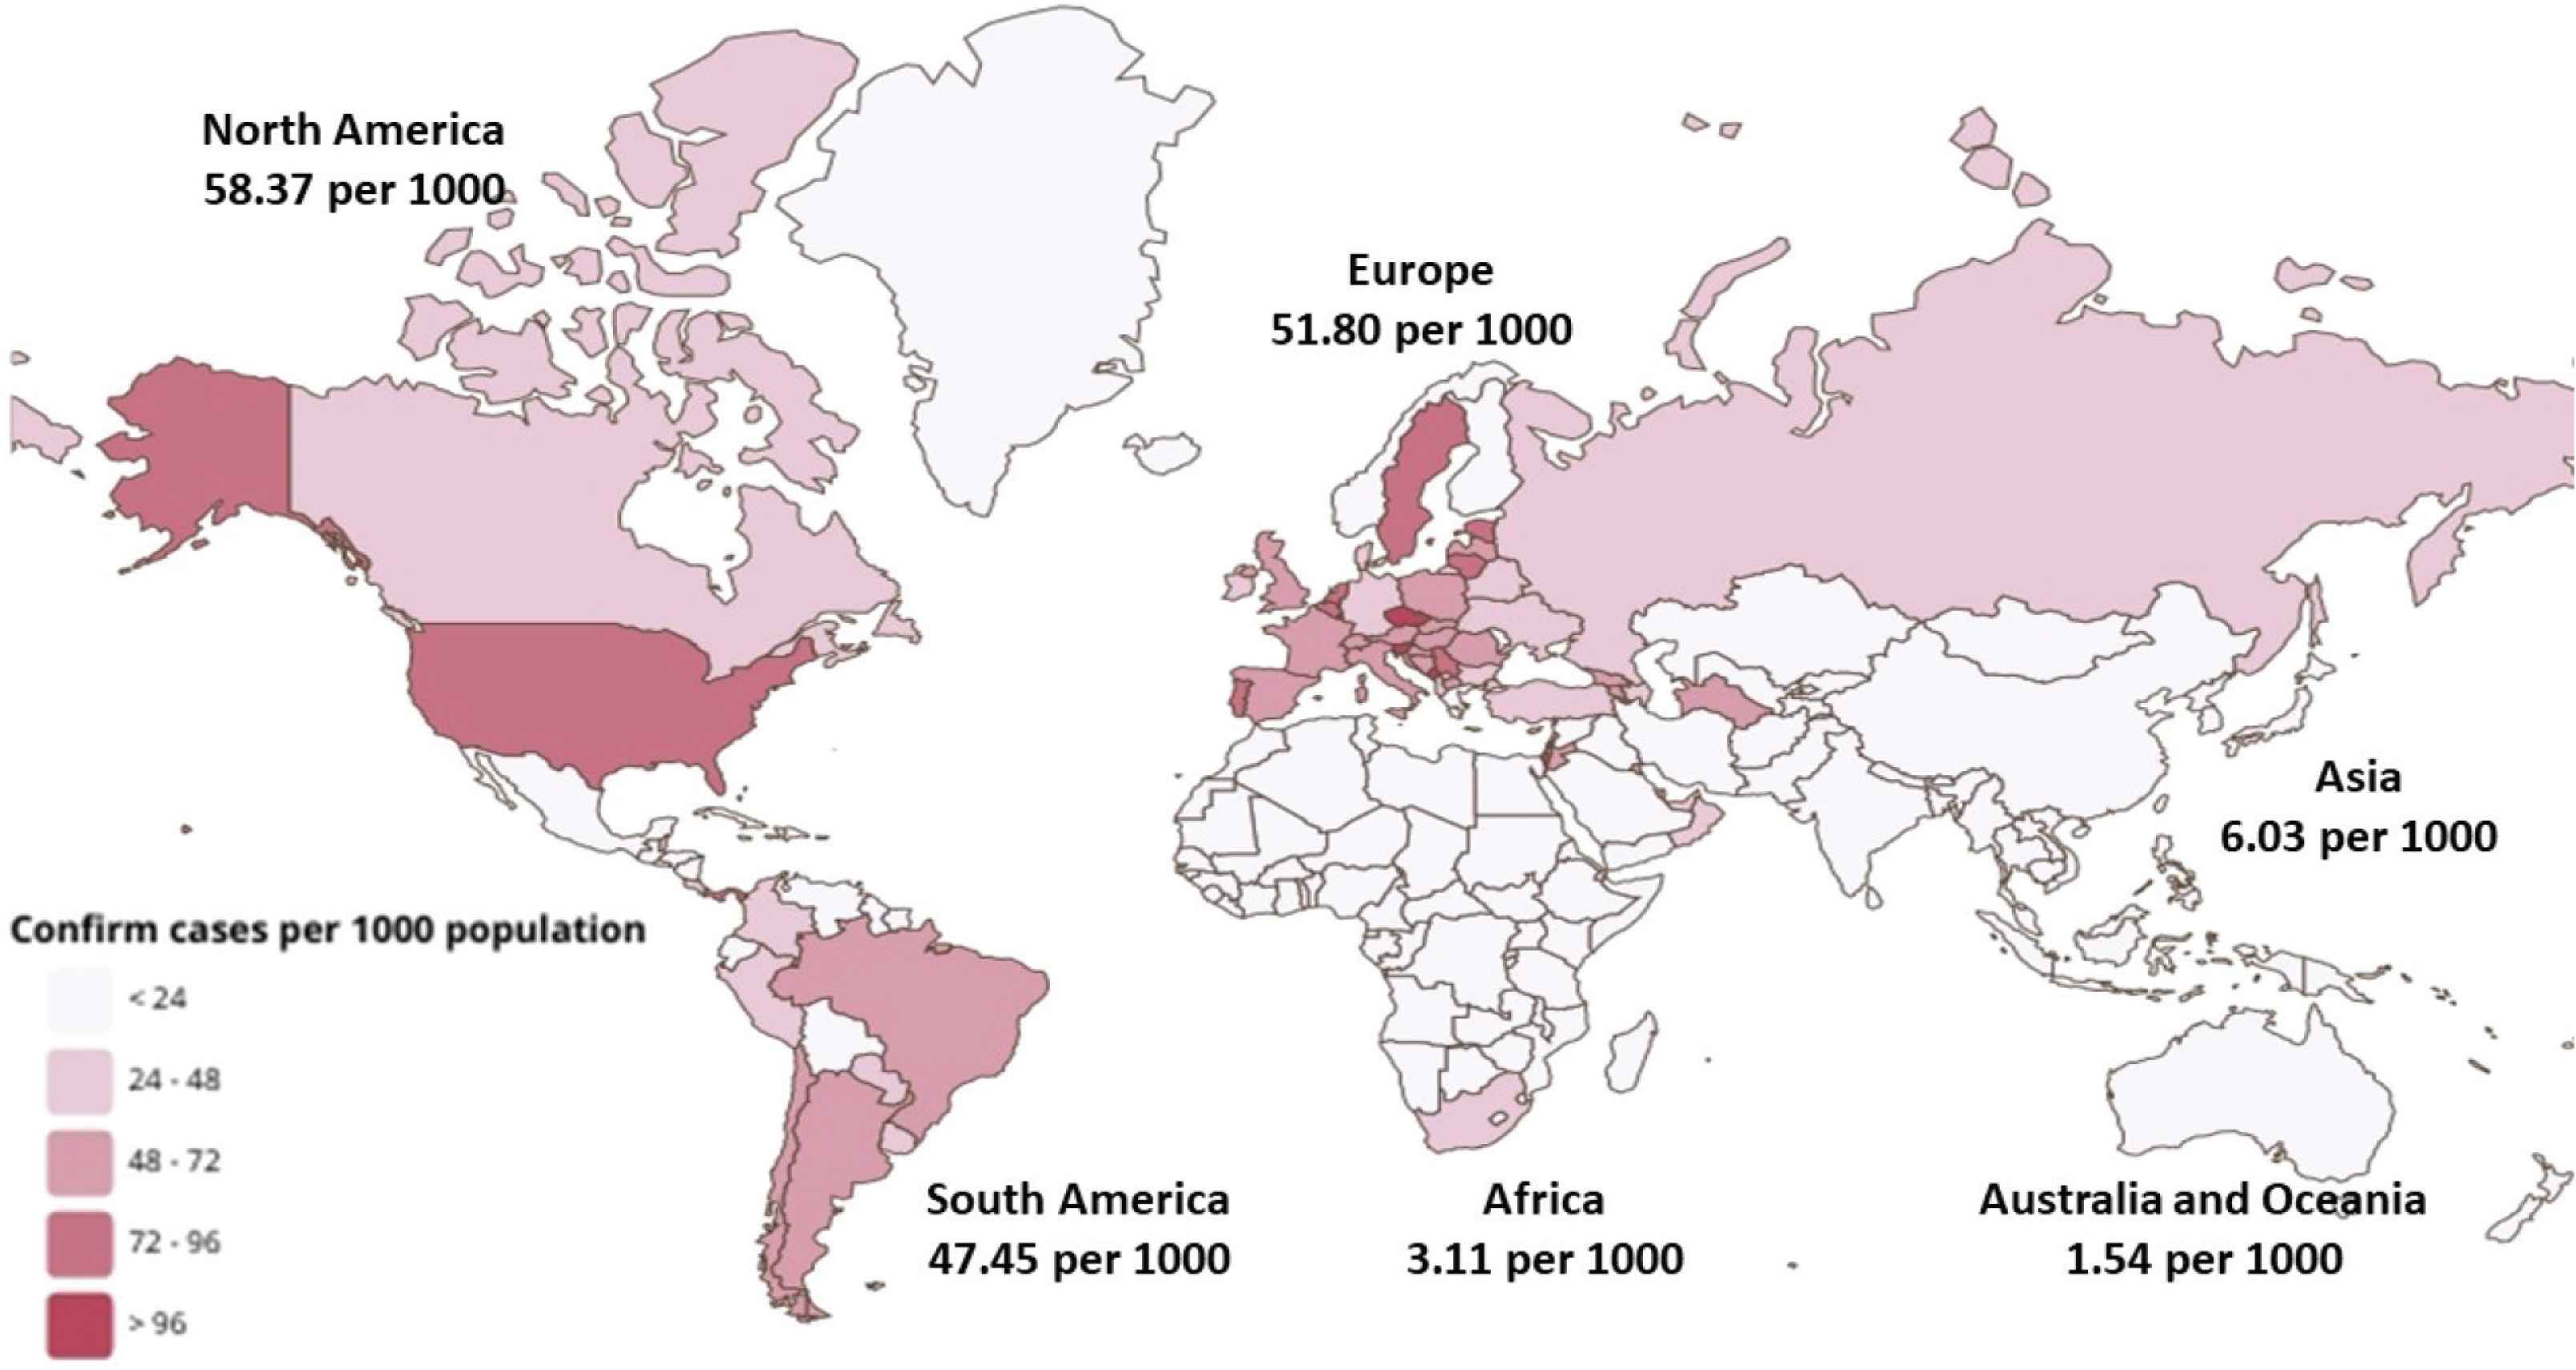
Pooled incidence of COVID-19 by world zone.
3.3. The Global Pooled Daily Cumulative Index
By meta-analysis, the global pooled DCI of COVID-19 from 216 countries was 1423.87 cases/day (95% CI 1331.41–1516.33). The DCI was most remarkable in South America (2759.15 cases/day), followed by North America (2252.49 cases/day), Europe (1858.44 cases/day), Asia (1484.84 cases/day), Africa (193.09 cases/day), and Australia and Oceania (18.55 cases/day) (Table 1).
| Countries (no.) | Pooled DCI (cases/day) | 95% confidence interval | Test for heterogeneity | ||
|---|---|---|---|---|---|
| I2 Index | Q-test (p-value) | ||||
| Overall | 216 | 1423.87 | 1331.41–1516.33 | 100 | <0.001 |
| Continent | |||||
| Africa | 56 | 193.09 | 166.71–219.48 | 99.99 | <0.001 |
| Asia | 46 | 1484.84 | 1249.68–1720.00 | 100 | <0.001 |
| Europe | 51 | 1858.44 | 1061.04–2655.83 | 99.99 | <0.001 |
| North America | 36 | 2252.49 | 1341.65–3163.32 | 100 | <0.001 |
| Australia and Oceania | 8 | 18.55 | 4.53–32.58 | 99.59 | <0.001 |
| South America | 19 | 2759.15 | 1296.67–4221.64 | 100 | <0.001 |
| Country income classification | |||||
| High income | 74 | 2096.05 | 1565.92–2626.17 | 100 | <0.001 |
| Upper middle income | 52 | 1938.32 | 1648.82–2227.83 | 100 | <0.001 |
| Lower middle income | 42 | 1168.91 | 867.43–1470.38 | 100 | <0.001 |
| Low income | 30 | 77.68 | 56.77–98.60 | 99.97 | <0.001 |
| Not available | 18 | 6.17 | 2.79–9.54 | 96.46 | <0.001 |
| Transmission scenario | |||||
| Sporadic cases | 19 | 71.52 | 51.08–91.97 | 99.96 | <0.001 |
| Cluster of cases | 52 | 1166.33 | 774.38–1558.27 | 100 | <0.001 |
| Community transmission | 138 | 1779.16 | 1614.73–1943.60 | 100 | <0.001 |
| Not available | 7 | 7.56 | 3.04–12.08 | 98.57 | <0.001 |
Pooled Daily Cumulative Index (DCI) of COVID-19
3.4. The Global Pooled Mortality of COVID-19
The cumulative number of deaths was 2,758,545 on March 28, 2021. By meta-analysis, using data from 216 countries and dependent territories, the overall pooled mortality rate of COVID-19 was 1.53% (95% CI 1.43–1.65). The pooled mortality rate was highest in South America (2.15%; 95% CI 1.88–2.46), followed by Europe (1.76%; 95% CI 1.64–1.90), Africa (1.71%; 95% CI 1.48–1.97), North America (1.49%; 95% CI 1.03–2.14), Australia and Oceania (1.38%; 95% CI 0.77–2.48), and Asia (1.10%; 95% CI 0.94–1.29) (Table 2).
| Countries (no.) | Deaths (no.) | Pooled mortality rate (%) | 95% confidence interval | Test for heterogeneity | ||
|---|---|---|---|---|---|---|
| I2 Index | Q-test (p-value) | |||||
| Overall | 206 | 2,758,545 | 1.53 | 1.43–1.65 | 99.97 | <0.001 |
| Continent | ||||||
| Africa | 56 | 111223 | 1.71 | 1.48–1.97 | 99.76 | <0.001 |
| Asia | 46 | 422589 | 1.10 | 0.94–1.29 | 99.95 | <0.001 |
| Europe | 51 | 898738 | 1.76 | 1.64–1.90 | 99.91 | <0.001 |
| North America | 36 | 794778 | 1.49 | 1.03–2.14 | 99.99 | <0.001 |
| Australia and Oceania | 8 | 1259 | 1.38 | 0.77–2.48 | 97.86 | <0.001 |
| South America | 19 | 529958 | 2.15 | 1.88–2.46 | 99.91 | <0.001 |
| Country income classification | ||||||
| High income | 74 | 1333636 | 1.35 | 1.26–1.45 | 99.92 | <0.001 |
| Upper middle income | 52 | 1062428 | 1.60 | 1.33–1.91 | 99.99 | <0.001 |
| Lower middle income | 42 | 344065 | 1.76 | 1.51–2.06 | 99.93 | <0.001 |
| Low income | 30 | 16494 | 1.89 | 1.38–2.57 | 99.73 | <0.001 |
| Not available | 18 | 1922 | 0.86 | 0.58–1.30 | 79.23 | <0.001 |
| Transmission scenario | ||||||
| Sporadic cases | 19 | 9386 | 0.87 | 0.56–1.35 | 99.21 | <0.001 |
| Cluster of cases | 52 | 469827 | 1.27 | 1.10–1.47 | 99.94 | <0.001 |
| Community transmission | 138 | 2279202 | 1.70 | 1.56–1.86 | 99.98 | <0.001 |
| Not available | 7 | 16532 | 1.22 | 0.69–2.17 | 75.47 | <0.001 |
Pooled mortality rate of COVID-19
3.5. Factors Associated DCI and Mortality Rate of COVID-19
3.5.1. By subgroup analysis on DCI of COVID-19
The pooled DCI of COVID-19 was highest in the high income countries (2096.05 cases/day), followed by upper-middle, lower middle, and low income countries (Table 1). The pooled DCI was greatest in the community transmission (1779.16 cases/day), followed by the cluster of cases (1166.33 cases/day), and the sporadic cases (71.52 cases/day) (Table 1).
3.5.2. By subgroup analysis on mortality rate of COVID-19
The greatest pooled mortality rate was observed in the low-income countries (1.89%). The pooled mortality rates in the high, upper-middle, and low-middle income countries were 1.35%, 1.60%, and 1.76%, respectively (Table 2).
Regarding the transmission scenario, the pooled mortality rate of COVID-19 was highest in the community transmission (1.70%; 95% CI 1.56–1.86), followed by the cluster of cases (1.27%; 95% CI 1.10–1.47), and the sporadic cases showed the lowest mortality rate (0.87%; 95% CI 0.56–1.35) (Table 2).
3.5.3. By meta-regression analysis
As illustrated in Table 3, number of days since first case reported and total population were positively associated with DCI. Country total health expenditure per capita, universal health coverage, and total number of COVID-19 tests were also correlated with higher DCI.
| Rate change (%) | 95% confidence interval | p-value | |
|---|---|---|---|
| Daily cumulative index | |||
| Day since first case (day) | 0.055 | 0.051–0.058 | <0.001 |
| Total population (per 1,000,000) | 0.00002 | 0.00001–0.00002 | <0.001 |
| Country GDP (per capita) | 0.045 | −0.002–0.091 | 0.06 |
| Country total health expenditure per capita (per $10,000 ↑) | 1.28 | 0.80–1.77 | <0.001 |
| Country Universal health coverage (per 1% ↑) | 79.23 | 20.46–138.01 | 0.008 |
| Total number of COVID-19 tests | 0.00181 | 0.00155–0.00208 | <0.001 |
| Mortality rate | |||
| Incidence rate (per 1,000,000 ↑) | −1.03 | −4.42–2.36 | 0.55 |
| Country GDP (per capita) | −0.00001 | −0.00002–(−0.00001) | <0.001 |
| Country total health expenditure per capita (per $10,000 ↑) | −0.00003 | −0.00010–0.00003 | 0.31 |
| Total number of COVID-19 tests | 0.00000 | −0.00000–000000 | 0.43 |
Meta-regression analyses examining the association of incidence rate, daily cumulative index, and mortality rate of COVID-19 with country characteristics
Interestingly, country total health expenditure per capita and total number of COVID-19 tests were not significantly correlated with mortality. On the contrary, country GDP per capita showed a negative correlation with mortality.
Total life expectancy at birth, availability of basic handwashing facilities with soap and water, number of hospital beds, and critical care beds were not associated with DCI and mortality.
4. DISCUSSION
We extracted the data from 216 countries and dependent territories since the outbreak of COVID-19 starting in Wuhan until March 28, 2021 in order to estimate the global burden and mortality rate of COVID-19 and also to explore the associated factors, including geographic variations, transmission scenarios (sporadic cases, cluster of cases, and community transmission), economic status such as the country GDP, health expenditure, and healthcare performances.
There were several meta-analyses previously investigated on COVID-19 epidemiology [11–14] (Table 4). Most of the works focused on medical aspects such as prevalence of specific comorbidities and its impacts on outcomes. In the present meta-analysis, we try to demonstrate the impacts of geographical and economic factors on number of cases, DCI, and mortality rates using global epidemiology data from central databases.
| Author (year) | Emami et al. (2020) | Salunke et al. (2020) | Nandy et al. (2020) | Yin et al. (2021) | Present study |
|---|---|---|---|---|---|
| Population | Hospitalized patients with confirmed COVID-19 infection | COVID-19 patients with and without cancer | Confirmed COVID-19 cases | Chinese patients with COVID-19 | All COVID-19 confirmed cases reported to authority |
| Data sources | RCTs and non-RCTs using PubMed, Scopus, Web of Science, Google scholar, and Embase | PubMed and Cochrane databases | PubMed and Cochrane databases | PubMed, Web of Science, Chinese database; CNKI | WHO database (mainly) combined with OurWorldinData.com and European CDC |
| End of search | 16 February 2020 | 16 April 2020 | 28 April 2020 | 18 January 2021 | 28 March 2021 |
| Total number of patients | 3404 patients from 10 studies | 3775 patients from 13 retrospective cohorts (all from China) | 3994 patients from 16 retrospective cohorts (all from China) | 12,526 patients from 41 studies (all from China) | 125,771,152 COVID-19 cases from 216 countries |
| Outcomes | Prevalence of underlying disease in hospitalized confirmed COVID-19 cases including:
|
Prevalence of cancer in COVID-19 patients and outcomes of COVID-19 patients with cancer compared with patients without cancer including ICU admissions and death rates | Prevalence and impacts of various comorbidities (hypertension, CVD, DM, CKD, and COPD) on serious COVID-19 events including ICU admission, pneumonia, mechanical ventilation, ARDS, and death | Prevalence of comorbidities compared between severe and non-severe COVID-19 cases | Crude/population corrected rates, DCI and mortality rates among different geographical regions, countries’ economic status, and transmission scenarios |
CVD, cardiovascular disease; CKD, chronic kidney disease; COPD, chronic obstructive pulmonary disease; DM, diabetes mellitus; ARDS, acquired respiratory distress syndrome; ICU, intensive care unit; DCI, daily cumulative index.
Summary of previous meta-analyses regarding epidemiology of COVID-19
Regarding economic status, both the number of cases and DCI were much higher in the high and upper-middle income countries when compared with the lower middle and low-income countries (Table 1). A similar trend of these findings was also observed in the meta-regression in our meta-analysis that pooled DCI was associated with country total health expenditure per capita and total number of COVID-19 tests. This might be explained by the fact that these countries had a higher capacity to test and identify the infected people [15,16]. A recent study also demonstrated that the countries with greater health expenditure had more accessible and available COVID-19 test [16]. Indeed, lower-income countries with limited resources performed a smaller number of tests and reported fewer cases. Three countries with the highest tests performed each day were from the higher income country and the high percentage of GDP spent on health expenditure (the United Kingdom, Israel, and USA) [17]. A previous study also reported that the number of laboratory tests of COVID-19 cases was associated with a higher incidence rate of COVID-19 [18].
Since traveling increases the chances of receiving and spreading COVID-19, the higher-income countries with higher facilities and more accessible international transportation might increase the risk of infection. A recent study suggested that human mobility predicts the spread and size of epidemic while country border closure is associated with a reduction of pandemic spread [19].
Regarding transmission scenario, the countries with reported community transmission had the highest number of DCI. The community transmission means that authorities are unable to trace the exact source of the infection and the infected patient could be circulating in the community as a silent spreader [3]. In contrast, countries that reported sporadic cases and clusters of cases can successfully suppress and control the disease by isolating as well as treating confirmed cases and precise tracing all potential contact cases [20].
Despite higher number of cases and DCI, we found that countries with higher GDP per capita was associated with lower mortality rate. This might represent the performance in health care systems to prevent deaths in COVID-19 cases. As stated before, these countries had capacity, such as active surveillance program, to identify more infected patients especially asymptomatic or mild cases which might lead to more effective treatment and disease control. Previous studies reported that the rapidly increasing rate of infected patients in some regions could potentially overwhelm the medical system, especially in the regions with limited health resources [21,22]. Therefore, total amount of investment budget is very important to maintain high technology and high professional health care personnel in a time of crisis and also could improve the validity of epidemiology data in COVID-19 situation. Recent data showed that the public health policies during COVID-19 pandemic in each country, including wearing mask, handwashing, social distancing, working from home, state quarantine, digital contact tracing, curfew, and lockdown could have important role in decreasing the incidence as well as mortality of COVID-19 and these issues are currently under active investigations.
A recent study regarding COVID-19 demonstrated that the mortality increased exponentially with age [23,24]. However, there were no statistically significant correlations between population life expectancy and DCI as well as mortality rate in the meta-regression model. Our hypothesis is that early screening in patient under investigation case without symptoms has been performed in most countries. Younger people with active working were rapidly diagnosed COVID-19 by using the rapid test before travelling across countries.
To date, this is the first systematic review and meta-analysis that examined the global burden of COVID-19 among different geographical regions and economic status. The present study emphasizes the serious global situation of COVID-19 according to regions and economic status. Lower mortality was associated with countries’ investments on health which represented by total health expenditure per capita. Therefore, high performance health system including active surveillance and early case identification might help to control the pandemic and reduce COVID-19 mortality.
There is an important limitation in the present meta-analysis. The data were retrieved from the WHO online database reported from national authorities. Not only the capability of each country in detecting COVID-19 but also the availability of databases of each country could certainly affect the precision of information.
5. CONCLUSION
Spreading of COVID-19 across the world affects over 126 million people as of March 28, 2021, approximately 15 months from its beginning, and responsible for 2,758,545 deaths. The global pooled DCI was 1423.87 cases/day. The most affected regions are North America, Europe, and South America. Higher income, GDP, and countries’ investments on heath are associated with higher DCI while higher GDP correlates with lower mortality. These might be mediated by greater capacity to test, identify, and report the infected cases.
CONFLICTS OF INTEREST
The authors declare they have no conflicts of interest.
AUTHORS’ CONTRIBUTION
JP and PS contributed in study conceptualization, data curation, formal analysis and writing (review and editing) the manuscript. KuT performed the data curation, generates figure and writing (original draft). TA, KrT, KP and SE-O contributed in editing the manuscript, and project supervision. All authors contributed to the final draft.
FUNDING
This work was supported by the
Footnotes
REFERENCES
Cite this article
TY  - JOUR
AU  - Jeerath Phannajit
AU  - Kullaya Takkavatakarn
AU  - Pisut Katavetin
AU  - Thanin Asawavichienjinda
AU  - Kriang Tungsanga
AU  - Kearkiat Praditpornsilpa
AU  - Somchai Eiam-Ong
AU  - Paweena Susantitaphong
PY  - 2021
DA  - 2021/06/14
TI  - Factors Associated with the Incidence and Mortality of Coronavirus Disease 2019 (COVID-19) after 126-million Cases: A Meta-analysis
JO  - Journal of Epidemiology and Global Health
SP  - 289
EP  - 295
VL  - 11
IS  - 3
SN  - 2210-6014
UR  - https://doi.org/10.2991/jegh.k.210527.001
DO  - 10.2991/jegh.k.210527.001
ID  - Phannajit2021
ER  -