
Non-invasive Blood Glucose Measurement based on Impedance Spectrum
- DOI
- 10.2991/jrnal.k.200221.001How to use a DOI?
- Keywords
- Blood glucose concentration; impedance spectroscopy; non-invasive glucose measurement
- Abstract
Different from the traditional measurement approach and instruments of blood glucose concentration, we propose a novel measuring method related to electrical impedance spectrum without invasion, and we have researched the correspondence between blood glucose values and impedance parameters. Considering the skin contacting impedance and cytomembrane conductivity feature, an equivalent circuit of human model was built in the MATLAB Simulink environment. We obtained the impedance parameters of the model at 1 Hz–20 MHz by simulation. The measured data were analyzed by a Cole–Cole model to derive the relationship between the impedance value and the blood glucose concentration. The results show that the electrical impedance is strong negative correlation to blood glucose concentration, as the blood glucose concentration increases, the impedance value decreases. The conclusion of this research provides a theoretical basis for non-invasive blood glucose surface-measuring.
- Copyright
- © 2020 The Authors. Published by Atlantis Press SARL.
- Open Access
- This is an open access article distributed under the CC BY-NC 4.0 license (http://creativecommons.org/licenses/by-nc/4.0/).
1. INTRODUCTION
The blood glucose concentration is one of the key indicators reflecting the condition of diabetic patients. At present, the most common testing method is acupuncture measurement before and after meal invasively, which bring great pain to the patients with potential dangers of infection [1]. Compared with the common invasive method, non-invasive blood glucose concentration measuring has the advantages of no acupuncture and no pains with simple and quick operation. Non-invasive blood glucose concentration measuring has an important application value of monitoring the blood glucose change in time and of visualizing the abnormally glucose metabolism rapidly [2].
This aim of this research is to explore a new way that detecting the blood glucose concentration non-invasively by electrical impedance scanning (EIS) method on the surface of body. The concentration of electrolytes in the blood and tissues changes with glucose concentration, which in turn causes an imbalance in electrolyte concentration between blood and tissue fluid. This causes the ions to move in a directional manner, and the electrical properties of the cytomembrane change with the concentration of ions passing through the cytomembrane. From a macro perspective, the impedance of the human body will also change accordingly. On the biological principle, it indicates a hopeful direction for non-invasive blood glucose measuring.
2. THE RELATIONSHIP DEDUCTION OF GLUCOSE AND CYTOMEMBRANE CAPACITANCE
An increasing concentration of glucose in blood induces significant reactions in blood and human tissues. It is known that the concentration of sodium decreases and potassium increases due to the active transport of ions and water movement from the tissue and blood cells, such as erythrocytes, into the vascular system. It can be understood on the cellular level that glucose uptake through membrane transporters requires controlling the electrolyte balance to maintain osmolality and cell sizes [3].
Shap et al. [4] proposed and verified the relationship between cytomembrane capacitance (Cmem) and blood glucose concentration (Cglu) by Michaelis–Menten equation as
According to the experimental data in Beving et al. [5], the cytomembrane capacitance value is 1 μF/cm2 when the blood glucose concentration is zero. In this paper, a rectangular electrode of 3 cm2 is selected for simulation test, so Cmem,0 = 3 μF. We bring Cmem,0 into the Equation (1), and obtain the relationship between the cytomembrane capacitance values corresponding to the blood glucose levels of different concentrations, as shown in Equation (2), and as shown in Figure 1.
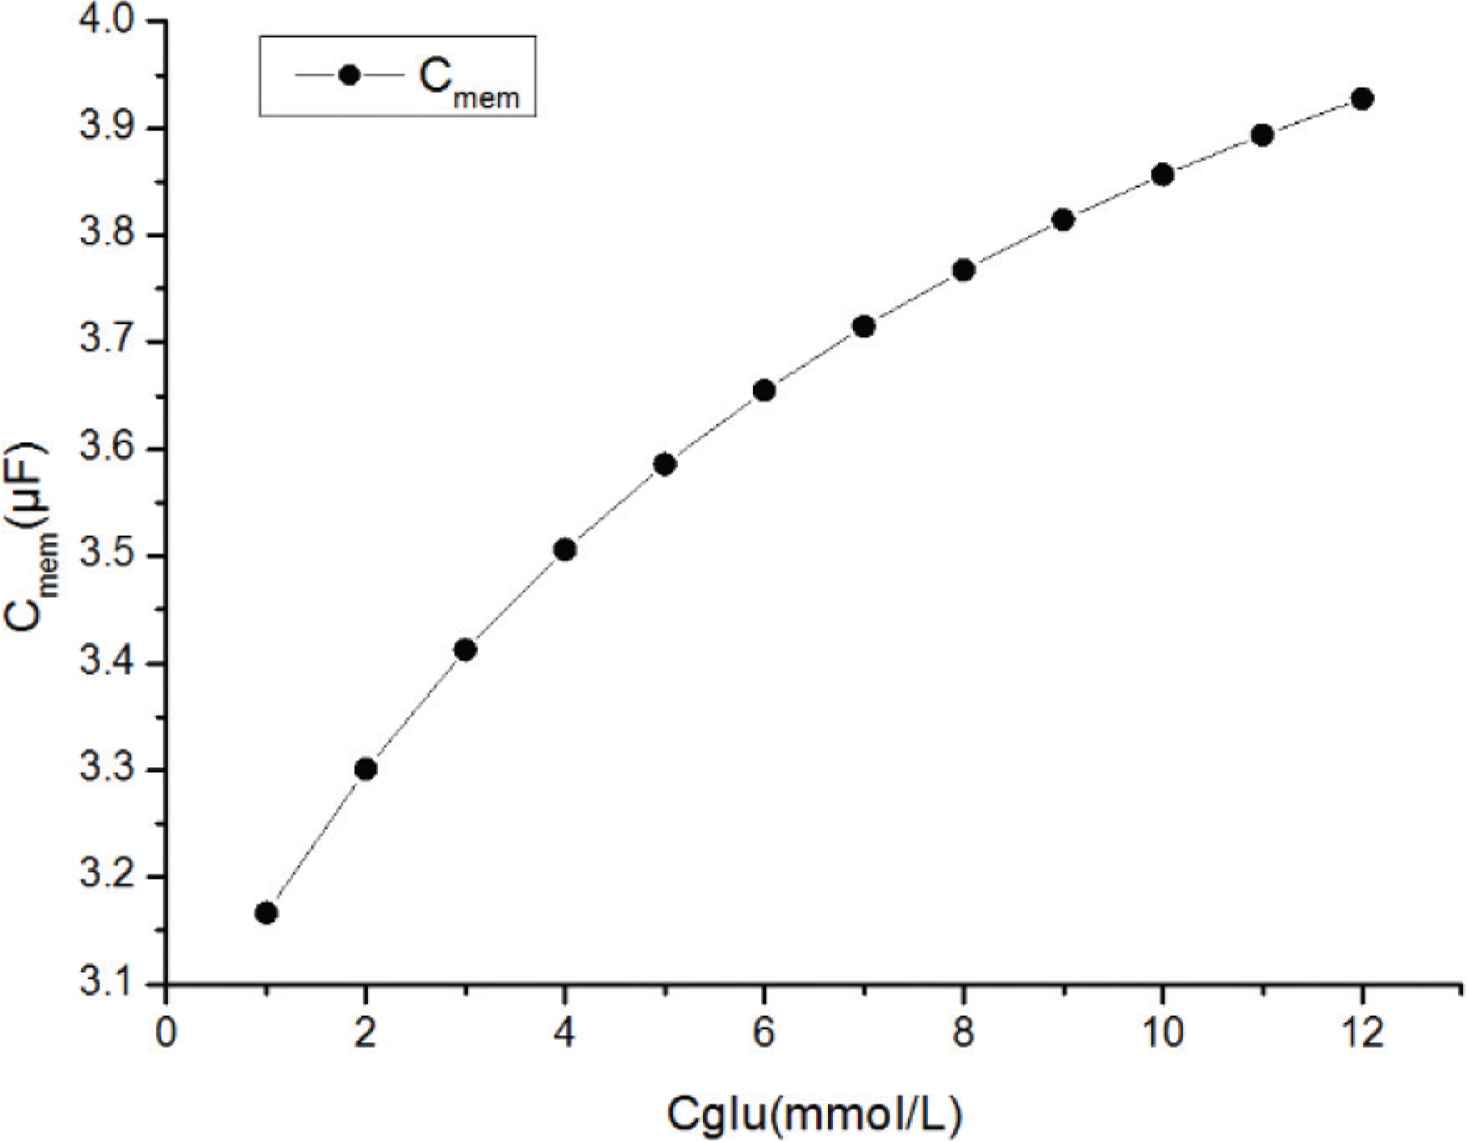
The relationship between Cglu and Cmem. As the Cglu increases, Cmem shows an upward trend.
From Figure 1, at the change stage of 3–10 mmol/L in human blood glucose concentration, the cytomembrane capacitance changes very rapidly, and this change is more obvious than that caused by other substances to the cytomembrane capacitance. When the cytomembrane capacitance changes, the influence of other substances can be ignored. Therefore, the impedance index can be used to indicate the blood glucose reasonably.
3. EQUIVALENT CIRCUIT MODEL
To simulate the effects of different blood glucose concentrations on impedance spectroscopy measurements, we established a human equivalent circuit model. In an alternating electric field, the biological tissue has greater impedance at the lower frequency. The capacitive impedance characteristic of biological tissues was discovered by scholar Philippson in 1920, who established a corresponding bio-impedance equivalent circuit model.
Due to the detecting electrodes and skin contacting, it is also necessary to consider the effect of contact impedance. Therefore, we established a novel human equivalent circuit model as shown in Figure 2.
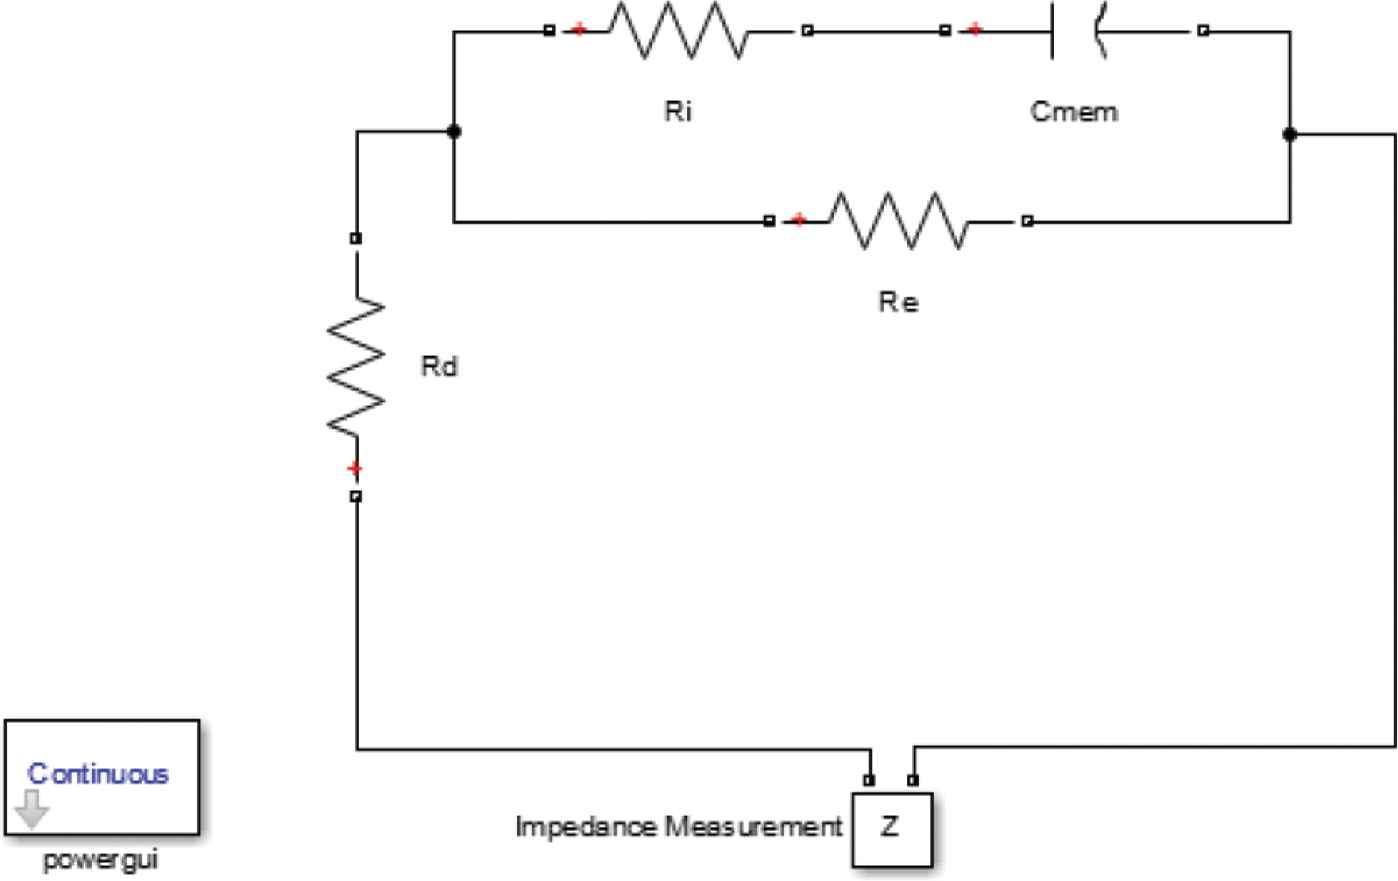
Human equivalent circuit model.
Rd represents the contact impedance, Ri is the internal liquid resistance of the human body, Re is the liquid resistance, and Cmem is the cytomembrane capacitance. According to the experimental data in Chen et al. [6], we set Rd = 1 kΩ, Ri = 500 Ω, Re = 500 Ω.
4. DATA PROCESSING AND RESULT ANALYSIS
In order to accurate describe the equivalent circuit model of biological tissues, Cole and Cole [7,8] have conducted in-depth research in this regard. They summed up a set of actual biological tissue electrical impedance theory, the Cole–Cole theory, and used it to describe the dielectric model of biological tissue. The basic content of the Cole–Cole theory is that the trajectory of the electrical tissue’s electrical impedance in the complex plane is a circular arc in the fourth quadrant, and the center of the circle is not on the real axis but in the first quadrant.
The measurement of bio-impedance is essentially to obtain the characteristic parameters in the impedance trajectory map. It can be seen from the above analysis that as long as an excitation electric signal of a certain frequency is applied to the biological tissue and the output signal flowing through the biological tissue is simultaneously measured, the impedance amplitude at the frequency can be calculated by the relevant demodulation algorithm. If the excitation power signal is operated in a sweep mode, the entire impedance circle can be obtained by curve fitting. On the impedance plot, the impedance value at any frequency point can be obtained. Based on this theory, the Cole–Cole chart and its electrical characteristic parameters of the human equivalent circuit model are obtained from the real and imaginary parts of the impedance and the phase and impedance values. Corresponding Cole–Cole biological tissue electrical impedance characteristic equation is:
The Im axis represents the imaginary part of the impedance, and the Re axis represents the real part value. fc represents the frequency value when the imaginary part is maximum. R0 represents the electrical impedance of biological tissue at a frequency of zero. R∞ represents the electrical impedance of biological tissue at infinite frequency. These scatter points in the figure are calculated at frequencies from 10 Hz to 20 MHz, in which the impedance changes from 1500 to 1250 Ω. According to the measured real and imaginary parts of the impedance, the Cole–Cole circle is fitted through Python using the weighted average method, and the following Figure 3 shows the Cole–Cole circle fitted at Cglu = 6 mmol/L. Fitted into a circle by these scatter plots and it can be seen that it is normative.
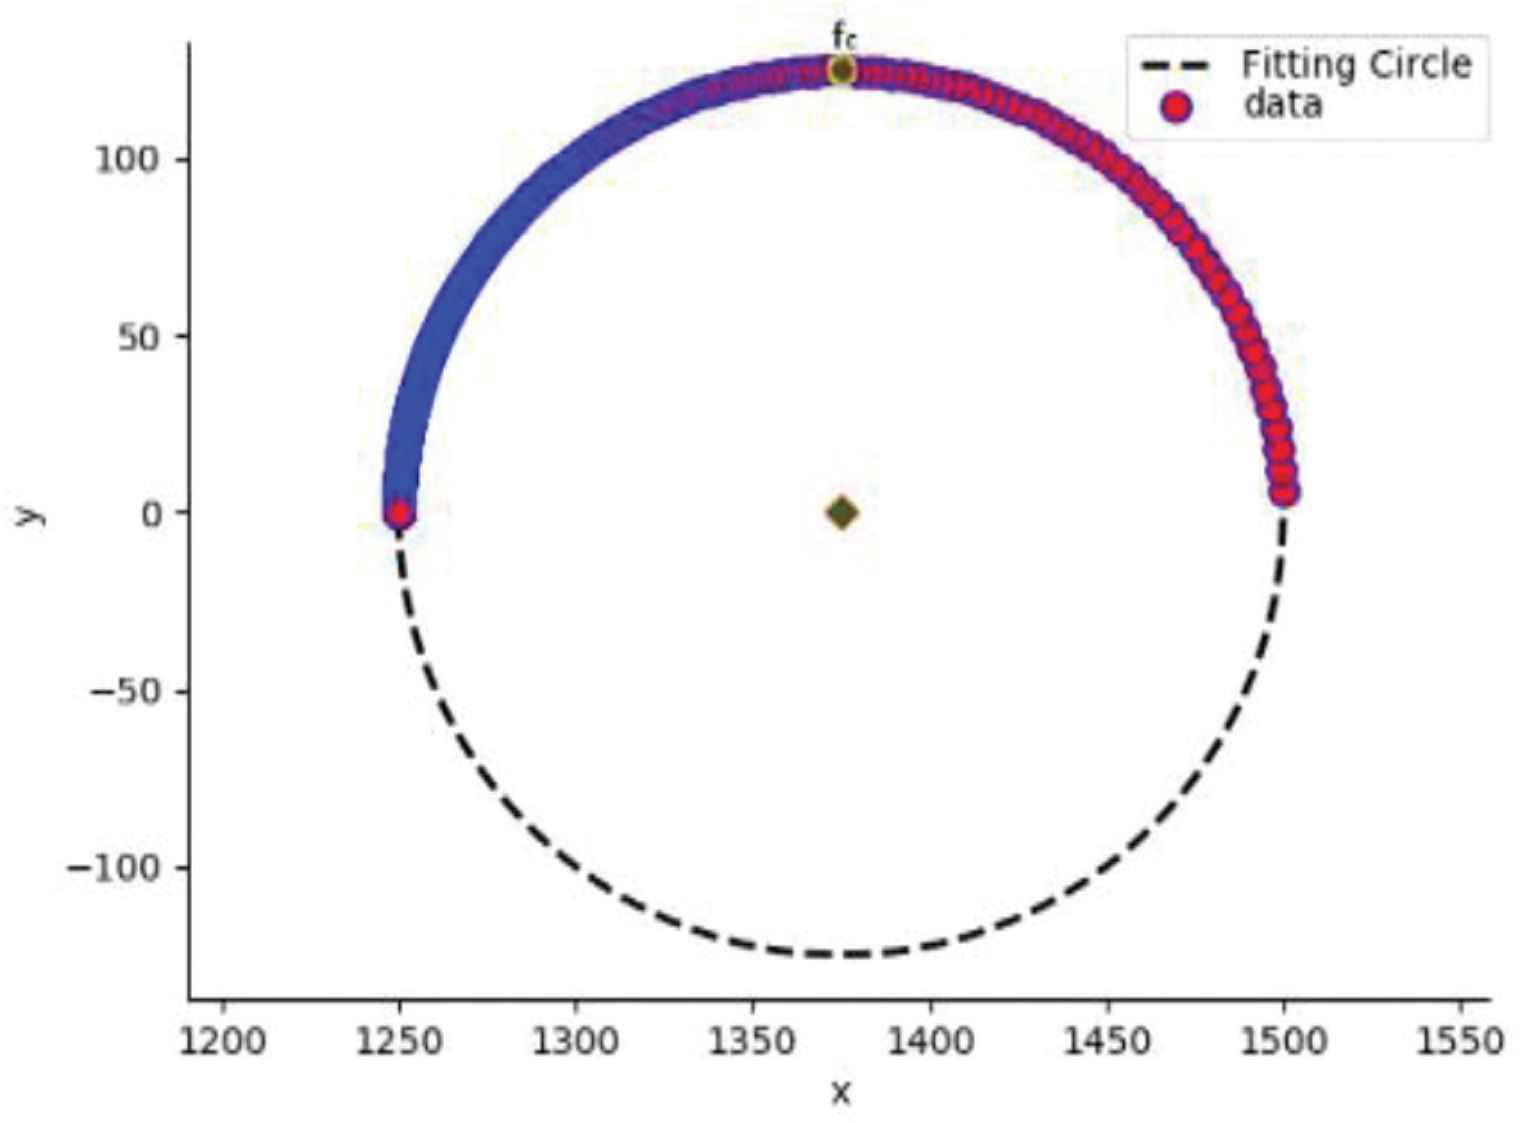
The Cole–Cole impedance circle.
The change trend of the characteristic parameter fc has a great correlation with the change of the blood glucose concentration. From the data in Table 1, the magnitude of fc has an inverse correlation with the magnitude of the blood glucose concentration. The higher blood glucose concentration, the smaller value of fc corresponding to the impedance spectrum.
| Diagnosis | fc(Hz) | Cglu(mmol/L) |
|---|---|---|
| Hypoglycemia | 48.22 | 2 |
| Hypoglycemia | 45.40 | 4 |
| Normal glucose | 43.55 | 6 |
| Abnormal glucose metabolism | 42.24 | 8 |
| Abnormal glucose metabolism | 41.27 | 10 |
| Diabetes | 40.52 | 12 |
Impedance spectrum characteristic parameters and corresponding blood glucose concentration
A power function fitting was performed by MATLAB to obtain a correspondence between Cglu and fc:
Power function fitting results are shown in Figure 4.
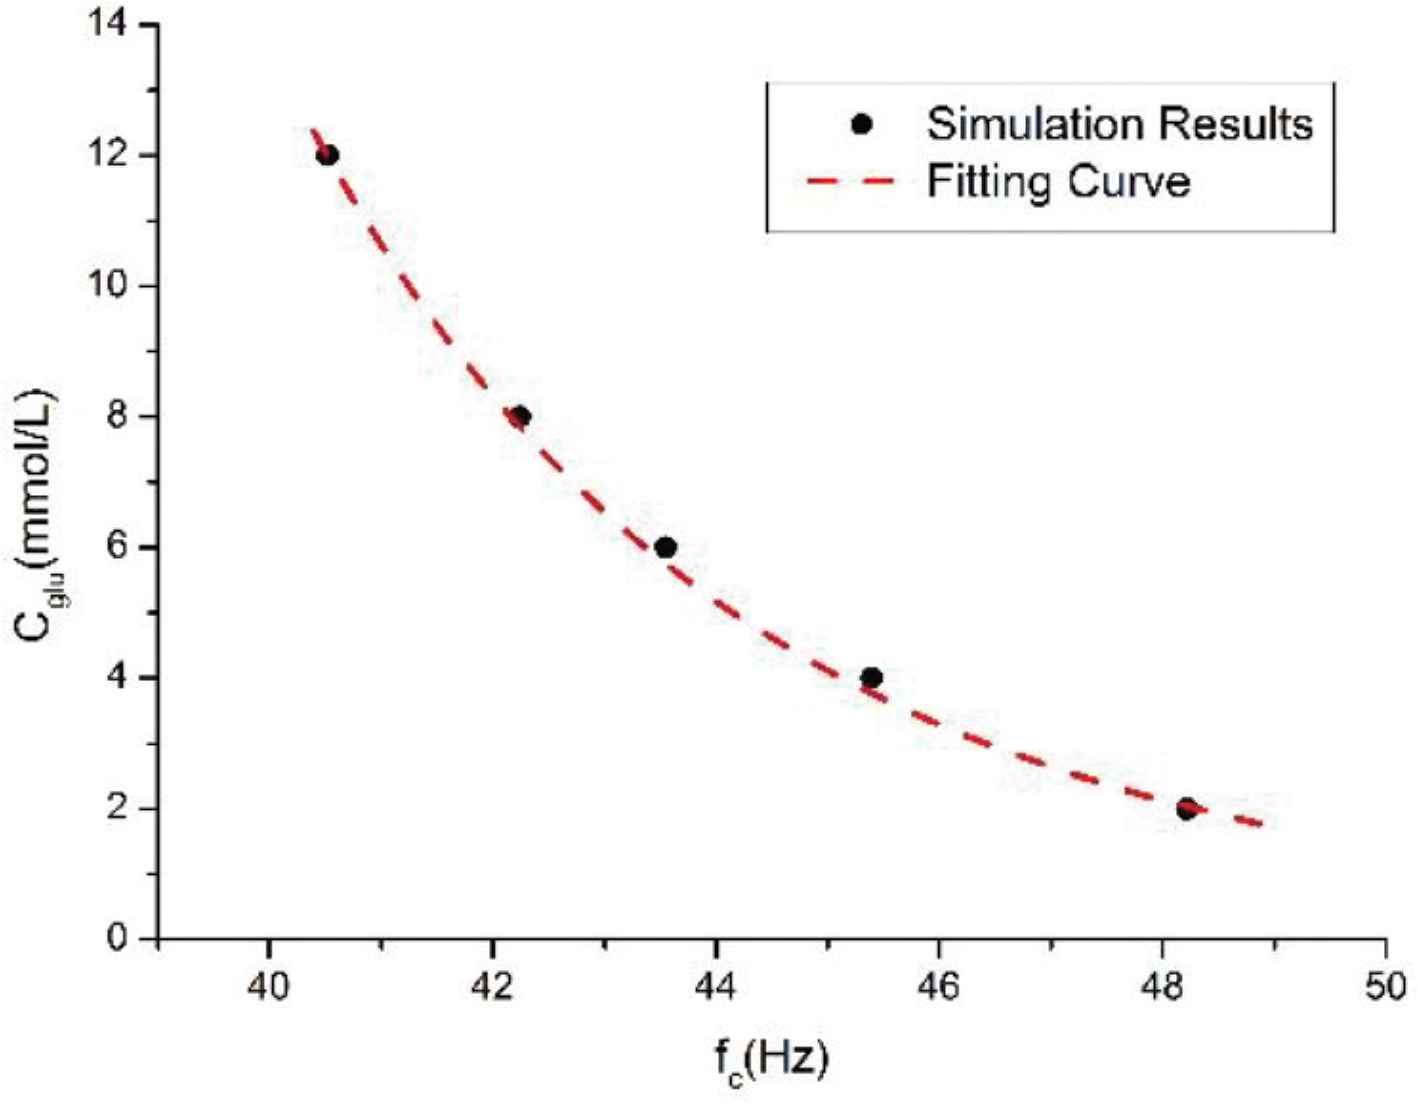
Power function fitting.
The coefficient of determination R2 = 0.9981, which means that the fitting effect is excellent. The characteristic frequency fc in the impedance spectrum can reflect the change of human blood glucose concentration to a certain extent, and it is possible to realize non-invasive blood glucose monitoring based on impedance spectrum method.
5. CONCLUSION
As the glucose concentration changes, the binding of glucose to the transporter changes the capacitance of the cytomembrane. The transport of glucose into cells by transporters is a macroscopic change in the impedance of the human body. Considering the skin contacting impedance and cytomembrane conductivity feature, an equivalent circuit of human model was built in the MATLAB Simulink environment. We obtained the impedance parameters of the model at 1 Hz–20 MHz by simulation. The measured data were analyzed by a Cole–Cole model and the blood glucose concentration, and a power function fitting was performed by MATLAB to obtain a correspondence between Cglu and fc as shown in Equation (4). The results show that the electrical impedance is strong negative correlation to blood glucose concentration, especially the characteristic frequency fc, as the blood glucose concentration increases, the impedance value decreases. The conclusion of this research provides a theoretical basis for non-invasive blood glucose surface-measuring.
CONFLICTS OF INTEREST
The authors declare they have no conflicts interest.
ACKNOWLEDGMENTS
This paper was supported by a grant from the
AUTHORS INTRODUCTION
Ms. Tong Yin
 She received the B.S. degree in Yantai University, China, in 2017. Now she is the master course student in Tianjin University of Science & Technology. Her research field is control engineering.
Dr. Xiaoyan Chen
 She received the M.S. degree from the Tianjin University of Science and Technology, in 1999, and the PhD degree in measurement technology and automation devices from Tianjin University, in 2009. From 2009 to 2015, she held a post-doctoral position at Tianjin University. She was invited by RPI, USA, as a Visiting Scholar, from 2009 to 2010, and Kent, U.K., in 2012. She is currently a Professor and an Advisor of Postgraduate and Doctorate students with the Tianjin University of Science and Technology.
Dr. Meng Du
 He received the B.S. degree in computer science and technology from the Hebei University of Science and Technology, China, in 2005, the M.S. degree in computer application from Yanshan University, China, in 2009, and the Ph.D. degree in control science and engineering from Tianjin University, China, in 2013. He is currently with the College of Electronic Information and Automation, Tianjin University of Science and Technology. His current interests include multi-phase flow parameter measurement, flow pattern identification, time series analysis, and machine learning.
Mr. Hongyi Yin
 He received the B.S. degree in communication engineering from Qiqihar University, China, in 2017. He is currently pursuing the M.S. degree in control science and engineering with the Department of Electronic Information and Automation, Tianjin University of Science and Technology, China, under the supervision of Dr. M. Du. His current research interests include multi-phase flow parameter measurement, flow pattern identification, and machine learning.
REFERENCES
Cite this article
TY  - JOUR
AU  - Tong Yin
AU  - Xiaoyan Chen
AU  - Meng Du
AU  - Hongyi Yin
PY  - 2020
DA  - 2020/02/26
TI  - Non-invasive Blood Glucose Measurement based on Impedance Spectrum
JO  - Journal of Robotics, Networking and Artificial Life
SP  - 246
EP  - 249
VL  - 6
IS  - 4
SN  - 2352-6386
UR  - https://doi.org/10.2991/jrnal.k.200221.001
DO  - 10.2991/jrnal.k.200221.001
ID  - Yin2020
ER  -