
Design and Development of a Virtual System for Measurements and Analysis of the Respiratory Sounds for Diagnosis of Respiratory System
- DOI
- 10.2991/jrnal.k.200221.006How to use a DOI?
- Keywords
- Respiratory disease; virtual instrument; signal processing; power spectrum
- Abstract
Respiratory problem is one of the most common health problems occurring in Saudi Arabia due to the continuous changes of the weather in addition to surface winds that cause dust during all seasons yearly. The most affected people especially children and elderly in addition to the adults with respiratory problems such as asthma. Such problem needs emergency care as soon as it occurred. The goal of our research is to develop a compact respiratory diagnostic system using advanced signal processing that can be used remotely via the virtual instrumentation technology to help accurately diagnosis at early stages of respiratory diseases. It can also overcome the lack of expert physicians in rural regions and some urban clinics or health centers. The proposed system will be implemented using Virtual Instrumentation (VI) that consists of computer, microphone with simple analog circuit, digitizer and LabVIEW software. VI has been designed for easy measurement and analysis. In addition to that, it has features and ability to control the whole system of acquisition, play, display, processing and advanced analysis of the different acquired respiratory signals. Respiratory signals obtained from our system are analyzed for diagnosis purposes using advanced signal processing techniques to the analysis of respiratory parameters using time and frequency domains. The obtained results can be displayed and printed in a report format including acquired respiratory signal, filtered signal, extracted segment for selection of phase, power spectral density, and analyzed respiratory parameters for diagnosis purpose. The developed system is successful and achieved its purpose based on the tests performed with real respiratory signals of normal and abnormal cases that proved to be efficient system while dealing with many respiratory problems conditions.
- Copyright
- © 2020 The Authors. Published by Atlantis Press SARL.
- Open Access
- This is an open access article distributed under the CC BY-NC 4.0 license (http://creativecommons.org/licenses/by-nc/4.0/).
1. INTRODUCTION
Respiratory problem is one of the most common health problems occurring in Saudi Arabia due to the continuous changes of the weather in addition to surface winds that cause dust during all seasons in the year. The most affected people especially children and elderly in addition to the adults with respiratory problems such as asthma [1,2]. Such problem needs emergency care as soon as it occurred.
To diagnose these problems affecting the respiratory system, different methods and devices have been used. One of the widely used methods is auscultation of lung sound using stethoscope invented in 1816. It is cheap, easy to use and noninvasive but it is less accurate due to limitation of human ear which cannot distinguish the contents of mixed respiratory signal in addition to low signal to noise ratio due to deficiency in analyzing such signal [3,4]. Many technologies of other methods and devices based on computer technology have been developed for improving the monitoring and quantitative analysis of respiratory sounds [5].
Analysis of one cycle of respiratory sounds consisting of three phases, inspiration, respiration pause, and expiration quantitatively depends on the recording site of the respiratory system. The common three recording sites are the mouth, trachea and chest wall. The respiratory sounds are classified as normal or abnormal called adventitious. The respiratory sound heard on the chest wall of a healthy person is called normal respiratory sounds. The adventitious sounds are classified as two classes continuous and discontinuous. Continuous sounds are wheezes and rhonchi [6].
The spectral analysis is one of the important techniques used [7]. This method will help in displaying quantitative respiratory information that is of great importance to help in the clinical assessment of respiratory system for distinguishing between healthy and diseased respiratory system [8].
Today, most of the physicians already have computers which connected to the network and Internet that allow them to work remotely. For most physicians, a system dedicated to one task and local use is not practical. The goal of our research is to develop a compact diagnostic respiratory system using advanced signal processing that can be used remotely via the virtual instrumentation technology to support diagnosis at early stages of respiratory diseases. It can also overcome the lack of expert physicians in rural regions and some urban clinics or health centers.
2. MATERIALS AND METHODS
2.1. Hardware
The system hardware is composed of dedicated microphone, Analog to Digital Converter (ADC) interface card and a Personal Computer (PC) containing a VI which is implemented based on LabVIEW software (National Instruments Inc.) (Figure 1).
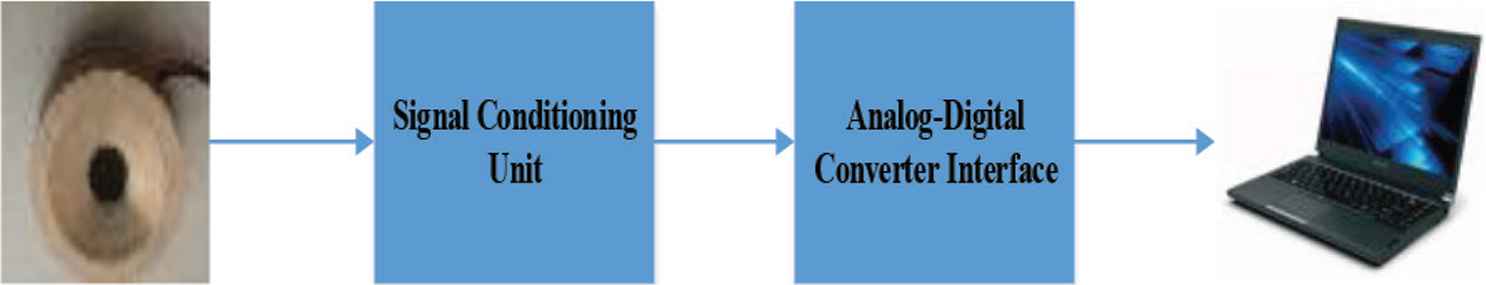
Block diagram of computer-based respiratory system.
The respiratory signals were recorded from subjects using dedicated microphone. To minimize the background noise, the amplification gain was set to obtain a clean spectrum on the spectral display. The audio output of analog circuit unit is sampled at 11,025 Hz with 12-bit resolution and then transferred to a PC via the interface card [9].
2.2. Software
A compact program, Virtual Respiratory Measurements and Analysis System (VRMAS) is designed and developed based on the hardware described above using the graphical programming language. To develop VRMAS software a state diagram is used which consists of self-produced four modules without the need for any external add-ons. The main modules of VRMAS are acquisition of the audio respiratory signal, advanced signal processing of acquired or simulated respiratory data, analysis of respiratory data and finally the printing and help tools as shown in Figure 2. Using the main module of VRMAS, the user will be able to control the whole system of acquisition, play, display, processing and advanced analysis of the different acquired in vivo clinical real data.
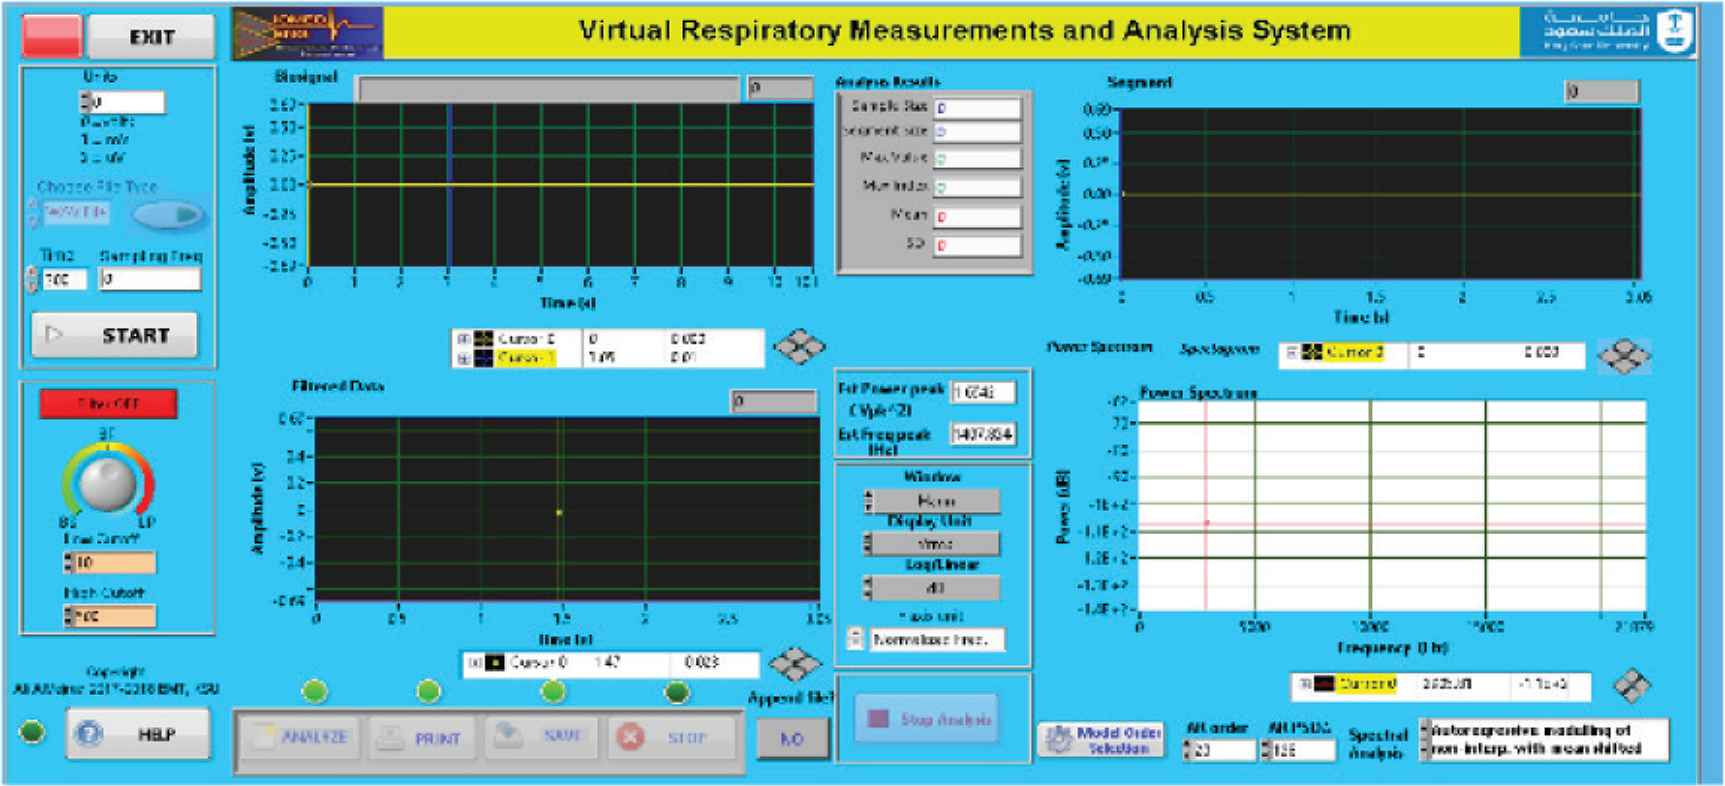
Graphical user interface (GUI) and front panel of developed virtual respiratory measurements and analysis system.
2.3. Respiratory Signal Processing Techniques
Many spectral methods have been used for signal analysis. These methods are classified as nonparametric such as Fast Fourier Transform (FFT) and parametric such as Autoregressive (AR) [10]. For their specific features, both methods will be applied in our system to investigate the influence of spectral analyses of respiratory signals in normal and abnormal cases.
Fast Fourier transform spectrum is calculated using usually either the Blackman Tukey or periodogram method. While AR spectrum is calculated by fitting the selected order of AR model into our respiratory signal data. The AR spectrum is obtained from the estimated AR model parameters which are solved using a forward–backward least squares method. To choose the appropriate model order, a compensation for the over-parameterizing is required. Akaike Information Criterion (AIC) is considered for model order estimation used is with order of 5 based on the literature and studies of Respiratory signals [11].
3. RESULTS OF SOFTWARE APPLICATION AND DISCUSSION
Virtual respiratory measurements and analysis system software is designed as shown in the flowchart in Figure 3. Acquired respiratory data can be recorded and saved in files in different format for data analysis. All modules are called from VRMAS main module as described in the following sections.
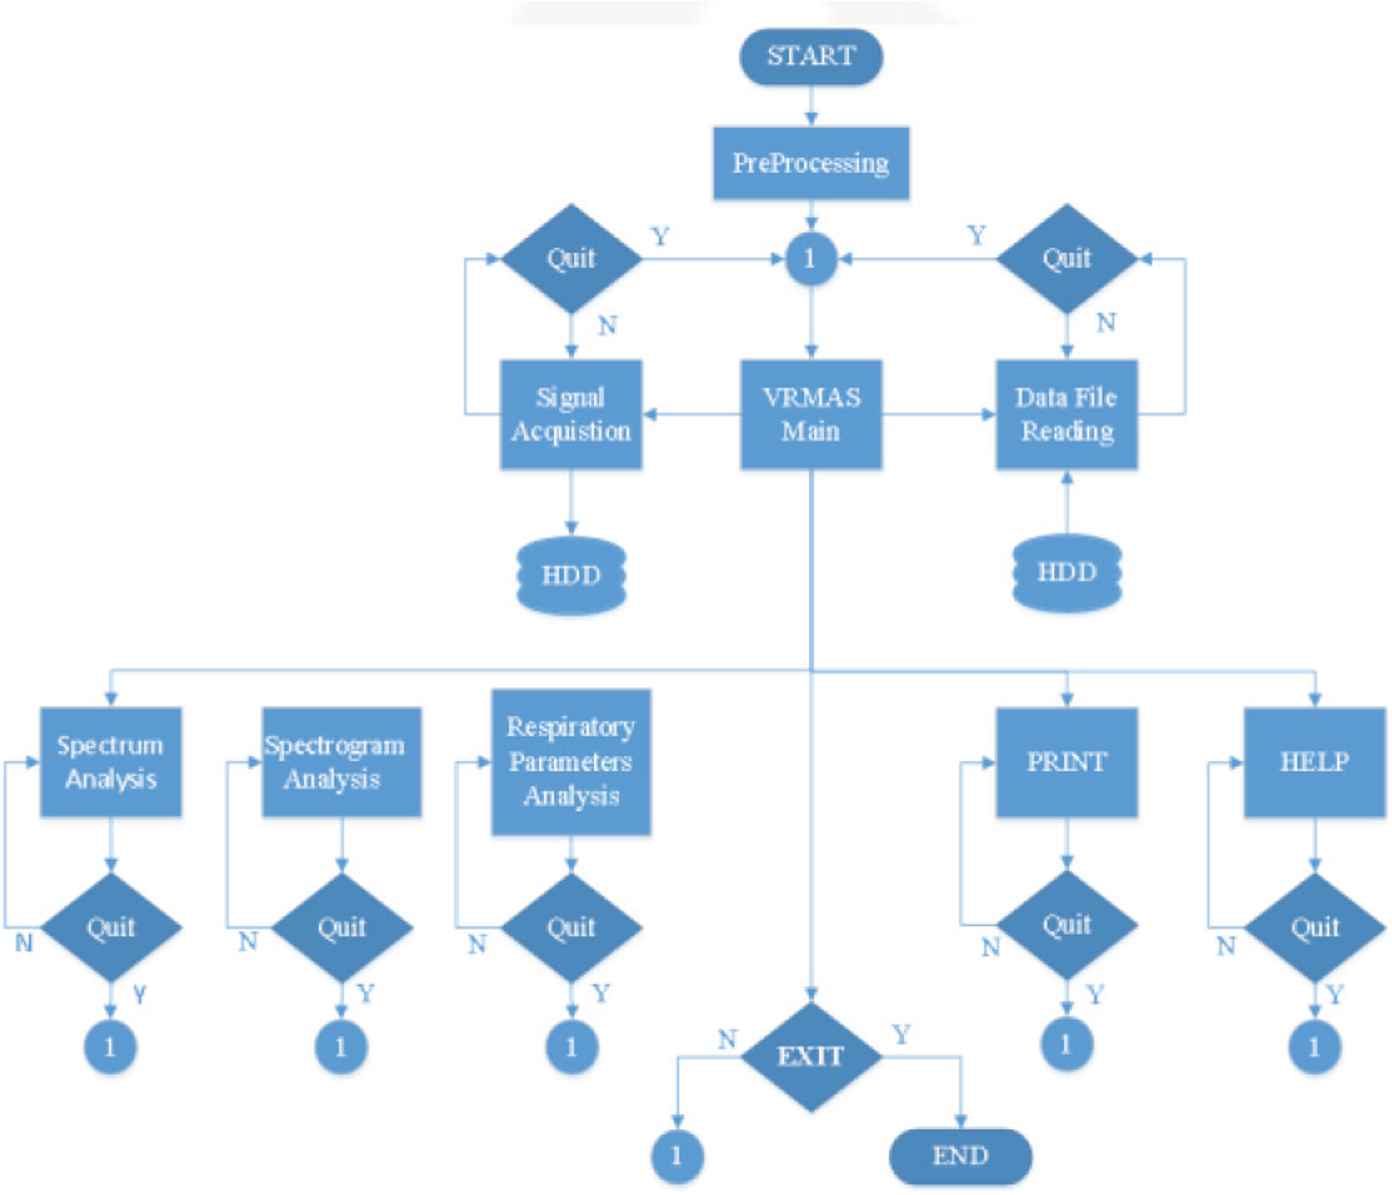
Flow chart of VRMAS software.
3.1. Acquisition and Recording of Respiratory Signals
Acquisition and recording of respiratory signals from normal and abnormal cases, as digitized by DAQ card are displayed and also can be saved if required. The sampling frequency and recording interval can be adjusted using acquisition setup. In the system control module, the Respiratory signal can be recorded both in txt and wav file formats. In Figure 4, shows GUI of VRMAS showing a case study of one cycle of inspiration and expiration of normal vesicular respiratory signal.
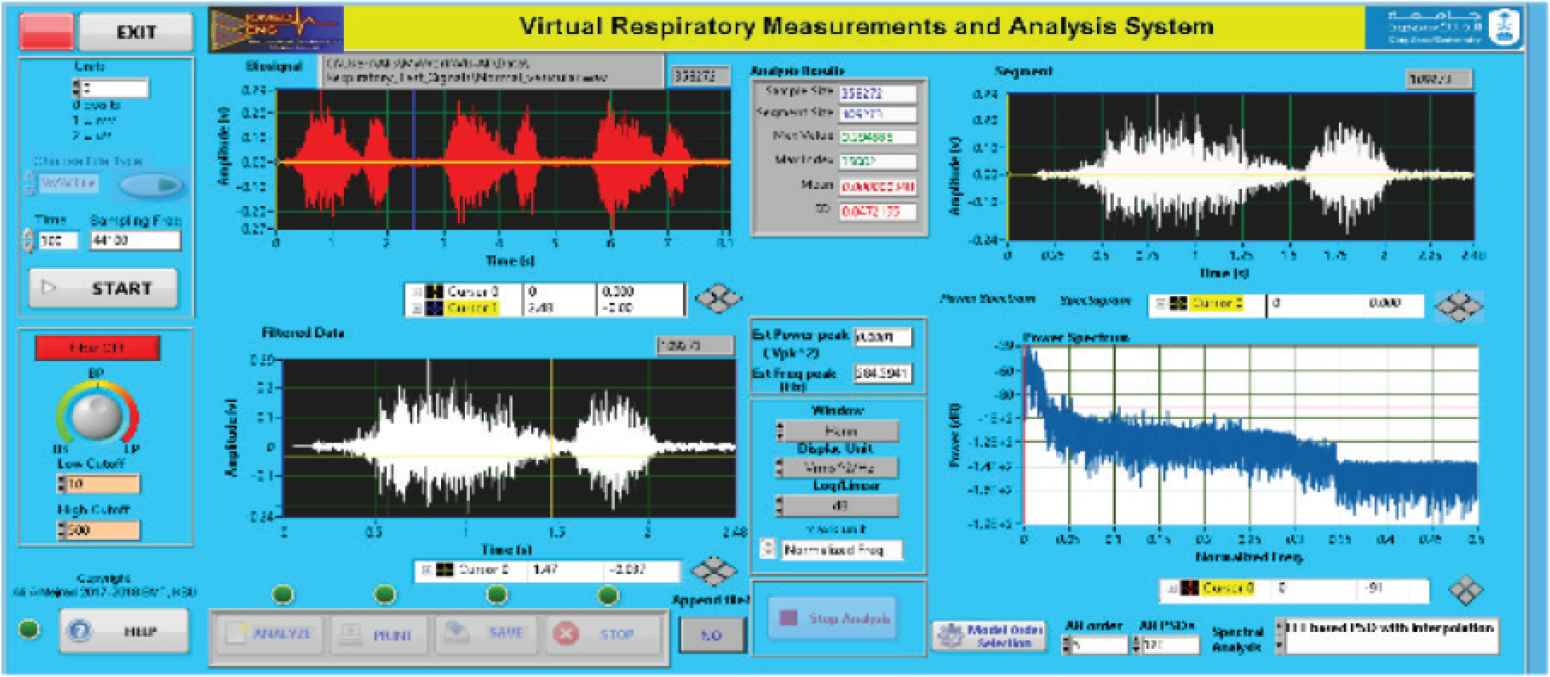
GUI and front panel of developed system.
3.2. Reading of Respiratory Data from a File
Recorded respiratory signal data is loaded for time or frequency analysis. The reading of respiratory data from file VRMAS module after filtering is shown in Figure 5.
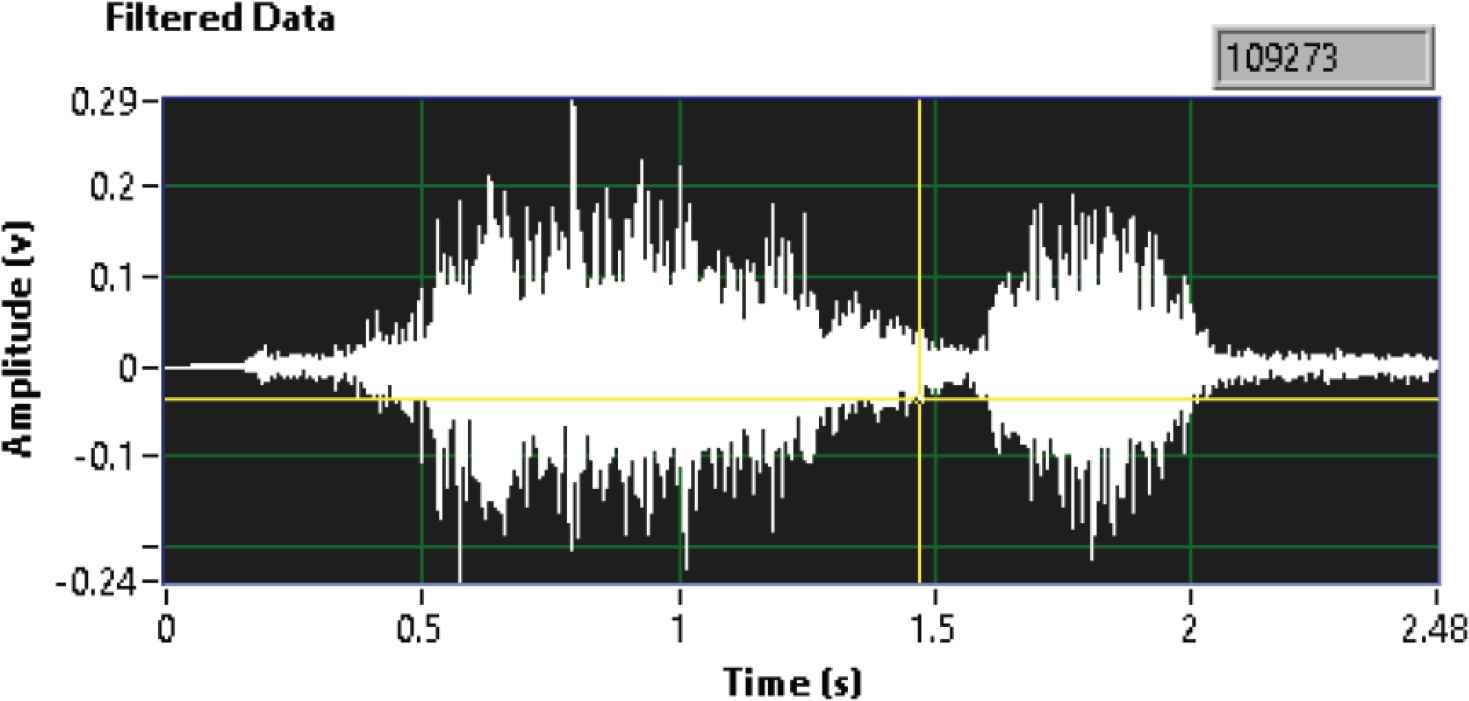
Filtered normal vesicular respiratory signal acquired from respiratory system.
3.3. Displaying and Playing of Respiratory Signals
As respiratory audio date is read from the file, respiratory signal is playing using computer sound card.
3.4. Analysis of Respiratory Signals
Virtual respiratory measurements and analysis system has three analysis modules, spectrum analysis, spectrogram analysis and respiratory parameters analysis that can be set up as shown in Figure 6. They will be discussed in the following subsections below.
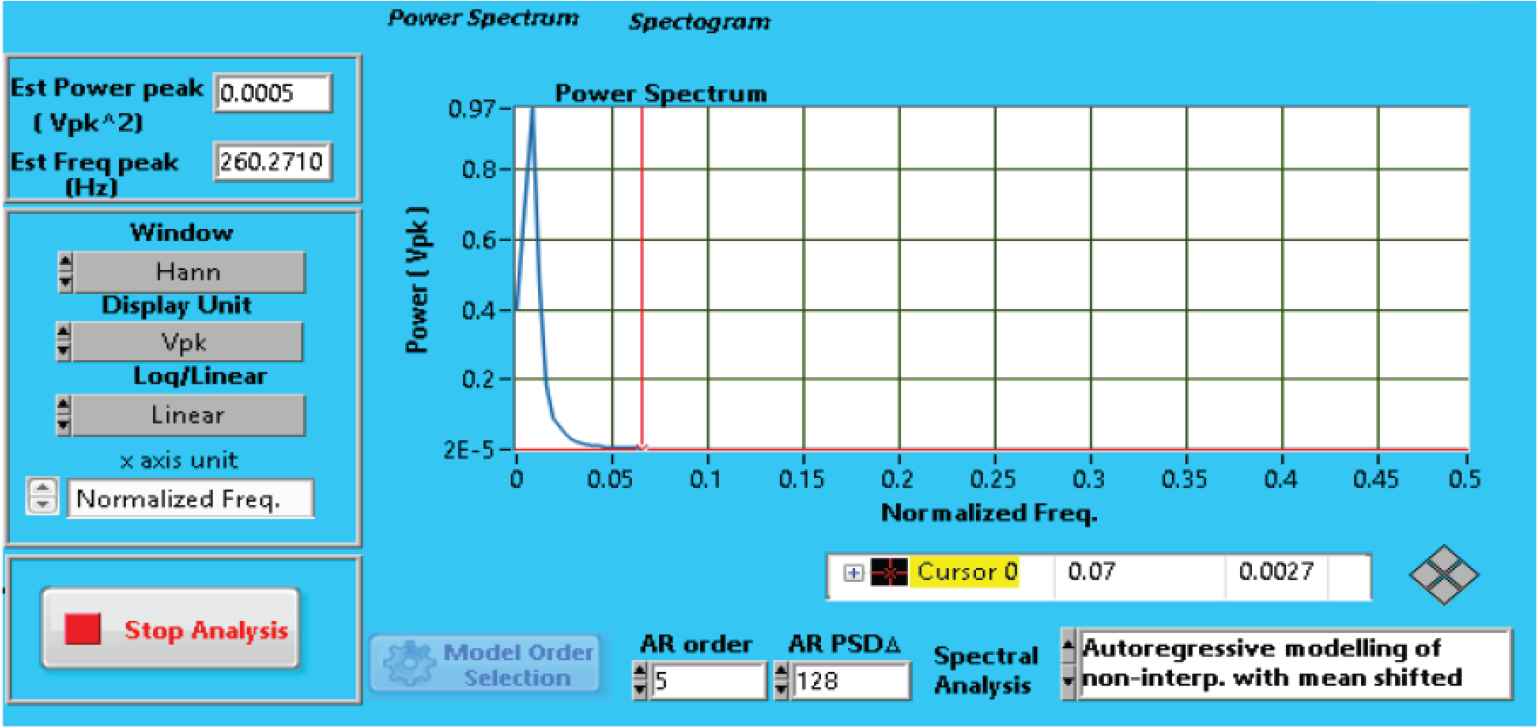
Analysis of respiratory signals window’s setup.
3.5. Spectrum Analysis
In this module, linear or log spectrum output with unit for the spectrum can be selected either as amplitude spectral density or power spectral density. To eliminate the spectral leakage during computing power spectrum, any window type can be selected from the list of many well-known window types. In this case shown a 1024 point FFT is applied with window function. In the other hand AR is designed to be used for comparison to search the best method for diagnosis of diseases. AR modelling requires some parameters to select based on the model chosen. To select the best order, one tool of our system for model order selection has been built using AIC technique as shown in Figure 7 for example of acquired crackle respiratory signal.
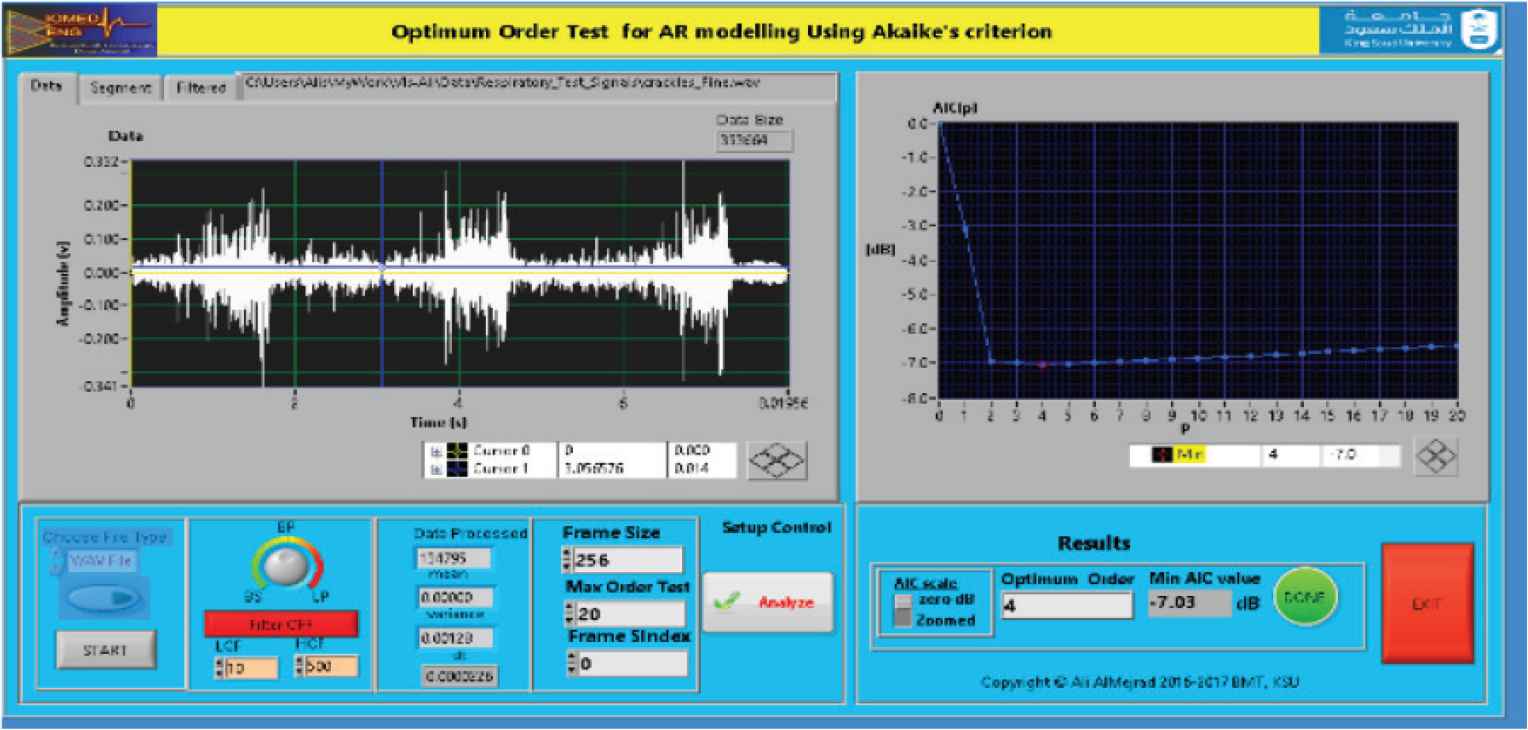
Model order selection using AIC of crackle fine respiratory signal.
The results of spectral analysis using FFT and AR obtained using the selected order are shown in Figure 8. It is clear the best smooth performance using AR method of Figure 8b compared with FFT method of Figure 8a.
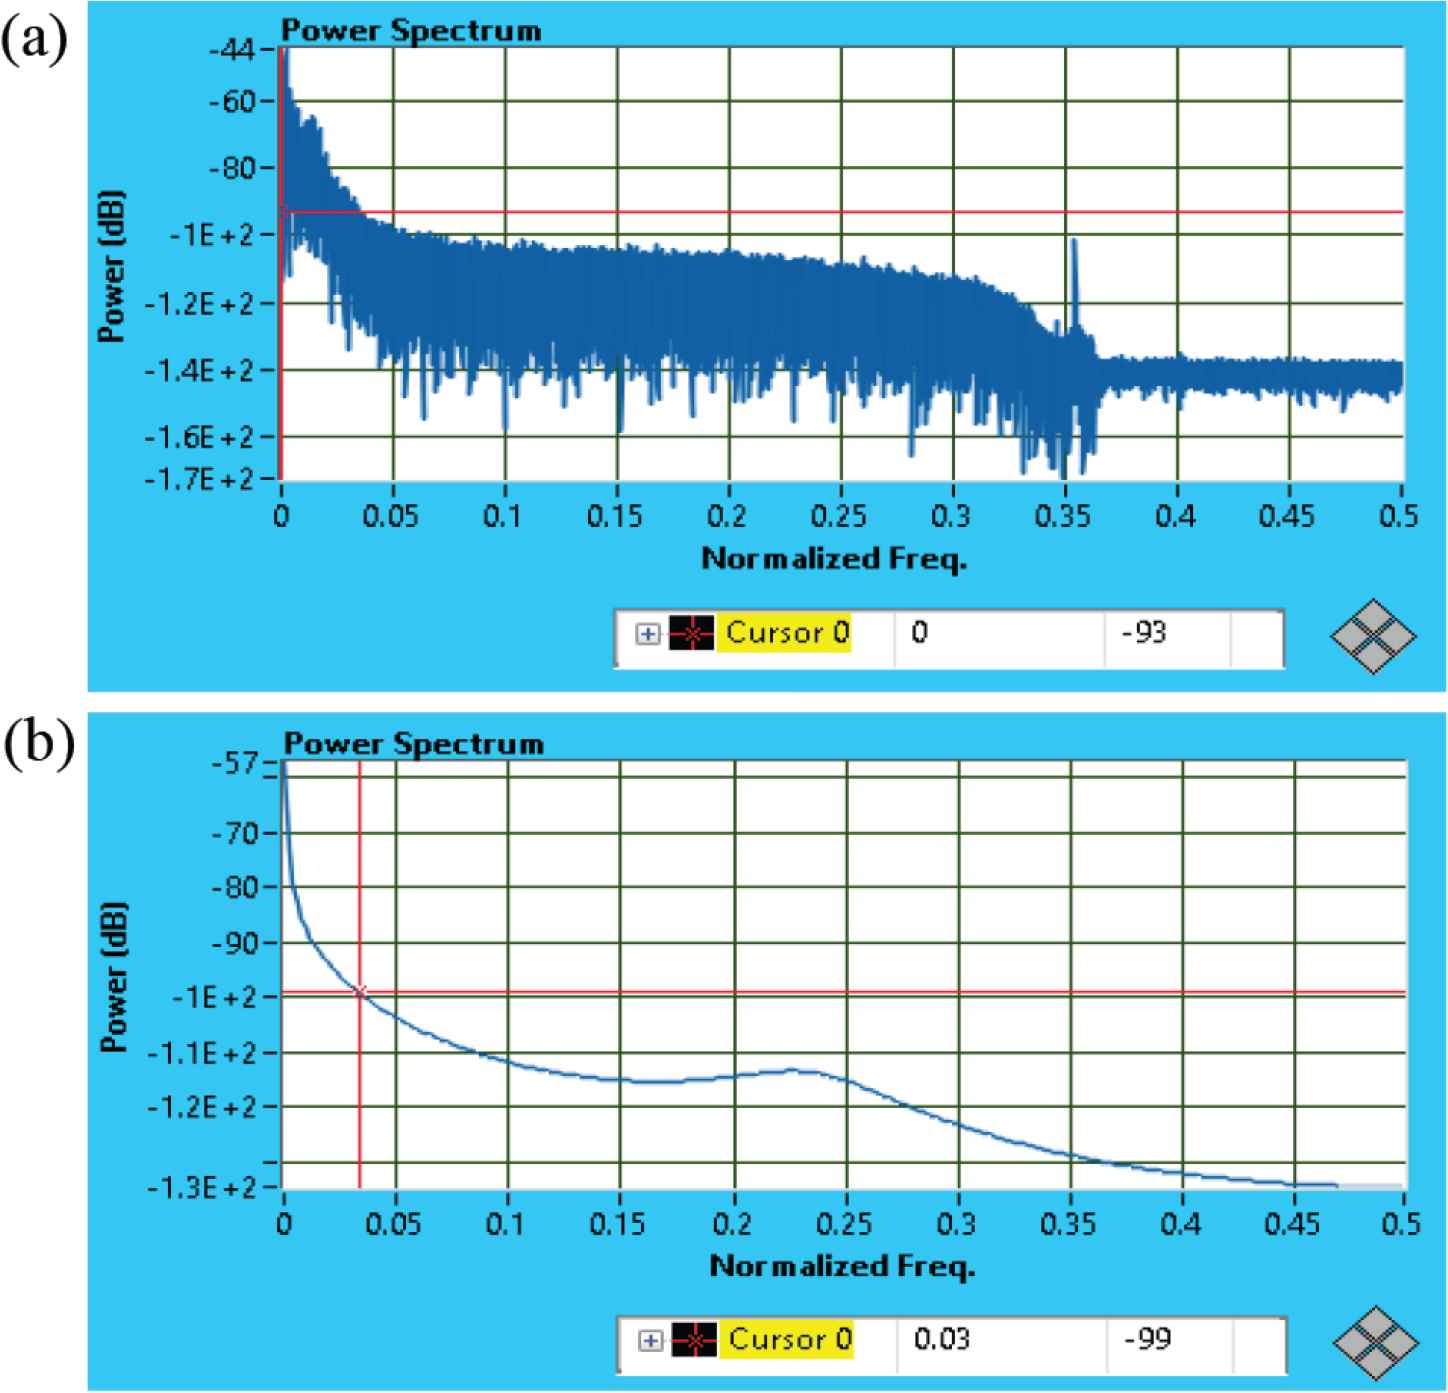
(a) Spectrum analysis of a crackle respiratory signal using FFT and (b) AR using model order of 4.
3.6. Spectrogram Analysis
A spectrogram is a visual representation of sound as shown in Figure 9 which represents respiratory spectrogram of a crackle fine respiratory signal. When it is shown higher on the display means higher sound. The colors of the spectrogram at any point corresponds to relative intensity of the sound at particular time and frequency at that point. Spectrogram provides more information because it is based on actual measurements of the changing frequency content of a sound over time. As shown in Figure 8 below the color table on the right side that can be changed from many options if desired.
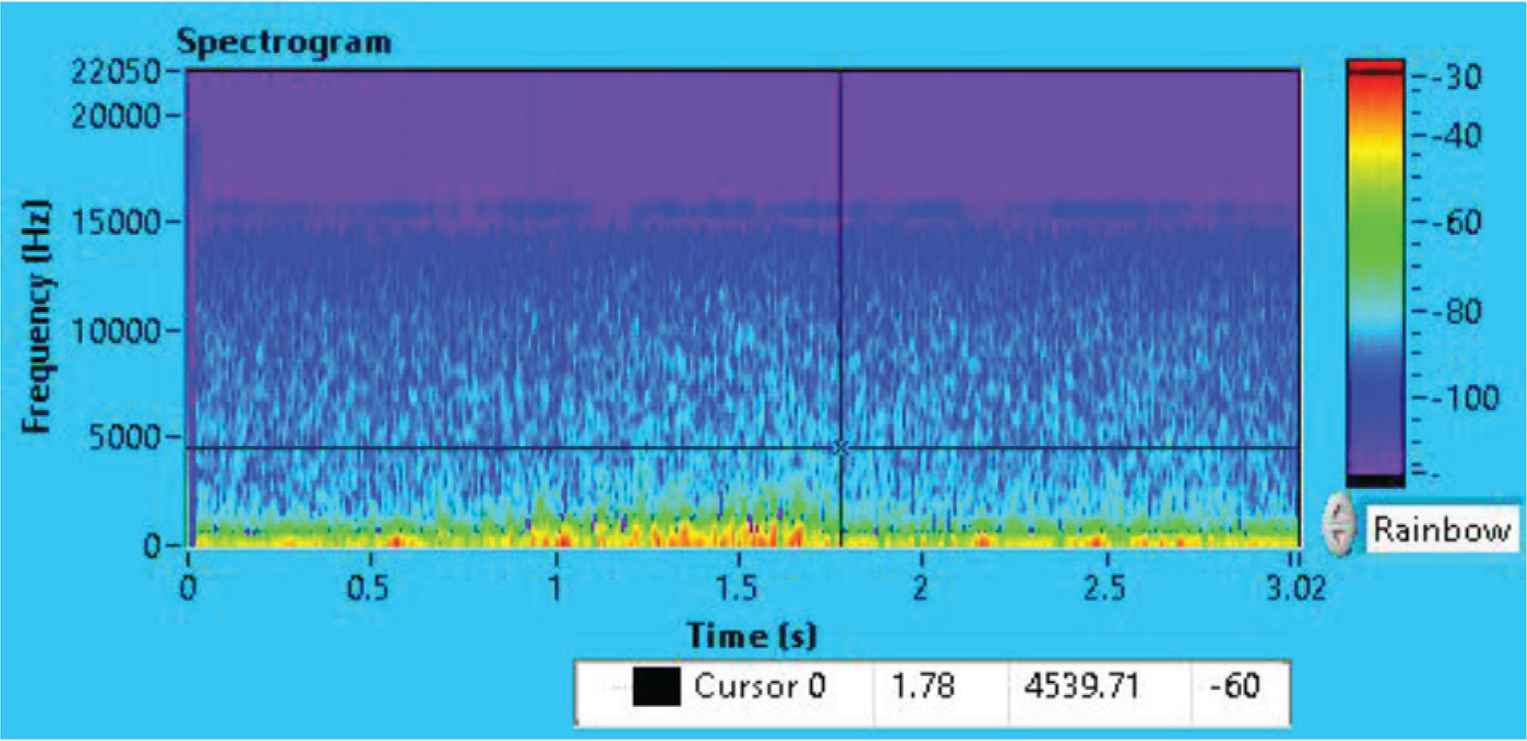
Spectrogram of a crackle respiratory signal.
3.7. Report Printing
The obtained results can be printed in a report format to be used by clinician as a reference for diagnosis purposes.
4. CONCLUSION
In this development work, a simple respiratory measurement with signal conditioning and ADC interfacing in addition to advanced digital signal processing software tools are used to develop our virtual respiratory system on computer which can work remotely. The hardware used was as standard as possible. This composition of components reduced the cost and minimized specialized and expensive hardware. The digital signal processing algorithms were developed to build virtual implementation of instrument that will enable us easily to modernize and upgrade our system by changing simply the software algorithms. Hence, clinician will get the up-to-date system to work with, taking in consideration capital and time resources. Our main features of our developed system discussed in this paper are flexibility, low cost and future improvement.
The developed system has been tested with real normal and abnormal respiratory signals and proved to be efficient system while dealing with many different conditions.
CONFLICTS OF INTEREST
The author declares they have no conflicts of interest.
ACKNOWLEDGMENT
This work is supported with my great appreciation to the Deanship of Scientific Research and the Research center of College of Applied Medical Sciences at King Saud University.
AUTHOR INTRODUCTION
Ali S. AlMejrad
 He received the B.Sc. with first honour in Electrical Engineering from King Saud University, Kingdom of Saudi Arabia, M.Sc. in Bioengineering from Strathclyde University, UK in 1987 and 1990, respectively; and the PhD in Medical engineering from Edinburgh University, UK, in 1996. He is currently an Associative Professor of Medical Engineering and Instrumentation in Biomedical Technology in Applied Medical Sciences College, KSU, KSA. His research interest includes Development of Biomedical Instrumentation and Intelligent Systems for Health Care using advanced Technologies. He is a member of IEEE and IPEM.
REFERENCES
Cite this article
TY  - JOUR
AU  - Ali S. AlMejrad
PY  - 2020
DA  - 2020/02/28
TI  - Design and Development of a Virtual System for Measurements and Analysis of the Respiratory Sounds for Diagnosis of Respiratory System
JO  - Journal of Robotics, Networking and Artificial Life
SP  - 250
EP  - 253
VL  - 6
IS  - 4
SN  - 2352-6386
UR  - https://doi.org/10.2991/jrnal.k.200221.006
DO  - 10.2991/jrnal.k.200221.006
ID  - AlMejrad2020
ER  -