
Autoencoder with Spiking in Frequency Domain for Anomaly Detection of Uncertainty Event
- DOI
- 10.2991/jrnal.k.200222.005How to use a DOI?
- Keywords
- Anomaly detection; autoencoder; data mining; factory automation
- Abstract
This paper proposes the autoencoder method with spiking raw data to the frequency domain to analyze and predict the anomaly case among the standard data set and compare it with original data. The dataset is the real-world data from factory automation. The combination of frequency domain and original data can improve the validity and accuracy in detecting an anomaly data. Therefore, analyzing time-series data using combination of autoencoder and the frequency domain can be efficient in detecting anomalies.
- Copyright
- © 2020 The Authors. Published by Atlantis Press SARL.
- Open Access
- This is an open access article distributed under the CC BY-NC 4.0 license (http://creativecommons.org/licenses/by-nc/4.0/).
1. INTRODUCTION
Anomaly detection in time-series is an important real-world problem. Nowadays, sensors and internet of things devices are ubiquitous and produce data continuously. While the data gathered by these devices is valuable and can provide meaningful insights, there is a growing need for developing algorithms that can process these data efficiently. Anomaly detection is applied in network intrusion detection, credit card fraud detection, sensor network fault detection, medical diagnosis and numerous other fields [1].
Among many anomaly detection methods, there are a few ways to reduce the dimensions of large data sets to ensure computational efficiency such as backwards selection, removing variables exhibiting high correlation, high number of missing values but by far the most popular is Principal Components Analysis (PCA). A relatively new method of dimensionality reduction is the autoencoder. Autoencoders although is quite similar to PCA but its autoencoders are much more flexible than PCA. Autoencoders can represent both liners and non-linear transformation in encoding but PCA can only perform linear transformation. Autoencoders are a branch of neural network which attempt to compress the information of the input variables into a reduced dimensional space and then recreate the input data set. Moreover, the autoencoders can apply dimension reduction in a hierarchical manner, obtaining more abstract features in higher hidden layers leading to a better reconstruction of the data [2].
In this paper, the autoencoder method with underlined spiking raw data has been proposed to detect any anomaly by frequency domain to analyze and predict. Moreover, we also compare and validate our proposed method with original data, which is from factory automation data and real-world data based on Area under the Curve (AUC), Precision (Pre), Recall (Rec) and F1-score criteria.
2. PROPOSED METHOD
We proposed the novel method using the autoencoder method with spiking raw data to the frequency domain to analyze and predict the anomaly case. Step-by-step procedure is as follows:
- 1.
Divide all datasets into two groups.
- 2.
For the second group, calculate the Fast Fourier Transform (FFT) of each dataset.
- 3.
Spike plot by using FFT values.
- 4.
Combine raw data and FFT values of each dataset. This is the input of the second group. For first group has only original data.
- 5.
Input both groups of all datasets into the autoencoder process.
Figure 1 describe the whole procedure algorithmically.
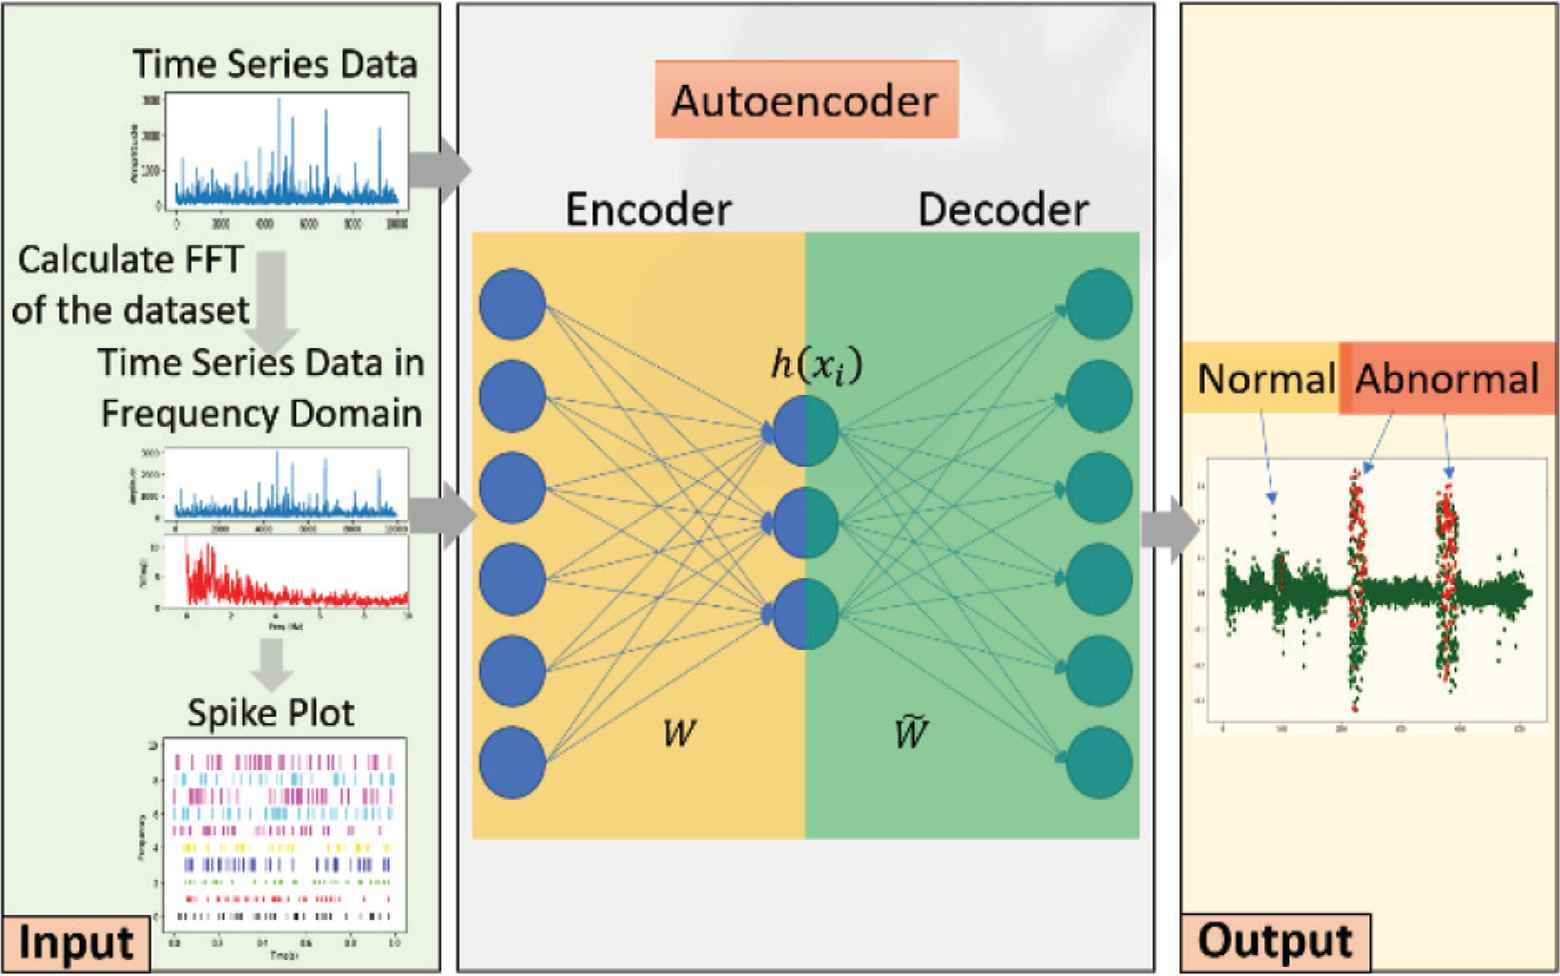
Architecture of the proposed method.
2.1. Autoencoder
Autoencoder neural network is an unsupervised machine learning algorithm that applies backpropagation, setting the target values to be equal to the inputs. Autoencoder consists of three components: encoder, code, and decoder. The encoder compresses the input and produces the code, the decoder then reconstructs the input only using this code. Given a data point
After training, autoencoder uses the reconstruction error as the anomaly score. The data with high anomaly score is considered to be anomalies, because only the normal data are used to train the autoencoder. The autoencoder will reconstruct normal data very well, while failing to do so with anomalous data the autoencoder has not encountered.
2.2. Frequency Domain (FFT)
Frequency-domain analysis is a tool of utmost importance in signal processing applications. Frequency-domain analysis is widely used in such areas as communications, geology, remote sensing, and image processing. While time-domain analysis shows how a signal changes over time, frequency-domain analysis shows how the signal’s energy is distributed over a range of frequencies.
Fast Fourier Transform is a mathematical technique for converting a signal from the time domain into the frequency domain. Signals on a flaw detector, on an oscilloscope or on an acoustic emission display are typically time domain signals showing how the amplitude varies with time. When transformed into the frequency domain, the display shows how the amplitude varies with the frequency. This display is often referred to as the frequency spectra of the signal. A sine wave of a single frequency in the time domain will give a single line at that frequency in the frequency domain. A spike in the time domain will give a spread of frequencies in the frequency domain.
The FFT computes the Discrete Fourier Transform (DFT) in an efficient manner. The DFT is defined given by
2.3. Spike Plot
Spikes represent any number of horizontal or vertical line segments with fixed or variable heights. It is usual to use in time series plots. They may also be useful in more domain-specific cases, such as visualizing spike trains for neurophysiology or spectrograms in physics and chemistry applications.
3. EXPERIMENTS
This section introduces the data sets we used and the evaluation metric we compared and evaluate to demonstrate the effectiveness of our proposed method in anomaly detection.
3.1. Data Sets
To illustrate the effectiveness of our method, time series data is got from UCR public data set [4]. More details about datasets are shown in Table 1. All datasets are given in time series form and every data point is manually labelled. All datasets, we choose the minority class as anomaly class. We split 20% of the data as test data.
| Datasets | Length | Number of instances | Anomaly ratio |
|---|---|---|---|
| SonyAIBORobotSurface2 | 65 | 980 | 0.38 |
| ItalyPowerDemand | 24 | 1096 | 0.49 |
| Wafer | 152 | 7164 | 0.11 |
Summary of the datasets
3.2. Performance Evaluation
We evaluate the accuracy of anomaly detection method using AUC of the receiver operating characteristic, Pre, Rec, and F1-score, which are defined as follows:
4. RESULTS AND DISCUSSION
We evaluate the anomaly detection performance for both spiking raw data and combine frequency domain using the autoencoder method. For the second group, we calculated FFT of all datasets and spike plot. Example of spike plot is shown in Figure 2. We showed the results of the wafer dataset.
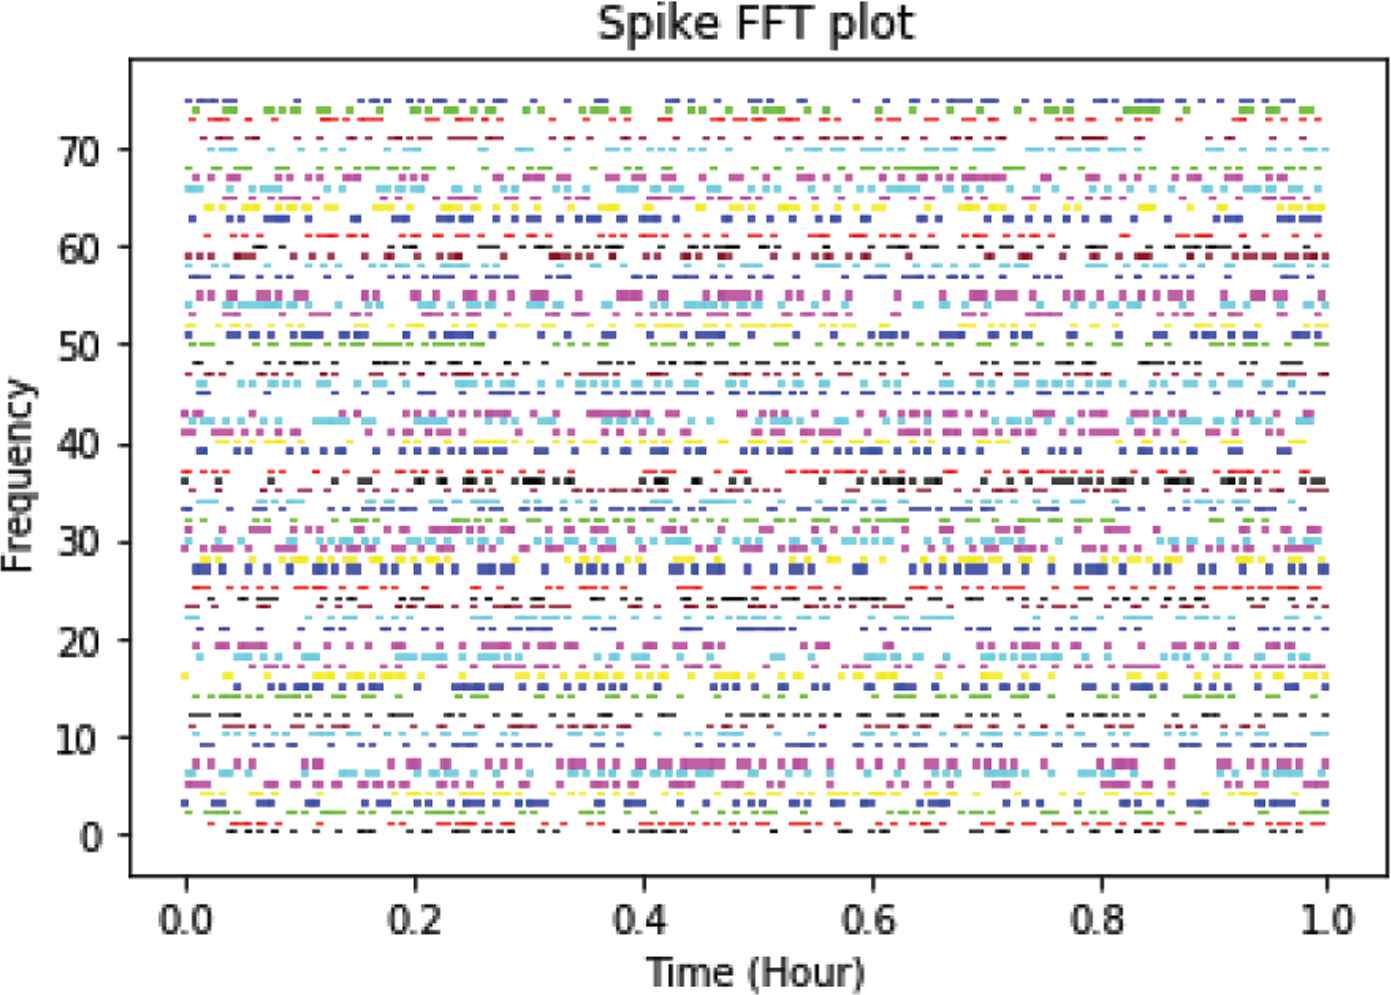
The example of spike plot.
We performed experiments on accuracy on three data sets and used AUC as the criterion. From Figure 3, the left column is original data and the right column is raw data combined with frequency domain. We can see that our method could outcome AUC value more than original data from all datasets. It shows that our method has good performance in anomaly detection for time series data.
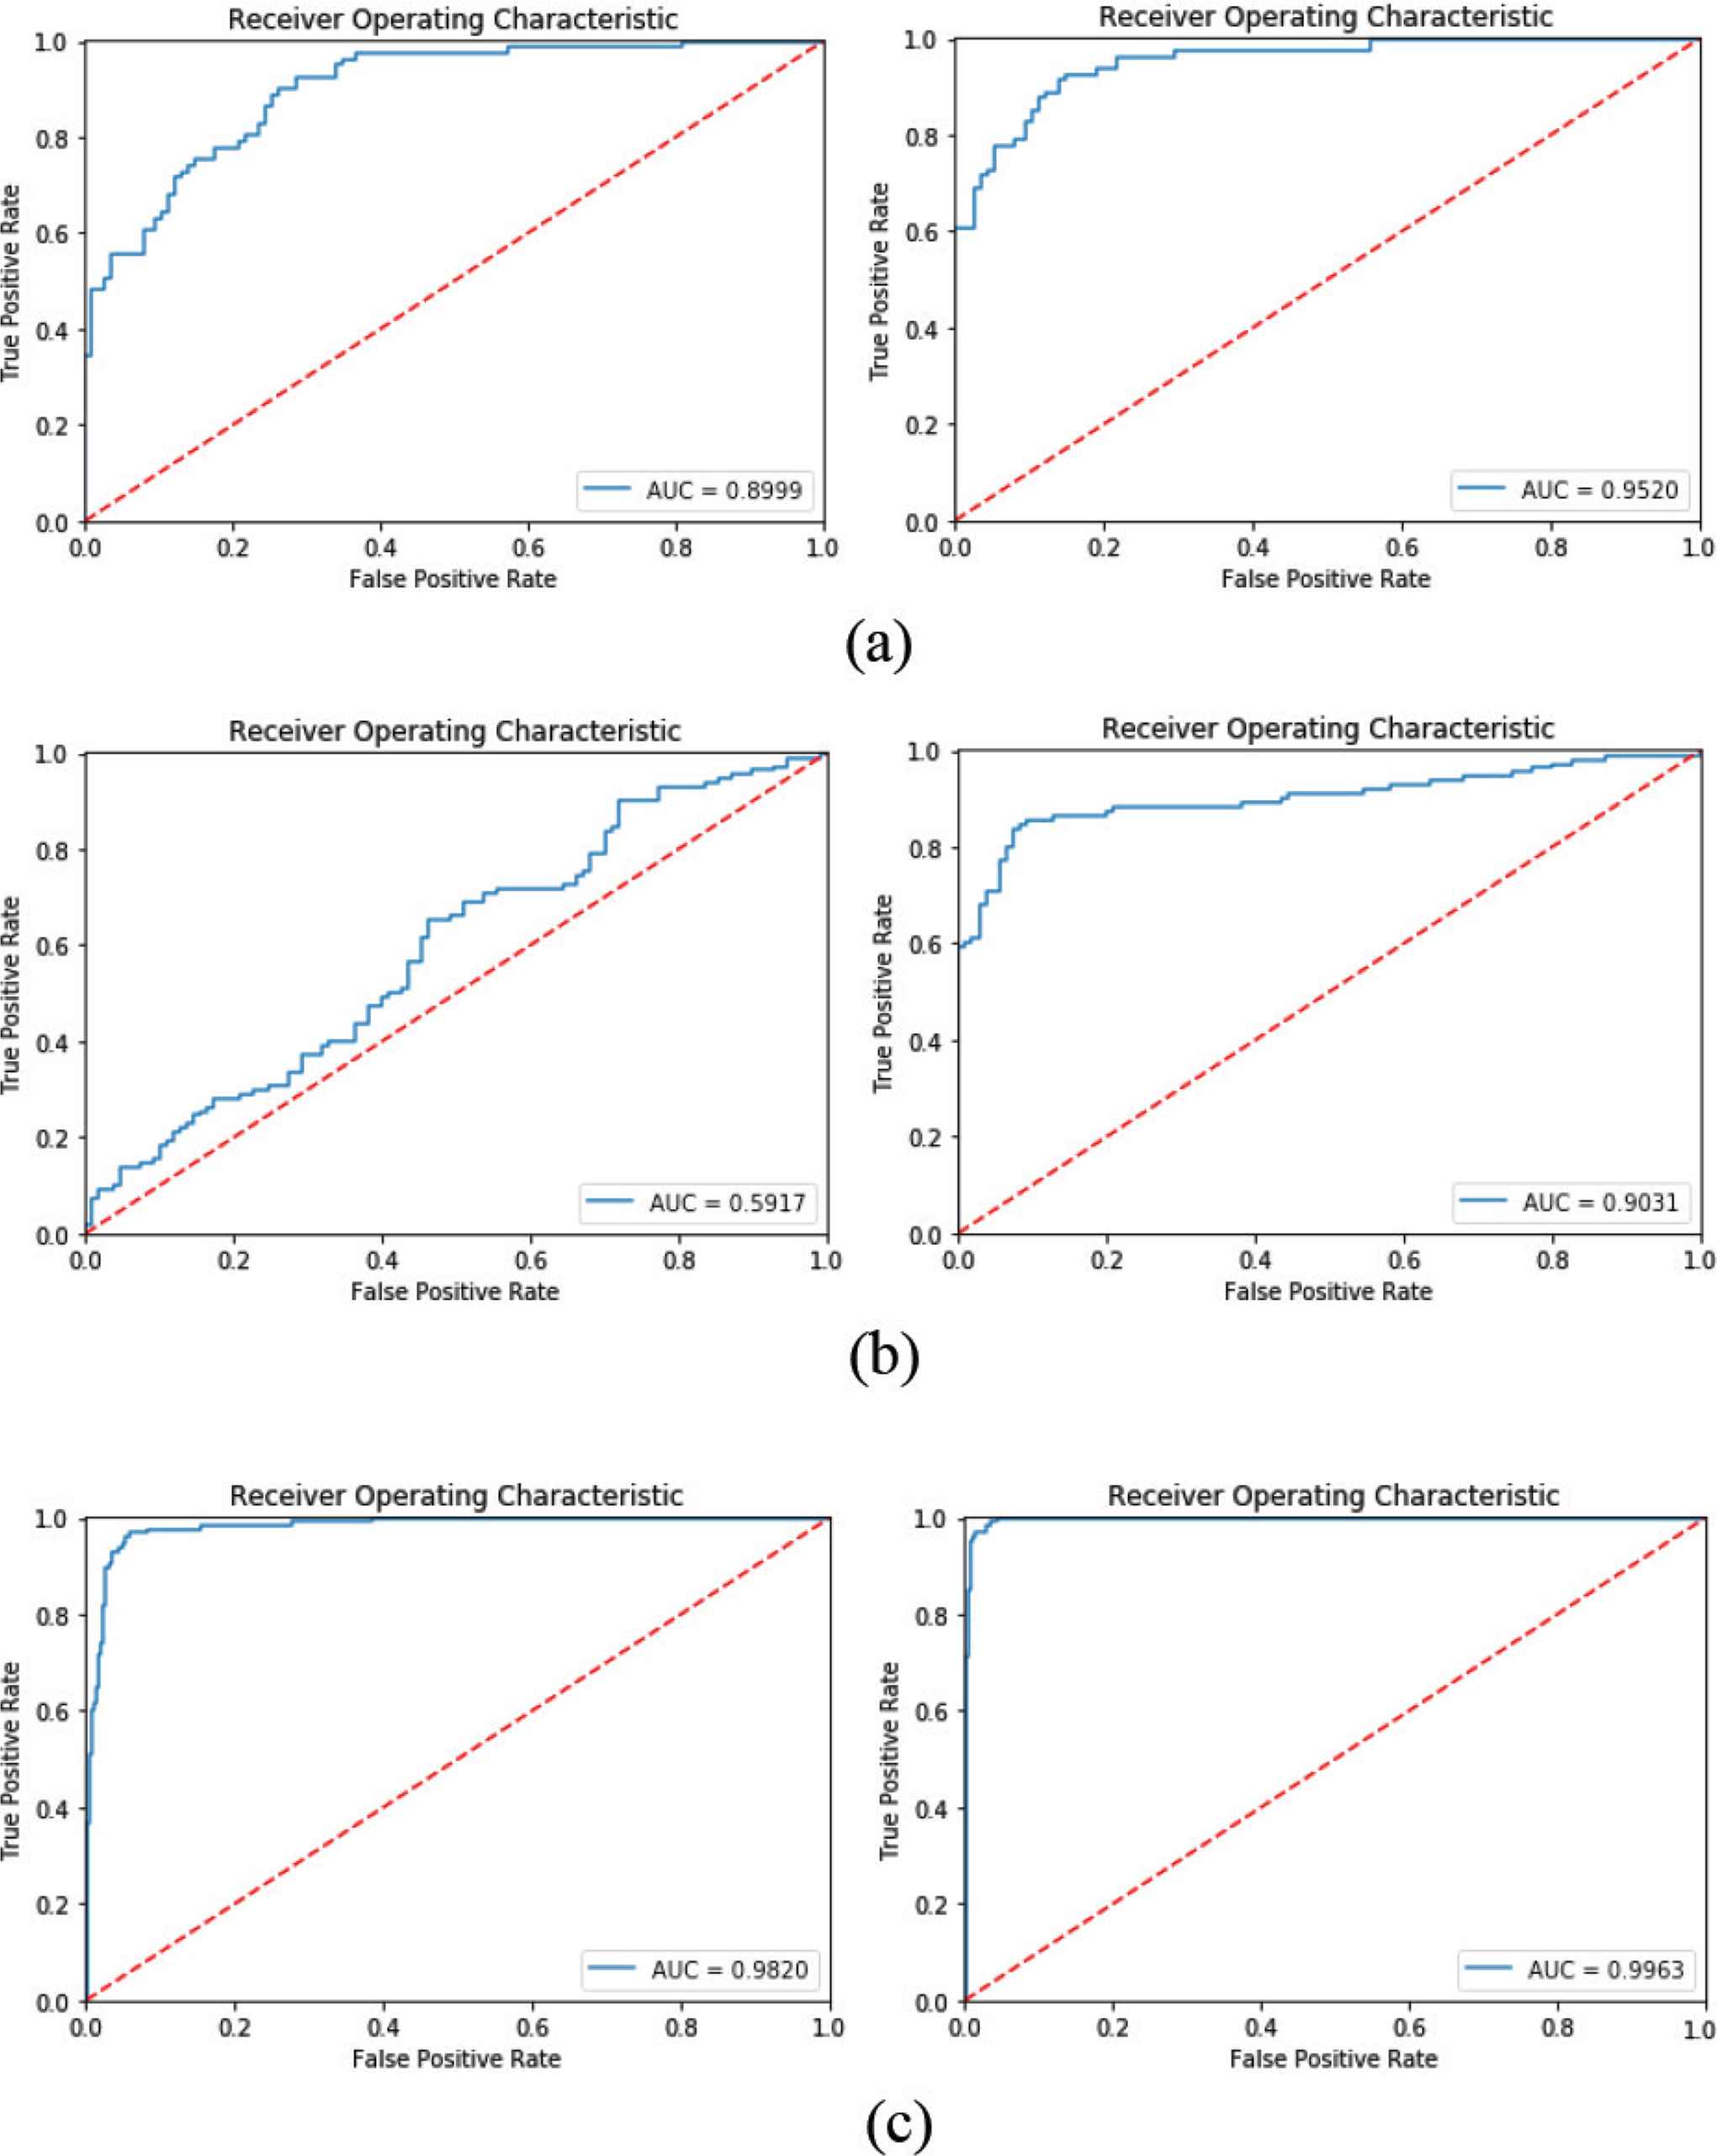
AUC comparisons between original data and combine frequency domain. (a) SonyAIBORobotSurface2. (b) ItalyPowerDemand. (c) Wafer.
The anomaly detection results and comparisons are summarized in Table 2. The results show that the method that we proposed outperformed the original data in all aspects and datasets. In particular, the wafer dataset gave recall is perfect.
| Datasets | Original data | Combine frequency domain | ||||||
|---|---|---|---|---|---|---|---|---|
| AUC | Precision | Recall | F1-score | AUC | Precision | Recall | F1-score | |
| SonyAIBORobotSurface2 | 0.8999 | 0.9043 | 0.7647 | 0.8287 | 0.9520 | 0.9565 | 0.8333 | 0.8907 |
| ItalyPowerDemand | 0.5917 | 0.7091 | 0.5166 | 0.5977 | 0.9031 | 0.9727 | 0.7279 | 0.8327 |
| Wafer | 0.9820 | 0.7349 | 0.9979 | 0.8464 | 0.9963 | 0.8008 | 1.0000 | 0.8894 |
Comparison between original data and combine frequency domain
5. CONCLUSION
In this paper, we propose the autoencoder method with original data compared with spiking raw data to the frequency domain to analyze and predict the anomaly case based on AUC, Pre, Rec and F1-score criteria. The evaluation results show that our proposed method in anomaly detection improves accuracy in all aspects. Therefore, analyzing time-series data in the frequency domain can be efficient in detecting anomalies for time series data.
In the future we will use the variational autoencoder with time series data to the frequency domain to analyze and predict the anomaly case and compare with the autoencoder method.
CONFLICTS OF INTEREST
The authors declare they have no conflicts of interest.
AUTHORS INTRODUCTION
Ms. Umaporn Yokkampon
 She received Master of Science degree in Applied Statistics from King Mongkut’s University of Technology North Bangkok in 2019. Presently she is a doctoral student in the Department of Computer Science and Systems Engineering at Kyushu Institute of Technology. Her research interests include data mining, anomaly detection and time series analysis.
Dr. Sakmongkon Chumkamon
 He received Doctor of Engineering degree from Kyushu Institute of Technology in 2017. He was a postdoctoral researcher at Guangdong University of Technology in 2017–2019. Presently he is a postdoctoral researcher in Kyushu Institute of Technology since 2019. His research interests include factory automation robots and social robots.
Prof. Abbe Mowshowitz
 He received the PhD degree from University of Michigan in 1967. He has been professor of computer science at the City College of New York and member of the doctoral faculty at the Graduate Center of the City University of New York since 1984. His current research interests lie in two areas are organizational and managerial issues in computing, and network science. In addition to teaching and research, He has acted as consultant on the uses and impacts of information technology (especially computer networks) to a wide range of public and private organizations in North America and Europe.
Prof. Eiji Hayashi
 He is a professor in the Department of Intelligent and Control Systems at Kyushu Institute of Technology. He received the PhD (Dr. Eng.) degree from Waseda University in 1996. His research interests include Intelligent mechanics, Mechanical systems and Perceptual information processing. He is a member of The Institute of Electrical and Electronics Engineers (IEEE) and The Japan Society of Mechanical Engineers (JSME).
REFERENCES
Cite this article
TY  - JOUR
AU  - Umaporn Yokkampon
AU  - Sakmongkon Chumkamon
AU  - Abbe Mowshowitz
AU  - Eiji Hayashi
PY  - 2020
DA  - 2020/02/29
TI  - Autoencoder with Spiking in Frequency Domain for Anomaly Detection of Uncertainty Event
JO  - Journal of Robotics, Networking and Artificial Life
SP  - 231
EP  - 234
VL  - 6
IS  - 4
SN  - 2352-6386
UR  - https://doi.org/10.2991/jrnal.k.200222.005
DO  - 10.2991/jrnal.k.200222.005
ID  - Yokkampon2020
ER  -