
Detecting Pedestrians and Their Walk Directions Using a MY VISION System
- DOI
- 10.2991/jrnal.k.200528.014How to use a DOI?
- Keywords
- MY VISION; ego-cameras; optical flow; MSC-HOG; HOF; pedestrian detection; walk direction
- Abstract
This paper proposes a pedestrian detection method using a MY VISION system. The MY VISION system is an image processing system using an ego-camera which a user of the system possesses, and it is expected to be the third eye of those who are aged, visually impaired or even those who are absorbed in a mobile-phone while walking. In the proposed method, a flow area different from camera movement is extracted first on the image provided from a user’s head-mounted camera. The area is a candidate area where pedestrians may exist. Multiple scale cell-histograms of oriented gradients features are then calculated to detect pedestrians in the area. Histograms of optical flow feature is further computed to recognize the moving direction of the detected pedestrians. The proposed method was examined its performance experimentally and satisfactory results were obtained.
- Copyright
- © 2020 The Authors. Published by Atlantis Press SARL.
- Open Access
- This is an open access article distributed under the CC BY-NC 4.0 license (http://creativecommons.org/licenses/by-nc/4.0/).
1. INTRODUCTION
When those who need visual assistance, such as aged or visually impaired, go out, or even for those absorbed in a mobile-phone while walking, there is a risk of colliding with obstacles, in particular, the pedestrians around him/her. To avoid the collision, automatic pedestrian detection using a computer vision system may be of great help. Most of the conventional pedestrian detection methods are a combination of Histograms of Oriented Gradients (HOG) and SVM [1], or they use LiDAR which can measure the distance to an object with high accuracy. However, these methods may fail in avoiding the collision, because they are normally used for vehicles and judge only the existence of the pedestrians in front of an ego-car. The information on walk direction of a detected pedestrian is necessary to avoid collision.
This paper proposes a method of detecting a pedestrian and judging its walk direction around a person who may need visual assistance. The method uses a MY VISION system which performs processing of images/videos provided from an ego-camera mounted on a user’s body or a head to obtain useful visual information from them. The system therefore functions as a substitute for a user’s eyes and a brain.
The method initially extracts an area having optical flow on the fed image. It then adopts Multiple Scale Cell (MSC)-HOG [2], an improved version of the original HOG [1], to know if a pedestrian is in the area, and, if it exists, it uses Histograms of Optical Flow (HOF) [3,4] to determine the walk direction of the pedestrian.
The proposed method is introduced in Section 2. Performed experiment is presented in Section 3. Discussion is given in Section 4, and the paper is concluded in Section 5.
2. PROPOSED METHOD
2.1. Outline of the Proposed Method
The outline of the proposed method is described in the following. Using MY VISION video, the location is extracted where the optical flow is different from the camera movement. The area is regarded as a candidate pedestrian area and its features are extracted. The feature is then applied to a pedestrian classifier to recognize whether or not there is a pedestrian, and if yes, its walk direction is recognized. For feature extraction, MSC-HOG [2] and HOF [3] features using Total Variation L1 (TV-L1) Optical Flow [4] are used. A classifier is designed using random forests [5].
2.2. MSC-HOG Feature
MSC-HOG features expanded from HOG features are used as the features for pedestrian detection. In the MSC-HOG feature, the position and size of cells are variable, and the cells are arranged along a human (edge intensity) model. One of the advantages of MSC-HOG feature over the existent HOG features is that, since a cell is not fixed to a single size, the cells that match the characteristics of a human body shape, e.g., a vertically long cell which may fit a human leg, is able to be placed. Then more effective features are derived from an image for human detection. Figure 1 shows an example of the cells arranged for human detection using MSC-HOG features.
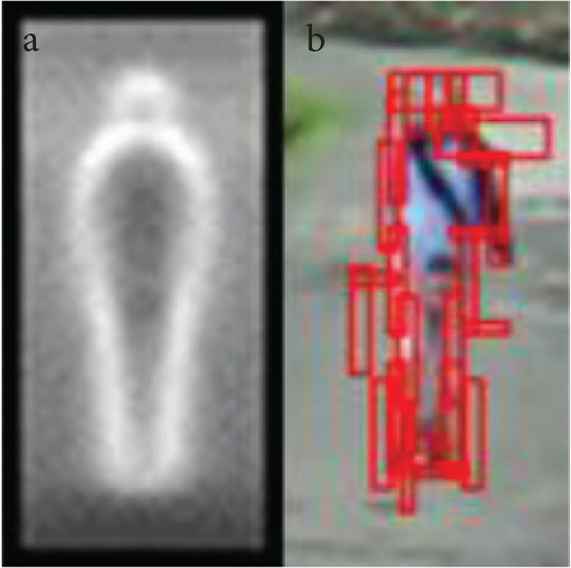
Shape and distribution of the cells in MSC-HOG features: (a) a human model, (b) an example of cell layout (red rectangles).
2.2.1. Human model
A large number of human images are collected in order to create a human model. A brightness gradient image is created from the collected image, and an average of all the brightness gradient images is calculated to create a human model. An example of a human model is given in Figure 1a.
2.2.2. Calculation of the feature
- (i)
Calculation of a gradient vector
The gradient intensity m(x, y) and direction θ(x, y) are calculated for each pixel in a cell by Equations (1–4).
Here, f(x, y) is the luminance value of an input image: fx(x, y) and fy(x, y) are the first derivatives of f(x, y) in the x- and the y-direction, respectively. - (ii)
Gradient histogram
Using the gradient intensity calculated by Equation (1), a gradient histogram is created with each cell. The gradient direction (0° ≤ θ(x, y) < 180°) is separated into nine directions by 20°, and the gradient vector of each pixel is assigned to one of the nine directions.
The gradient intensity of each pixel in a cell is added with each direction, and a histogram showing the frequency in each direction is created. The histogram value hist(j) in each direction in a cell is calculated by
Here celli represents the ith cell in a detection window. - (iii)
MSC-HOG features
Using Equation (5), a histogram of each cell is calculated. For the ith cell, a nine-dimensional feature vector
2.3. Histograms of Optical Flow
Histograms of optical flow feature is used for recognizing a pedestrian’s walk direction. HOF is a feature of optical flow vectors in a local area. An area of interest is separated into some overlapping blocks: a block is again separated into some cells with no overlap: a cell is represented by a histogram of optical flow vectors (referred to as flow vectors hereafter) which each pixel in the cell has.
A flow vector is calculated using two successive frames by TV-L1 Optical Flow [4] which produces dense optical flow. The constraint condition of TV-L1 Optical Flow is shown in Equation (9). The first term of Equation (9) is a constraint on the direction of a flow vector, whereas the second term is a constraint on the difference in luminance value between frames.
The calculation is repeated until the sum of these terms is minimized with respect to u ≡ u(x). Then u provides a flow vector.
A flow vector is characterized by its intensity and direction. Then the flow vectors in a cell can be represented by a histogram like HOG. In the proposed method, the flow direction θ (0° ≤ θ < 360°) is separated into 18 directions by 20°. Then the histogram has 18 bins. Let us denote the magnitude of bin j (j = 1, 2, …, 18) in the histogram of cell i (i = 1, 2, …, N) in block k (k = 1, 2, …, K) by (histj)ki. Then its value is calculated by Equations (1) and (5). Let us denote a 18-dimensional vector representing a histogram of cell i in block k by aki = (histj)ki = (h1, h2, …, h18)ki. Then we have a 18N-dimensional vector
Finally, an overall 18NK-dimensional optical flow vector xflow representing the flow feature of an interested area is defined by the following:
An example of a visualized TV-L1 Optical Flow image is shown in Figure 2. From successive images (a) and (b), a flow image (c) is obtained. Figure 2d depicts cells and blocks arrangement on the flow image.
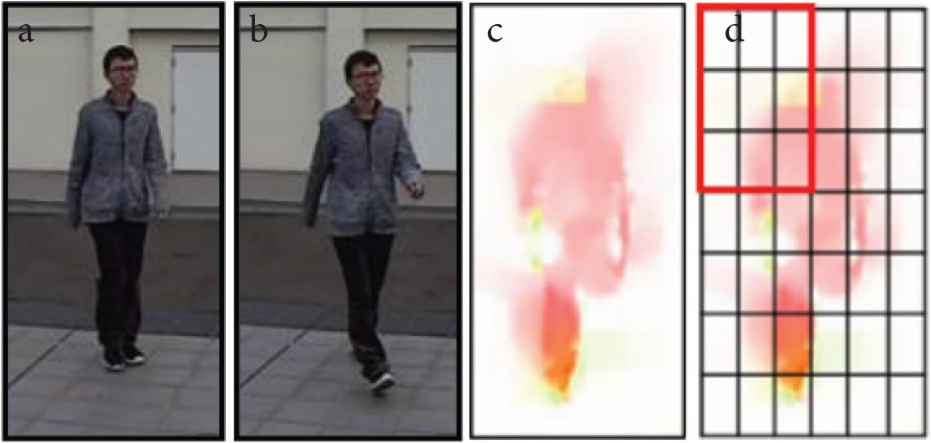
A flow image between two successive regions of interest: (a) image at time t, (b) image at t + Δ, (c) visualized flow, (d) an example of cell (black rectangle) and block (red rectangle) arrangement.
2.4. Extracting a Candidate Pedestrian Area
Candidate pedestrian areas are extracted using TV-L1 Optical Flow. First, a flow vector is calculated from two successive image frames. Second, the flow angle and intensity at each pixel are visualized using the HSV color system to create a flow image. Third, the flow image is first-order differentiated in the x-direction. This is to separate the pedestrian flow from the camera flow and to generate an edge image of the flow. Finally, the edge image is integrated into a single region by morphological closing process. A candidate area is then obtained in the form of a bounding box containing the area. The procedure is illustrated in Figure 3.
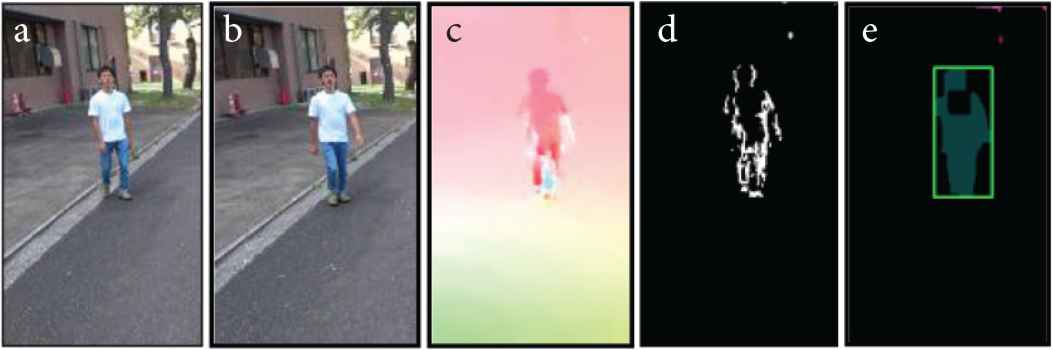
Finding a candidate pedestrian area: (a) image at time t, (b) image at t + Δ, (c) a flow image, (d) a flow edge image, (e) a candidate pedestrian area.
2.5. Recognition
For recognition, random forests [5] is used to design a classifier. In the recognition process, the MSC-HOG feature xHOG defined by Equation (8) is calculated on the candidate pedestrian area image, denoted by Acpa, and it is fed to the classifier to judge the existence of a pedestrian. If the judgment is affirmative, the HOF feature given by Equation (11) is calculated using Acpa(t) and Acpa(t + Δ). The resulting HOF feature xflow is then fed to the random forest classifier to recognize walk direction of the pedestrian in the image.
3. EXPERIMENTAL RESULTS
3.1. Experimental Setup
In order to confirm the effectiveness of the proposed method, we conduct two kinds of experiments; Exp_1: experiment on pedestrian detection using a prepared data set, and Exp_2: experiment on pedestrian detection and walk direction recognition using real video data. In Exp_1, a random forest classifier is trained by use of 3706 positive images (1290 from INRIA Person Dataset [6] and 2416 from our own dataset) and 5000 negative images from INRIA dataset. Our dataset contains walking person images that are not much included in INRIA dataset. Test data is composed of 2252 positive images (a half from INRIA and another half from our dataset) and 3000 negative images from INRIA dataset.
On the other hand, in Exp_2, real videos are used for a pedestrian detection and its walk direction recognition. A classifier for detecting a pedestrian is the one designed in Exp_1. The walk direction recognition classifier is trained using HOF feature vectors obtained from two consecutive images set (front left: 618 [309 image pairs], front: 544 [272 pairs], front right: 618 [309 pairs]).
3.2. Evaluation Method
3.2.1. Experiment 1
Recall, precision, F-measure and the recognition rate are used for evaluating pedestrian detection. They are abbreviated as Re, Pre, F and Rec, respectively.
3.2.2. Experiment 2
Once a candidate pedestrian area is extracted from an input image, it is provided in the form of a bounding box denoted by A. It is compared to the ground truth box AGT by
If IoU > γ (γ = 0.4 in the experiment), A is finally recognized as it includes a pedestrian and denoted as Ap. Ap is further fed in the walk direction classifier and judged its direction. The result is compared to the correct direction which AGT holds as a label. These results are evaluated by the detection rate (Det) and the accuracy (Acc) defined by the following equations:
In Equation (14), Apd is the Ap whose direction matched to the label of corresponding AGT.
3.3. Results
3.3.1. Experiment 1
Table 1 shows the confusion matrix of the pedestrian recognition experiment. The evaluation values are as follows: Re = 0.933, Pre = 0.914, F = 0.923, Rec = 0.934.
| Predicted class | |||
|---|---|---|---|
| Positive | Negative | ||
| Actual class | Positive | 2101 | 151 |
| Negative | 198 | 2802 | |
Confusion matrix of Exp_1
3.3.2. Experiment 2
In this experiment, several parameters are chosen as follows:
- (i)
Number of pedestrians: 1, 2, 3 in a video.
- (ii)
Walk speed of a user and pedestrians: normal, fast. Note that a user (an ego-camera holder) also walks.
- (iii)
Walk directions of pedestrians: from front left, front, front right to the user.
Experiments were performed with the combination of above parameters. The result on the case of a single pedestrian is shown in Table 2. All the three cases of (i) are put together in Table 3.
| Front left | Front | Front right | Average | |
|---|---|---|---|---|
| Det | 0.817 | 0.737 | 0.898 | 0.817 |
| Acc | 0.674 | 0.473 | 0.573 | 0.573 |
Pedestrian detection rate and walk direction recognition rate in the case of a single pedestrian in a video
| No. pedestrians | Det | Acc |
|---|---|---|
| 1 | 0.817 | 0.573 |
| 2 | 0.756 | 0.599 |
| 3 | 0.583 | 0.617 |
Average pedestrian detection rate and walk direction recognition rate to the number of pedestrians in a video
Some experimental results are given by images in Figure 4, in which (a) shows the case of a single pedestrian walking from front left to a user. A blue box surrounding him indicates that his walk direction is from front left to the user, i.e., the direction is correctly recognized. Three pedestrians’ case is given in Figure 4b, in which a red box represents a walk direction from front right to the user, whereas a green box is that from front to the user. The walk directions are almost correctly recognized.
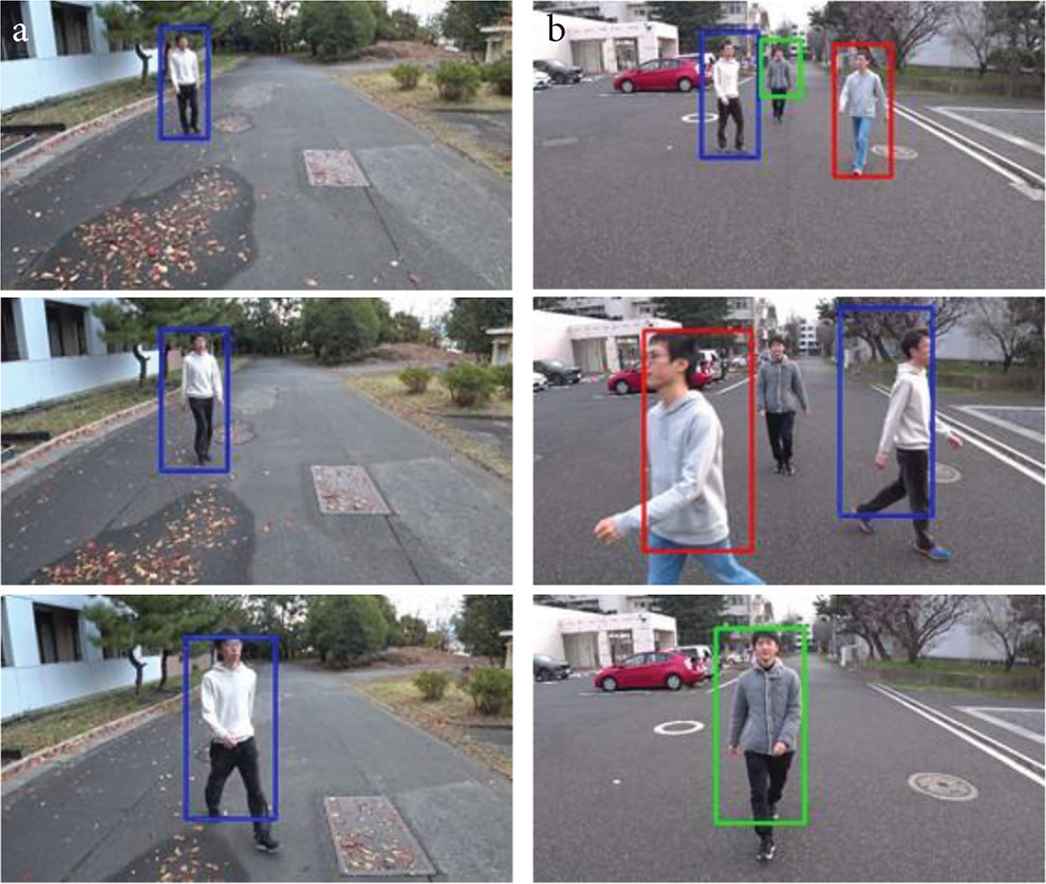
Experimental results: (a) case of a single pedestrian, (b) case of three pedestrians.
4. DISCUSSION
In this paper, a method was proposed of detecting pedestrians and judging their walk directions by a MY VISION system which a user holds. The system detects pedestrians from a video captured by an ego-camera of a user. It is supposed to be used in a future by those who need visual assistance in a daily life. This claims the importance of the study. The performed experiments gave expecting results as shown in Figure 4. Some issues, however, need to be further investigated to improve the method.
In Exp_1, the pedestrian detection rate was 93.4% which is reasonable. INRIA Person Dataset mostly provides standing person images and not walking person images. So authors’ own dataset containing human walk images was added in the training data. As one may know, a walking motion has two main patterns; a legs spread pattern and a legs closed pattern. The latter occurs when both legs cross and it is similar to a standing pattern. The training data prepared in Exp_1 is therefore stands to reason. The amount of the training data, however, needs to be increased to raise the detection rate more.
As shown in Table 2, the average pedestrian detection rate is higher than 80%, but the average walk direction recognition rate is still in the lower level. This means that the flow vector, xflow, has not extracted directional information reliably from a flow image yet. The value γ, the threshold of Equation (12), may be further examined.
Table 2 also shows that frontal direction is difficult to judge its direction compared to other directions. This is because the frontal direction provides smaller flow vectors than diagonal direction. Instability of direction recognition in this case is seen in Figure 4b. Spacing between successive image frames in the calculation of a flow vector needs further study.
As seen in Table 3, the detection rate of a pedestrian, Det, is decreasing as the number of pedestrians increase. This is understandable, because it is not very simple to find candidate pedestrian areas when pedestrians cross or overlap each other. Tracking of moving objects needs to be considered in addition to the optical flow analysis. On the other hand, walk direction recognition rate, Acc, is not very different among the three cases.
As for (ii), walk speed, no particular difference was observed in the results. This may be because there was not a significant difference between the used normal and fast speed. Larger difference in walk speed between an approaching pedestrian and a user may be advantageous in segmenting a candidate pedestrian area from a flow image.
5. CONCLUSION
In this paper, we proposed a pedestrian detection method including walking direction recognition using a MY VISION system. For this purpose, the MSC-HOG feature and the HOF feature by TV-L1 Optical Flow were introduced. The experiments on pedestrian detection and walk direction recognition using the proposed method gave expecting results. The issues for further study include parameter tuning in optical flow calculation and pedestrian detection, employment of moving object tracking, along with increasing training data in designing classifiers. One of the application fields of the proposed method may be the third eye system for those who need visual assistance such as elderly or visually impaired to avoid collision with pedestrians on the way.
CONFLICTS OF INTEREST
The authors declare they have no conflicts of interest.
ACKNOWLEDGMENT
This work was supported by JSPS KAKENHI Grant Number 25350477.
AUTHORS INTRODUCTION
Prof. Joo Kooi Tan
 She is presently with Department of Mechanical and Control Engineering in Kyushu Institute of Technology as a Professor. Her current research interests include three-dimensional shape/motion recovery, human detection and its motion analysis from videos. She was awarded SICE Kyushu Branch Young Author’s Award in 1999, the AROB Young Author’s Award in 2004, Young Author’s Award from IPSJ of Kyushu Branch in 2004 and BMFSA Best Paper Award in 2008, 2010, 2013 and 2015. She is a member of IEEE, The Information Processing Society, The Institute of Image Electronics Engineers, and The Biomedical Fuzzy Systems Association of Japan.
Mr. Kenta Hori
 He obtained B.E. and M.E. from Kyushu Institute of Technology. His research includes computer vision, pedestrian detection and machine learning.
Prof. Seiji Ishikawa
 He graduated Tokyo University and was awarded BE, ME and PhD there. He is now Professor Emeritus, Kyushu Institute of Technology. He was Visiting Researcher of The University of Sheffield, UK, and Visiting Professor of Utrecht University, NL. Professor Ishikawa is an active researcher in the field of visual sensing. His research interests include human motion recovery, description and recognition. He was awarded The Best Paper Award in 2008, 2013 and 2015 from Biomedical & Fuzzy System Association, Japan. He is a member of IEEE.
REFERENCES
Cite this article
TY  - JOUR
AU  - Joo Kooi Tan
AU  - Kenta Hori
AU  - Seiji Ishikawa
PY  - 2020
DA  - 2020/06/04
TI  - Detecting Pedestrians and Their Walk Directions Using a MY VISION System
JO  - Journal of Robotics, Networking and Artificial Life
SP  - 137
EP  - 141
VL  - 7
IS  - 2
SN  - 2352-6386
UR  - https://doi.org/10.2991/jrnal.k.200528.014
DO  - 10.2991/jrnal.k.200528.014
ID  - Tan2020
ER  -