
Defect Detection of Micro-Precision Glass Insulated Terminals
- DOI
- 10.2991/jrnal.k.210521.005How to use a DOI?
- Keywords
- Micro-precision glass insulated terminal; improved Faster R-CNN; missing block detection
- Abstract
Micro-precision Glass Insulated Terminals (referred to as glass terminals) are the core components used in precision electronic equipment and are often used for electrical connections between modules. As a glass terminal, its quality has a great influence on the performance of precision electronic equipment. Due to the limitations of materials and production processes, some of the glass terminals produced have defects, such as missing blocks, pores and cracks. At present, most of the defect detection of glass terminals is done by manual inspection, and rapid detection easily causes eye fatigue, so it is difficult to ensure product quality and production efficiency. The traditional defect detection technology is difficult to effectively detect the very different defects of the glass terminal. Therefore, this paper proposes to use deep learning technology to detect missing blocks. First, preprocess the sample pictures of the missing block defects of the glass terminal, and then train the improved Faster Region-CNN deep learning network for defect detection. According to the test results, the accuracy of the algorithm in detecting missing defects in the glass terminal is as high as 93.52%.
- Copyright
- © 2021 The Authors. Published by Atlantis Press B.V.
- Open Access
- This is an open access article distributed under the CC BY-NC 4.0 license (http://creativecommons.org/licenses/by-nc/4.0/).
1. INTRODUCTION
Micro-precision glass insulated terminals are widely used in high-precision electronic equipment in the aerospace field. The performance of the glass terminal has a huge impact on the operation of the equipment. If there is no strict inspection for defects before using glass terminals, it will cause huge safety hazards to the reliability of high-precision electronic equipment, bringing about serious losses and consequences [1].
Due to the limitation of production level and detection methods, some produced glass terminals have defects such as missing blocks, pores, and cracks. The difficulties in defect detection are mainly three points: (1) The complex imaging background of the defects contains a variety of interference noise; (2) The shape, size, and location of defects are diverse; (3) Due to the different locations, sizes and shapes of missing blocks or pore defects, various defects will show greater differences. Therefore, this paper proposes to use deep learning technology to detect missing blocks [2]. Due to the small number of samples, the Deep Convolution Generative Adversarial Networks (DCGAN) algorithm is used for sample expansion [3] before training. In this paper, the original Faster Region-based CNN (Faster R-CNN) model is improved, and Distance Intersection over Union (DIOU) is used in the Region Proposal Network (RPN) network instead of the original Intersection over Union (IOU) to solve the special problem. In the case of the constant IOU value, in the process of minimizing the distance from the center point of the bounding box, the bounding box can converge faster. The improved Faster R-CNN model is used to detect the missing block defects of the glass terminal, and the detection results are compared with the most common models [including Single Shot MultiBox Detector (SSD), YOLOv3 and the original Faster R-CNN]. The experimental results show that the improved the Faster R-CNN model has higher detection accuracy.
2. IMAGE ACQUISITION AND ANNOTATION
2.1. Image Acquisition
The equipment used for image acquisition and photography is the CCD 540TVL (High Resolution B/W Black and White Camera) carried by the MVP400CNC automatic image measuring instrument; the working distance is 86 mm; The glass terminal image shooting method adopts the vertical shooting mode of the eight-zone light source; the collection condition is strong light; the magnification during shooting is 1.0 * 30.77.
2.2. Data Annotation
Figure 1 is a schematic diagram of the missing block defect of the glass terminal. This article uses labelImg software for labeling. After labeling, an XML file will be generated, which can be used for Faster R-CNN [4] training.
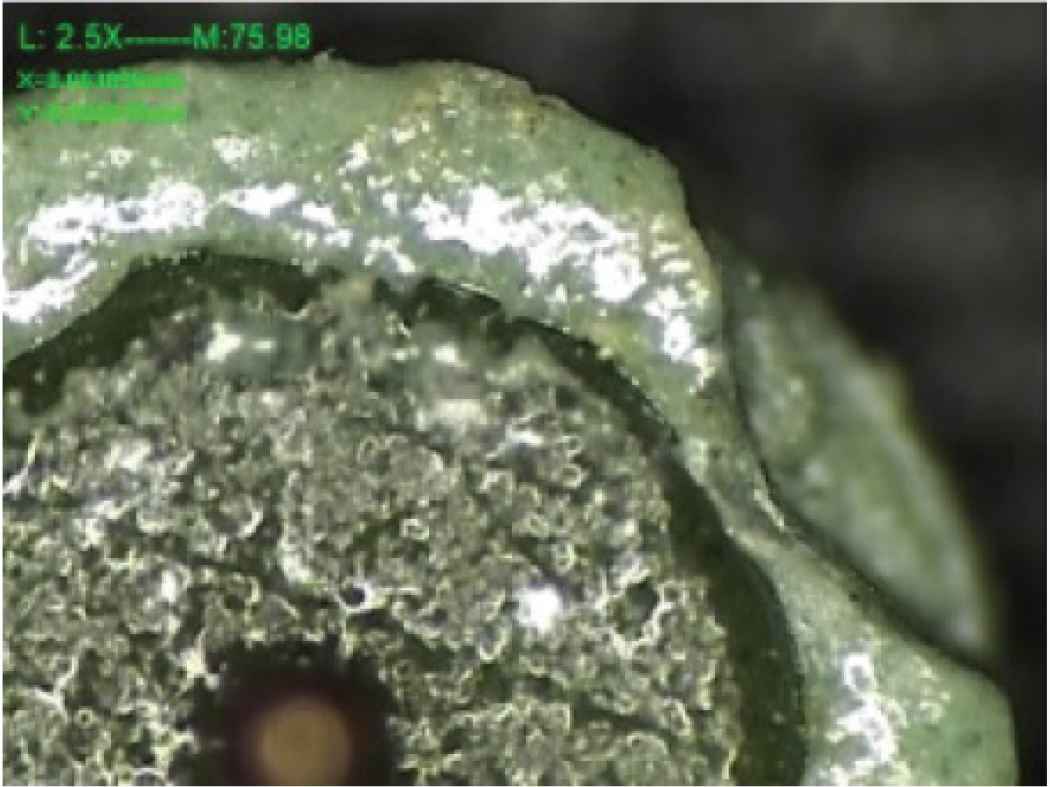
Picture of missing block defect.
The labelImg labeled glass terminal is shown in Figure 2. The XML file saves information such as the name of the annotated picture and the annotation frame. The coordinates of the annotation frame are based on the upper left corner of the glass terminal image as the origin, and the right and lower sides of the origin represent the positive x- and y-axis directions respectively.

LabelImg marking glass terminal and missing block defects.
3. FASTER R-CNN ALGORITHM
3.1. Feature Extraction Network
The feature extraction [5] network used in this article is ResNet50, and its structure is mainly composed of Conv Block and Identity Block [6,7]. Among them, the Conv Block cannot be directly connected to the network. Its main function is to change the dimension of the network, and the dimensions of the input and output results are different. The identity block can be connected to the network, and its main function is to deepen the network depth, and the input and output results have the same dimensions.
ResNet50 is mainly composed of residual blocks. Its structure is shown in Figure 3. First, it performs a convolution operation with 64 convolution kernels of size 7 * 7 and step size of 2, and then performs a maximum pooling with a pooling kernel size of 3 * 3 Then, after going through 3, 4, 6, and 3 residual blocks, respectively, 1 * 1 and 3 * 3 represent the size of the convolution kernel of the residual block, and 64, 256 and so on represent the number of convolution kernels, respectively.
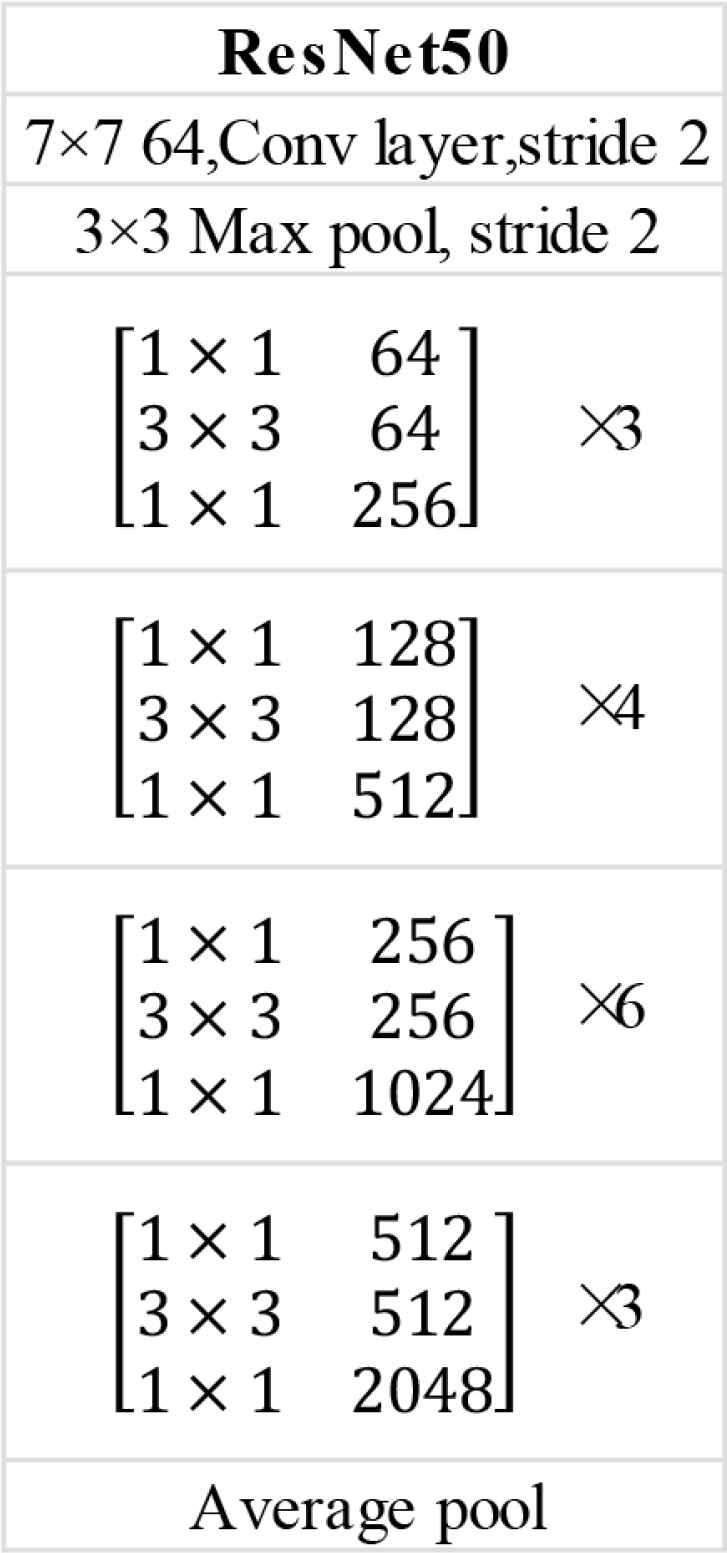
ResNet50 network structure.
3.2. Region Proposal Network
Region proposal network is the region generation network. By using d n * n window sliding on the shared feature map extracted by the feature extraction network [8], it is mapped into a d-dimensional feature vector, and k anchors are generated on each pixel. These anchors perform the regression and classification operations of the prior box respectively. Assuming that there are k anchors for each pixel on the shared feature map, it is necessary to predict these k pixels, and the classification operation can get 2k outputs, indicates whether the k area contains the target. The regression operation refers to the calculation of continuously approaching the label frame with k anchors. This operation can get 4k outputs. The k anchors get the center point coordinates and width and height information of the suggested frame (x, y, w, h), the process of getting the suggestion box from anchor is also called anchor parameterization. Taking a pixel of the current shared feature map as the center, k anchors with different aspect ratios and sizes are generated, and their aspect ratios and sizes are represented by ratio and scale, respectively. For a feature vector of size w * h, there are a total of w * h * k anchors. The structure of the RPN network is shown in Figure 4.
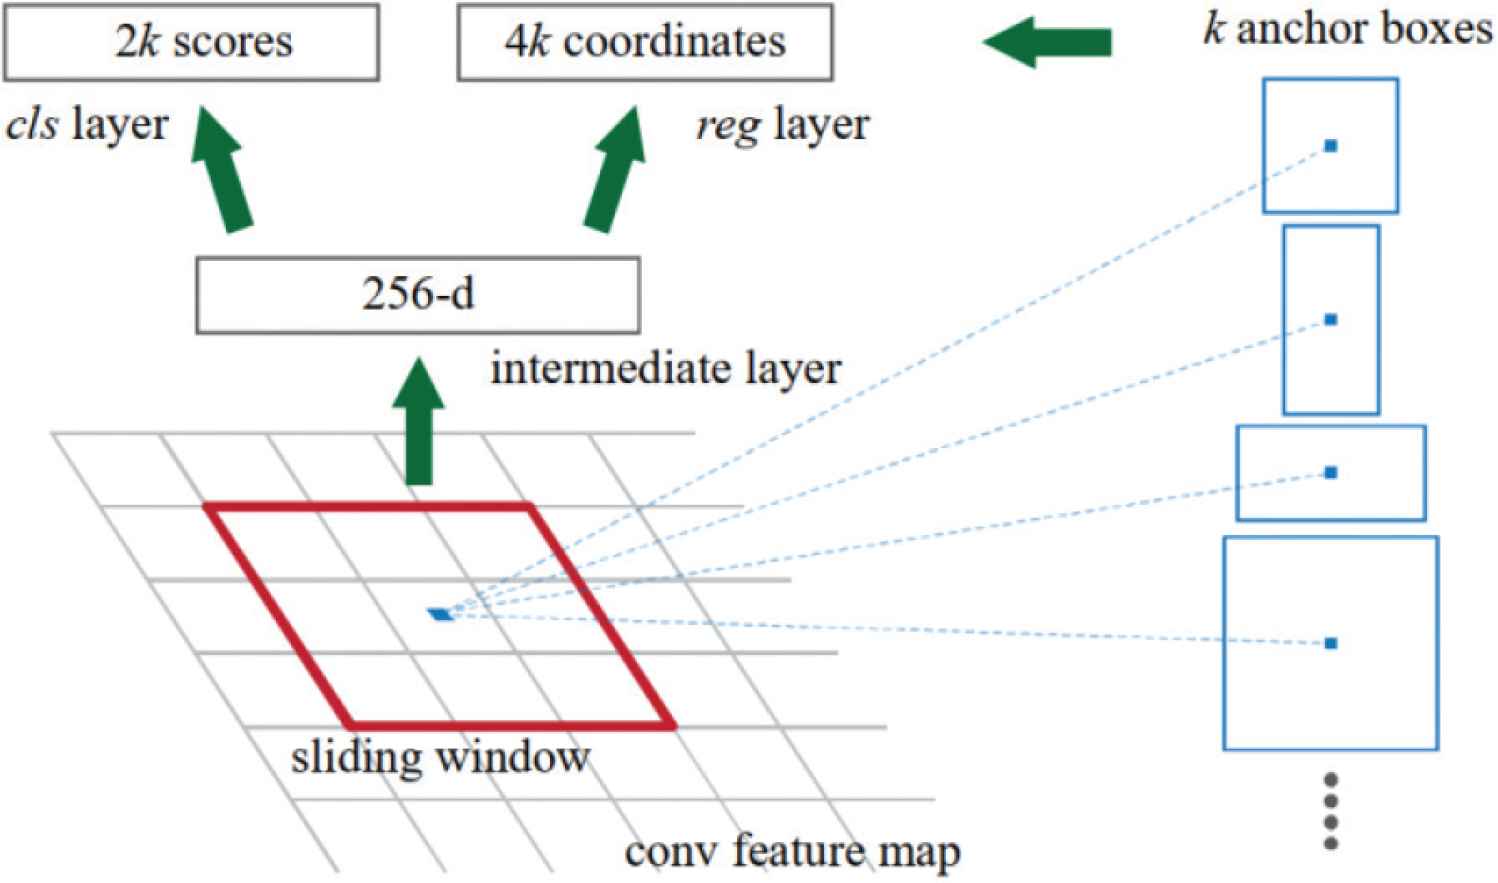
RPN network structure.
3.3. RPN Loss Function
The overall loss function of RPN is
It can be seen from
The regression process uses four coordinates:
In the RPN network, the obtained prediction frames need to be screened. This process uses DIOU and non-maximum suppression methods. The following is an analysis of these two methods.
3.4. Distance Intersection Over Union
Intersection over union is the ratio of the overlap area of the label box and the prediction box to the intersection area of the label box and the prediction box, as shown in Figure 5. Assume that the red box is the missing block defect marked on the glass terminal, the area is S1, and the yellow box is the missing block defect predicted at the end of the glass terminal, and the area is S2, and the area of the overlapping part of the label frame and the prediction frame is S3.

IOU prediction box and label box.
For this image, the calculation of the IOU of the yellow prediction frame is shown in Equation (7).
Since there are a total of 38 * 38 * 9 anchors in the shared feature map part, there may be many prediction boxes with a higher degree of coincidence for each label box, and the best one should be selected from this higher degree of coincidence prediction boxes. For the prediction frame of, it is necessary to use IOU as one of the criteria for non-maximum suppression.
However, IOU has an obvious shortcoming. When the prediction box and the real box are in a containment relationship and a separation relationship, the IOU cannot clearly indicate the specific positional relationship of the two boxes, because the value of formula (7) will not change at this time. This article changes the IOU used in the original model to DIOU. DIOU introduces the distance between the center points of the two boxes and the outer bounding box, which solves the problem of the constant IOU value under special circumstances. In the process of minimizing the distance between the center points of the bounding box, it can make the bounding box converge faster. The DIOU loss diagram is shown in Figure 6, where the green and red boxes represent the target boxes, the yellow boxes represent the prediction boxes, and the blue dashed box represents the smallest box covering the two bounding boxes.

DIOU schematic.
The calculation formula of DIOU is shown in formula 8.
3.5. Non-maximum Suppression
Non-maximum suppression refers to removing redundant prediction boxes in the picture. Each labeled box in the picture may have multiple prediction boxes, as shown in Figure 7a. These prediction boxes intersect with the labeled boxes and have a higher prediction score. The threshold is set, but too many prediction frames will cause redundancy, so it is necessary to perform non-maximum suppression to eliminate redundant prediction frames in the picture.
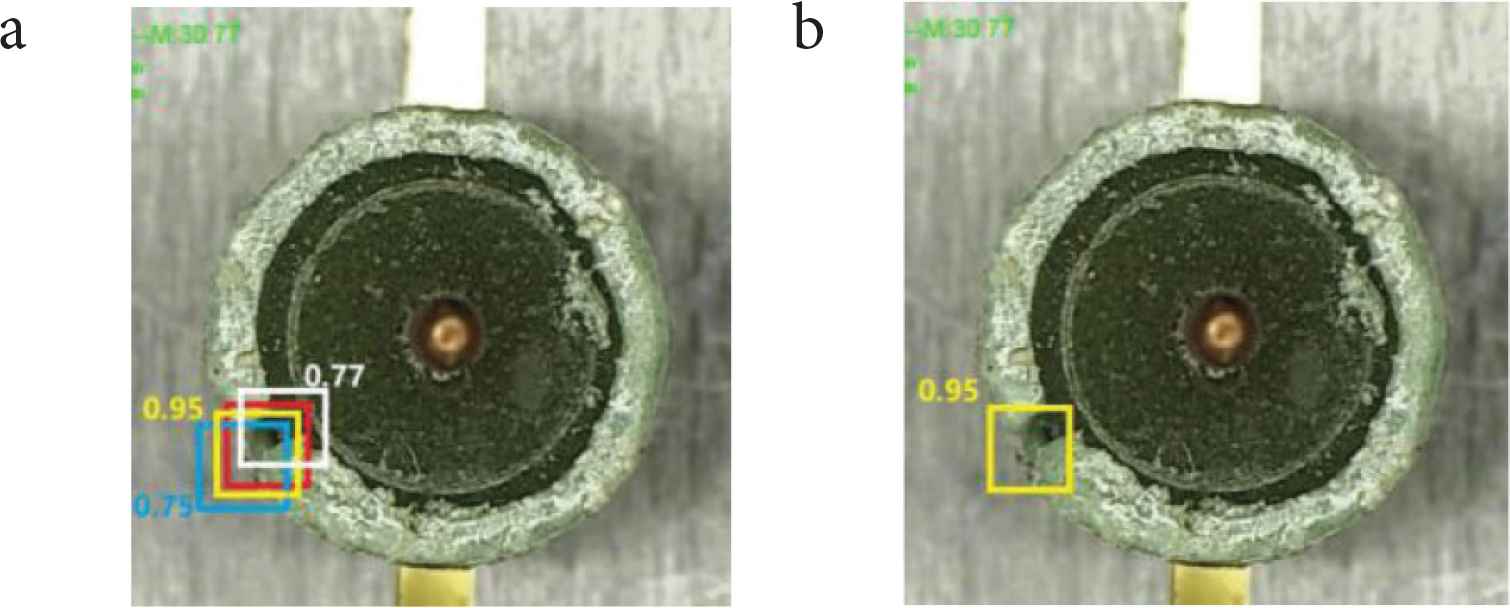
Non-maximum suppression operation. (a) No non-maximum suppression. (b) Non-maximum suppression results.
Non-maximum value suppression sort the prediction scores of the missing block prediction boxes, find the box with the highest score, and then calculate the remaining prediction boxes and the DIOU with the highest score. If the DIOU is greater than the set threshold, the box will be removed. If there are multiple labeled boxes, then continue the non-maximum value suppression operation. Figure 7b shows the result of non-maximum suppression of missing block defects.
3.6. ROI Pooling
Its main function is to merge the shared feature map and the Region of Interest (ROI) extracted through RPN, and then divide the prediction frame into a set number of grids, and pool each grid, which is equivalent to the prediction boxes of different sizes in the shared feature map are pooled into feature maps of the same size, which is convenient for inputting subsequent networks for classification and regression.
As shown in Figure 8, the size of the prediction box output by the RPN is fixed to pool_w and pool_h (where pool_w and pool_h are both 7), which is equivalent to dividing it into 7 * 7 grids, that is, to achieve a fixed length output.
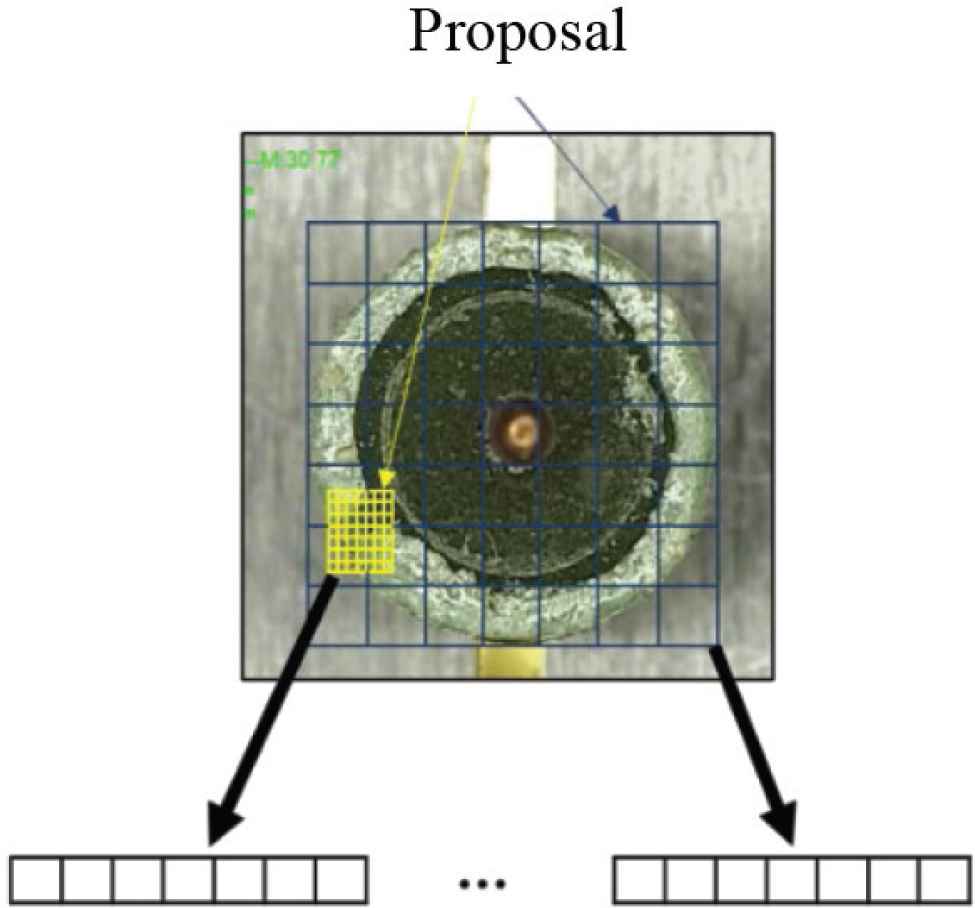
ROI pooling working diagram.
3.7. Classification Network
The fully connected layer and the activation function are mainly used to judge and return the object category in the prediction frame to obtain a more accurate prediction frame, and its structure is shown in Figure 9.
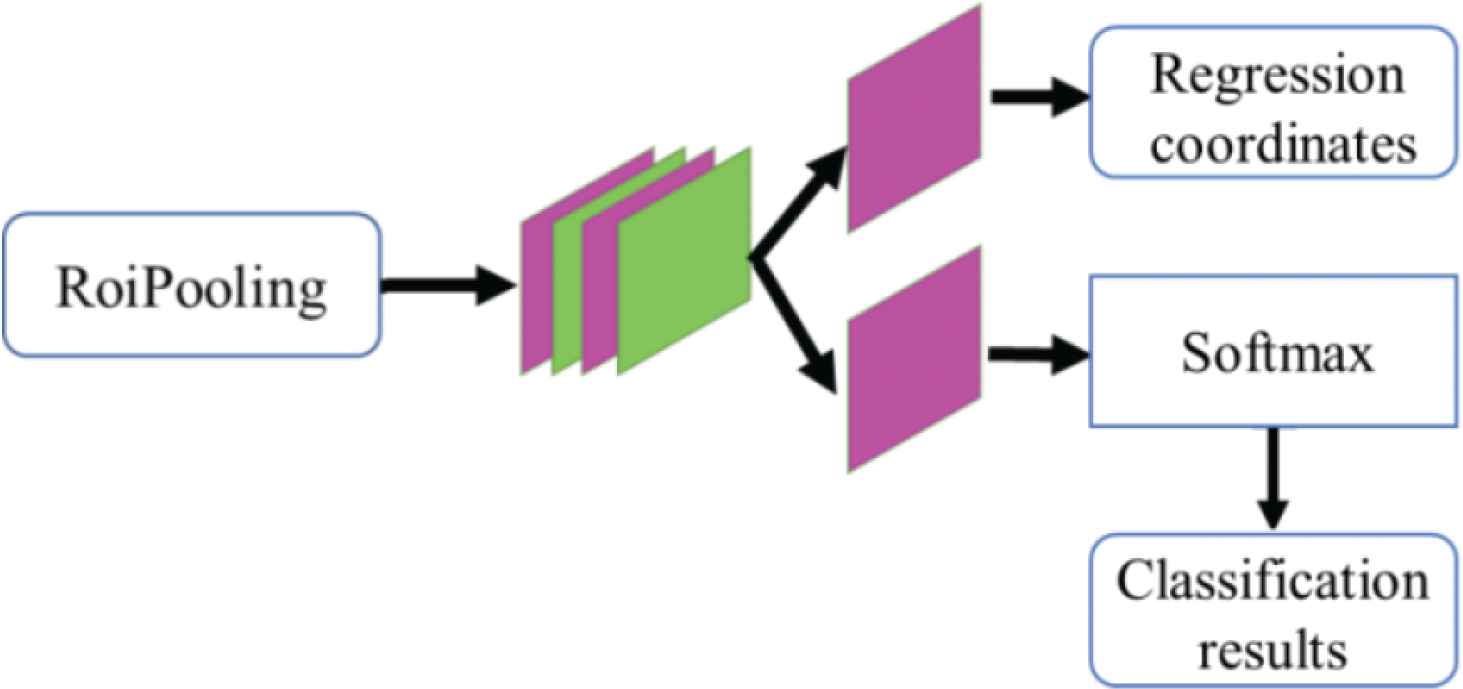
Classification network structure diagram.
3.8. Loss Function of Faster R-CNN
Faster R-CNN combines the loss functions of the classification model and the regression model, and a calculation formula can be used to calculate the overall loss of the network. The loss function expression after the network is merged is shown in Equation (9).
3.9. Workflow of Faster R-CNN Algorithm
Faster R-CNN first uses the feature extraction network to extract the shared feature map [9] of the glass terminal image. This shared feature map will be used in both RPN and ROI Pooling. Then, the RPN calculation is used to generate the suggestion box that exists in the shared feature map and make recommendations in ROI Pooling. The size of the frame is fixed, and the fixed feature map is sent to the subsequent network to obtain the target category and more accurate prediction frame information.
4. EXPERIMENTAL RESULTS
To highlight the superiority of the application of the improved Faster R-CNN method in glass terminal defect detection, it is also compared with the detection accuracy of YOLOv3, SSD and the original Faster R-CNN algorithm. The detection accuracy of the four algorithms is shown in Table 1. Some of their test results are shown in Figure 10.
| Detection accuracy (%) | |
|---|---|
| YOLOv3 | 70 |
| SSD | 88 |
| Faster R-CNN | 91.59 |
| Improved Faster R-CNN | 93.52 |
Missing block detection accuracy of three algorithms
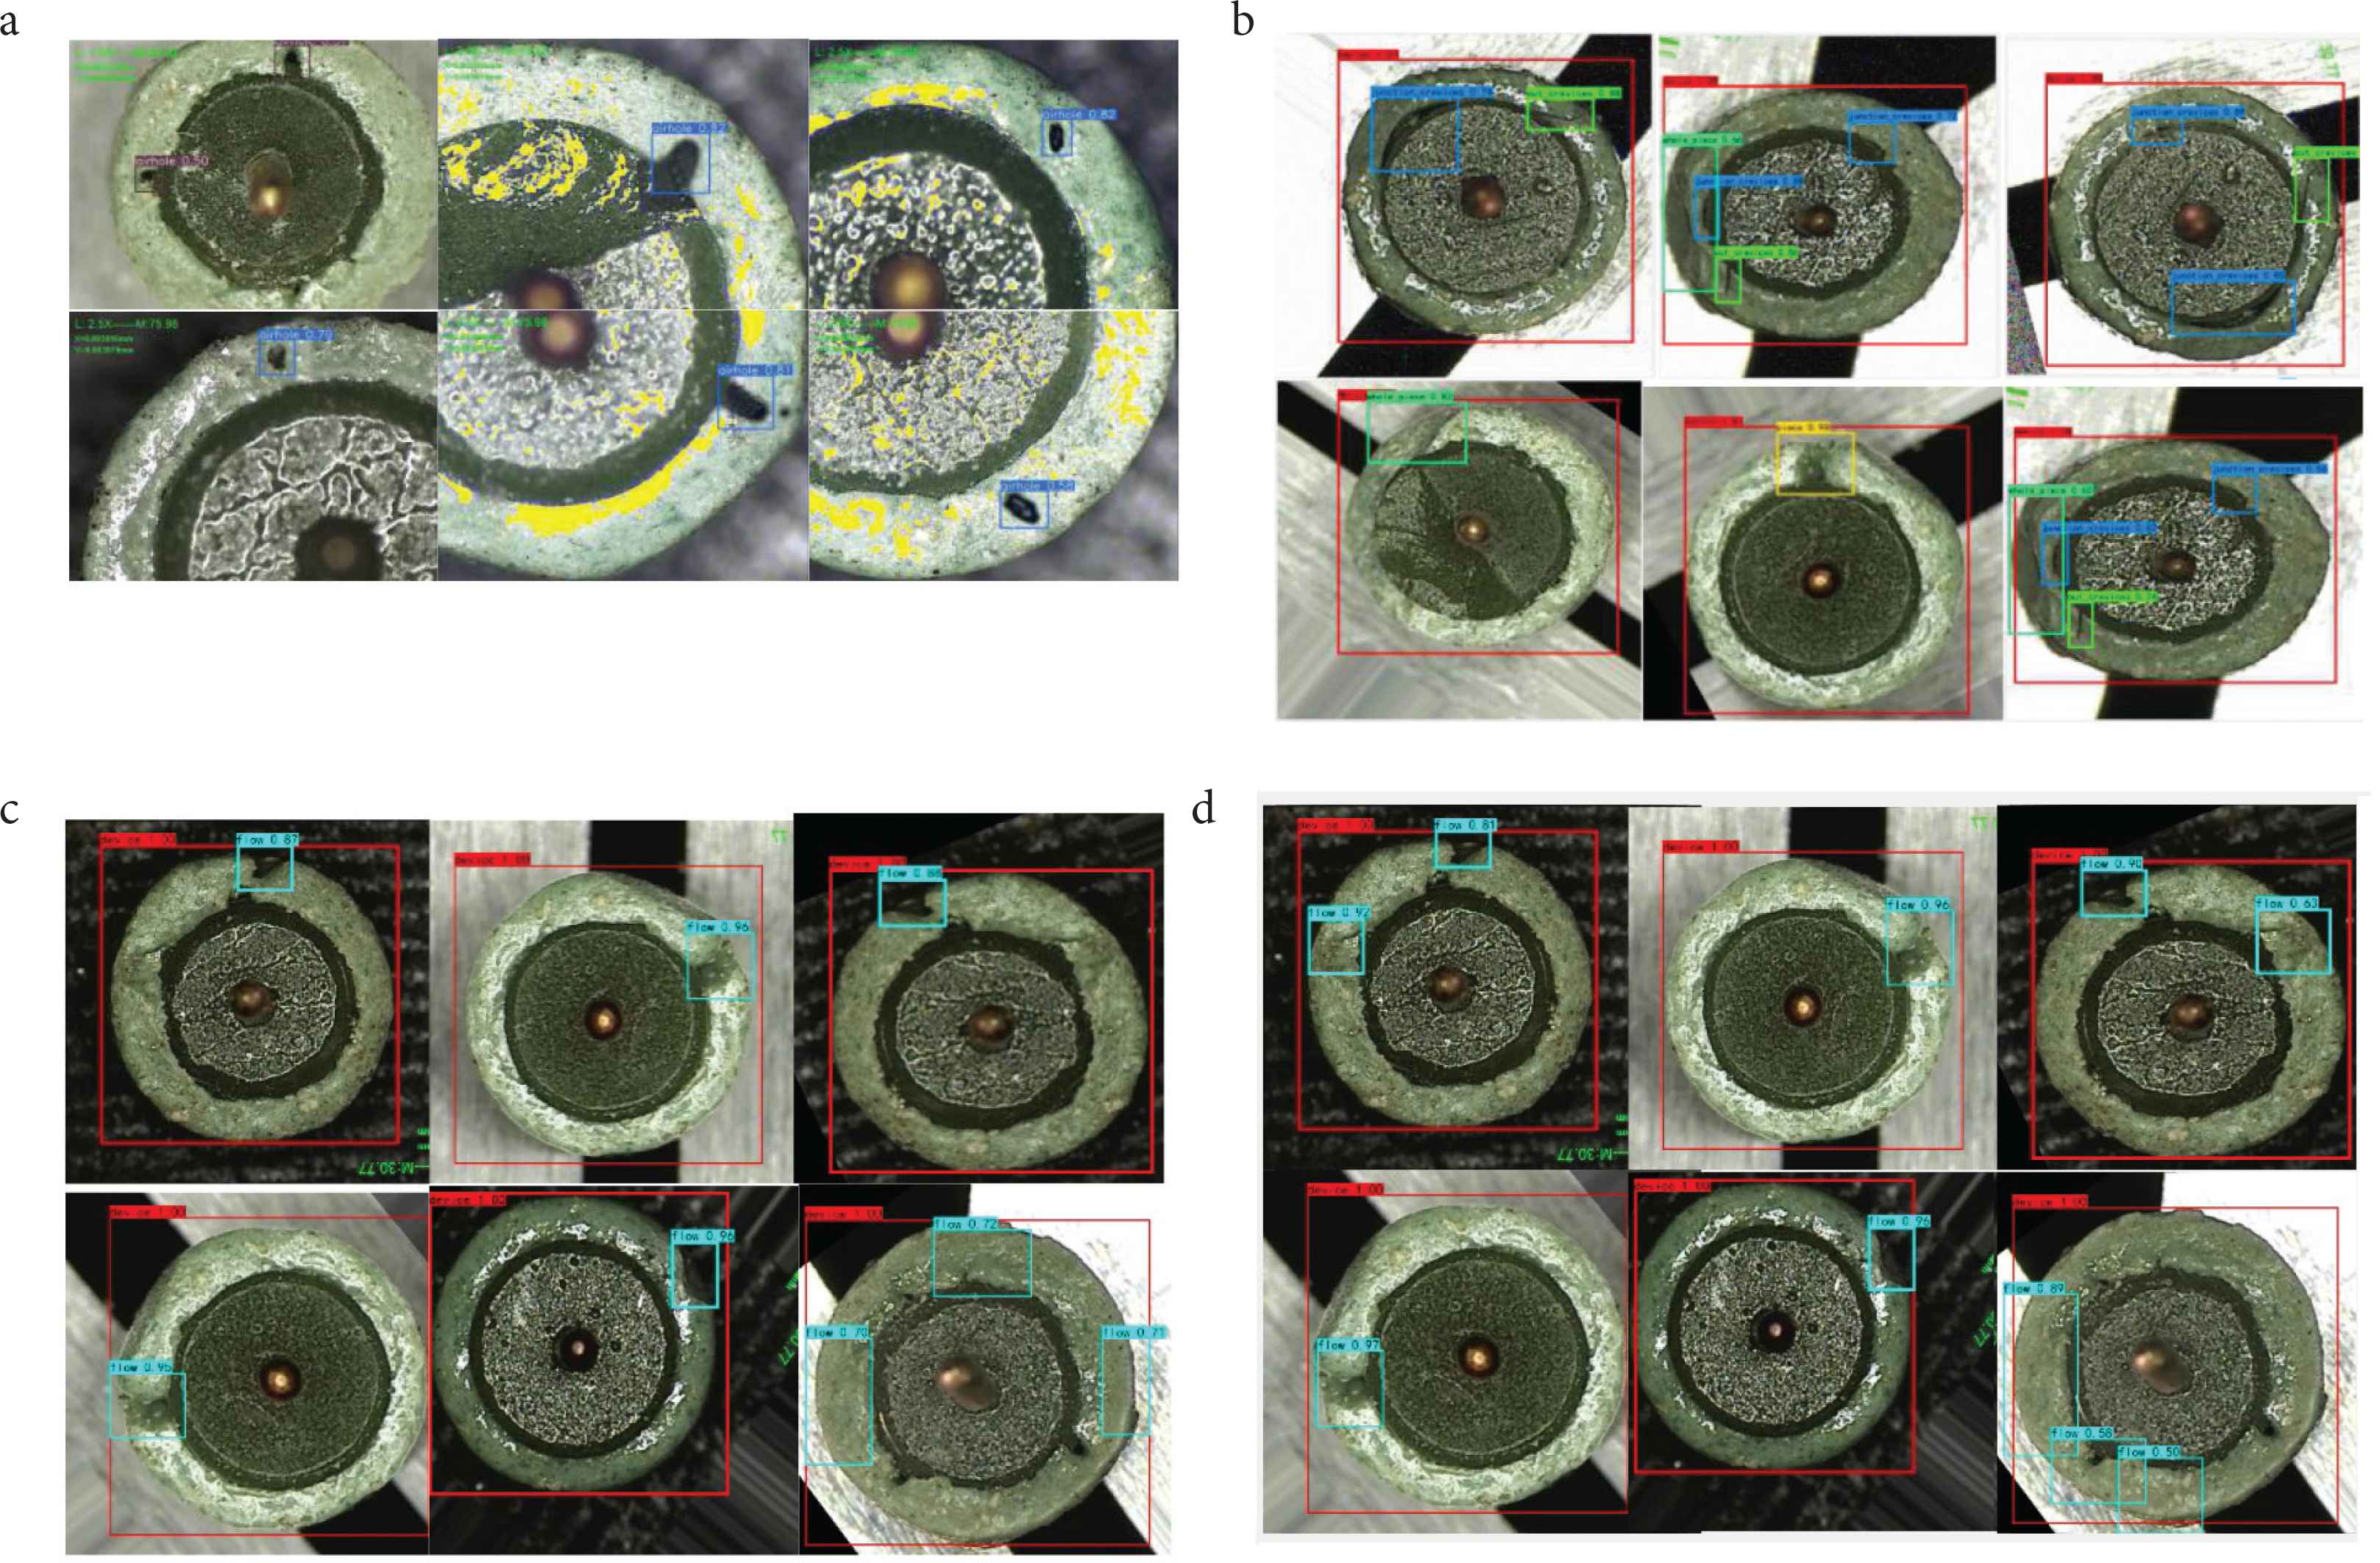
Examples of defect detection results of four algorithms. (a) Example of YOLOv3’s pore detection results. (b) Example of SSD’s defect detection results. (c) Example of Faster R-CNN’s missing block defect detection results. (d) Example of improved Faster R-CNN’s missing block defect detection results.
From the table, we can see that the result of using the YOLOv3 algorithm to detect missing blocks is not ideal, and the accuracy is only about 70%.
SSD is also a common method for small target detection. Using SSD algorithm to detect three kinds of defects at the same time, the comprehensive accuracy rate can reach about 88%.
Compared with the other two methods, Faster R-CNN has higher detection accuracy for missing block defects. The accuracy of the original Faster R-CNN model is about 91.59%. The accuracy of the missing block detection of the improved model has been significantly improved, reaching 93.52%. The data in Table 1 shows that the improved Faster R-CNN model is superior in small target detection and has higher accuracy. And, as the number of training rounds increases, there is still room for improvement in accuracy.
5. CONCLUSION
With the proposal of “Made in China 2025”, industrial production has higher and higher requirements for digitization, networking, and intelligence. Product quality inspection is the eye of industrial production and can drive the intelligent development of industrial production.
This paper analyzes the principle of the Faster R-CNN model and improves it. The original IOU is changed to DIOU, and the improved model is used for glass terminal defect detection. The inspection process does not require manual feature extraction, but based on the glass terminal sample learn features to identify defect locations and perform calibration. With the expansion of the data set and the improvement of the model, there is still much room for improvement in the accuracy of defect detection.
CONFLICTS OF INTEREST
The authors declare they have no conflicts of interest.
ACKNOWLEDGMENTS
This work is partially supported by National Key Research and Development Project (2016YFC0600906), Innovation Scientists and Technicians Troop Construction Projects of Henan Province (CXTD2016054) and also supported by Innovative Scientists and Technicians Team of Henan Provincial High Education (20IRTSTHN019).
AUTHORS INTRODUCTION
Dr. Qunpo Liu
 He graduated from the Muroran Institute of Technology (Japan) with a PhD in Production Information Systems. He is an Associate Professor at the School of Electrical Engineering at Henan Polytechnic University (China) and a master’s tutor. He is mainly engaged in teaching and research work in robotics, intelligent instruments and industrial automation equipment.
Ms. Mengke Wang
 She graduated from Henan Polytechnic University (China) in 2020 with a bachelor’s degree in automation. She is currently studying for a master’s degree in Control Engineering at Henan Polytechnic University. She is mainly engaged in research on defect detection of micro-precision components.
Dr. Naohiko Hanajima
 He graduated from the Hokkaido University (Japan) of Technology in Japan with a PhD. He is a Professor at the College of Information and Systems at Muroran Institute of Technology (Japan). He is mainly engaged in robotics and intelligent equipment.
Mr. Zonghui Liu
 He graduated from Henan Polytechnic University (China) in 2020 with a bachelor’s degree in automation. He is currently a graduate student. He is mainly engaged in the research of medical image processing.
Dr. Bo Su
 He graduated from China University of Mining and Technology (Beijing), majoring in communications and information systems, and obtained a doctorate degree. He is an Associate Professor and master’s supervisor in the School of Electrical Engineering, Henan University of Technology, China. He is mainly engaged in teaching and research in mine monitoring and monitoring, machine vision, and detection technology.
REFERENCES
Cite this article
TY  - JOUR
AU  - Qunpo Liu
AU  - Mengke Wang
AU  - Zonghui Liu
AU  - Bo Su
AU  - Naohiko Hanajima
PY  - 2021
DA  - 2021/05/28
TI  - Defect Detection of Micro-Precision Glass Insulated Terminals
JO  - Journal of Robotics, Networking and Artificial Life
SP  - 18
EP  - 23
VL  - 8
IS  - 1
SN  - 2352-6386
UR  - https://doi.org/10.2991/jrnal.k.210521.005
DO  - 10.2991/jrnal.k.210521.005
ID  - Liu2021
ER  -