
Advanced Rolling Bearing Fault Diagnosis Using Ensemble Empirical Mode Decomposition, Principal Component Analysis and Probabilistic Neural Network
- DOI
- 10.2991/jrnal.2018.5.1.3How to use a DOI?
- Keywords
- Rolling bearing; fault recognition; ensemble empirical modal decomposition; principal component analysis; probabilistic neural network
- Abstract
Aiming at the problem that the vibration signal of the incipient fault is weak, an automatic and intelligent fault diagnosis algorithm combined with ensemble empirical mode decomposition (EEMD), principal component analysis (PCA) and probabilistic neural network (PNN) is proposed for rolling bearing in this paper. EEMD is applied to decompose the vibration signal into a sum of several intrinsic mode function components (IMFs), which represents the signal characteristics of different scales. The energy, kurtosis and skewness of first few IMFs are extracted as fault feature index. PCA is employed to the fault features as the linear transform for dimension reduction and elimination of linear dependence between the fault features. PNN is applied to detect rolling bearing occurrence and recognize its type. The simulation shows that this method has higher fault diagnosis accuracy.
- Copyright
- Copyright © 2018, the Authors. Published by Atlantis Press.
- Open Access
- This is an open access article under the CC BY-NC license (http://creativecommons.org/licences/by-nc/4.0/).
1. Introduction
Rolling bearings are common and vulnerable parts in rotating machinery. According to statistics, 30% of the rotating machinery faults are caused by the bearing failure, so the condition of the rolling bearing is closely related to the operation of the machinery, and it is of great importance to detect and diagnose the fault of rolling bearings.1
At present, there are many scholars studying the fault diagnosis of rolling bearings. The Ref. 1 uses a method of combining EMD decomposition with singular value difference spectrum. The Ref. 2 uses the fast independent component analysis to extract the fault feature, but it does not extract the fault information in depth, and the Ref. 3 uses the wavelet packet de-noising method combined with LMD to extract fault information. In Ref.4, discrete wavelet transform is proposed to extract the feature, but the adaptability of wavelet analysis is not as strong as EMD and EEMD when dealing with non-stationary signals. It can be seen from the above bibliographies that how to better distill the fault features from non-stationary and noisy bearing signal is the key to fault diagnosis of rolling bearings.
In the operation of rotating machinery, the vibration signal usually has non-stationary and nonlinearity characteristics, so it is difficult to obtain good effect in feature extraction by using traditional Fourier transform as the theoretical basis. And the collected signal is accompanied by a certain degree of noise. Therefore, EEMD is applied to decompose the vibration signal into a sum of several intrinsic mode function components (IMFs), which represents the signal characteristics of different scales. The energy, kurtosis and skewness of first few IMFs are extracted as fault feature index. Then PCA is employed to the fault features as the linear transform for dimension reduction and elimination of linear dependence between the fault features. Finally, PNN is applied to detect rolling bearing occurrence and recognize its type, the generalized algorithm for rolling bearing is shown in Fig 1.
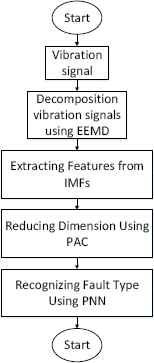
Rolling bearing fault diagnosis algorithm
2. Fault Feature Extraction Using EEMD
Empirical Mode Decomposition (EMD) is a new method for analyzing non-linear and non-stationary time series proposed by Huang N.E. in 1998.
2.1. The principle of EMD
EMD is a self-adapting time-frequency analysis method, which is different from the wavelet analysis in that is that there is no basis function system, that is, when analyzing the series, the original sequence is divided into a limited number of intrinsic functions rather than with certain basis functions, and each component shows uniqueness and reflects the information at each unique time scale in the signal. The decomposed signal is a stationary signal. In essence, EMD is a method to turn non-stationary signals into stationary ones. The main calculation procession sees Ref. 1. Use EMD to decompose the bearing signal, taking a number of high-frequency components and abandoning the last several IMF components which are generally low-frequency noise-based.1
2.2. The principle of EEMD
The EEMD algorithm is a new signal decomposition method based on the traditional EMD algorithm. In order to overcome the algebraic phenomenon of abnormal events (such as pulse interference) in traditional EMD decomposition, the ensemble empirical mode decomposition algorithm, that is EEMD algorithm, is proposed. In the traditional EMD decomposition of the signal, the algebraic generation of the signal is related to the selection of the extreme value of the signal. If the interval of the extreme points of the signal is not uniform, the fitting error of the upper and lower envelope will occur, resulting in mode mixing. By adding different amplitude of the Gaussian white noise to the signal to change the extreme value of the characteristics of the signal, offsetting the IMF and the white noise, the EEMD algorithm can get accurate IMF and eliminate the noise, which can better suppress the alienation of the abnormal event pattern and the inherent pattern of signal vibration and better highlight the real signal characteristics.
The specific decomposition process changes to the following steps:
- (i)
Adding a given amplitude white noise to the analysis signal X(t) and then normalizing the signal.
- (ii)
EMD decomposition of the signal after adding white noise.
- (iii)
Repeating the above two steps N times, each time adding random white noise sequence.
- (iv)
Average calculating operation for the corresponding decomposed ensemble IMF to offset the effect of multiple Gaussian white noise on the real IMF. Finally, the IMF component and the remainder of the EEMD decomposition can be obtained.
Use EEMD to decompose the bearing signal, taking a number of high-frequency components and abandoning the last several IMF components which are generally low-frequency noise-based [1].
2.3. Multi-feature Extraction Using EEMD
The method of extracting characteristic parameters of signals with multiple characteristic parameters is improved on the basis of intrinsic mode energy method. As a single energy method is the overall energy calculation for each component of IMF, it may lose some useful fault information for the extracted feature signal. Therefore, this paper adds two feature quantities, namely, the kurtosis and skewness of the signal5.
The kurtosis index is a dimensionless parameter which bears no relationship to the speed, size and load of the bearing and is particularly sensitive to the impulse signal, so it is quite suitable for pitting damage fault of the surface. Generally the normal bearing kurtosis index is close to 3.
The skewness index reflects the asymmetry of the vibration signal, indicating the degree of deviation of the center of the signal probability density function from the standard normal distribution and reflecting the asymmetry of the signal amplitude distribution compared with its ideal mean. Except the machinery with quick-return characteristics, if there is friction or collision in a certain direction, it will cause the asymmetry of the vibration waveform so that the degree of bias index increases.
They are calculated as follows:
The flow chart of multi-feature extraction is shown in Fig 2.
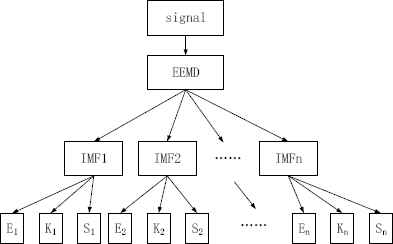
The flow chart 1 of multi-feature extraction.
A sum of several intrinsic mode function components of the fault vibration signal are obtained after EEMD decomposition, their frequencies are arranged from high to low, the first few IMFs which are generally high-frequency are employed for feature extraction, the last several IMFs which are generally low-frequency noise-based are abandoned, so the first n IMF components are taken after EEMD decomposition, then the number of dimension of the final extraction of the feature index is 3n.
3. Reducing Feature Dimensions Using PCA
In the process of modern production industry, generally a lot of process variables will be collected to detect and control the process. Principal component analysis is a commonly used analytical method in multivariate statistical analysis, and there’s a fundamental difference between this method and the mentioned Fourier system based method or other time-domain and frequency-domain analysis methods. It is characterized by the simultaneous processing of multiple dimension variables data from which finds the hidden statistical information characteristics and can eliminate the correlation between different dimensions well, so that a number of related variables can be turned into a few independent variables, that is, a new feature index of less dimensions rather than the original feature index reflects most of the information that should be originally available. And the principal component analysis can eliminate the noise and redundancy in the fault data and improve the accuracy. The main calculation procession sees Ref. 6.
4. Fault Type Recognition Using PNN
PNN was first proposed by Dr. Specht, and it can get the Bayesian optimal results when used for pattern classification. It has the following advantages: ① Easy for training with fast convergence; ② strong fault-tolerant characteristics; ③ network nodes are up to the number of training samples and the number of patterns to decide.
The structure of the PNN network is divided into four layers, namely the input layer, hidden layer, sum of layers and the output layer. The raw data is processed as a PNN diagnostic model after a series of previous processing. The main calculation procession sees Ref. 7.
5. Simulation and the experiment analysis
5.1. Description of the experiment
In order to verify the effectiveness of the diagnostic method in this paper, the data is taken from the Department of Electrical Engineering and Computer Science, Case Western Reserve University, USA.8
The analyzed data is obtained with the motor in 2 horsepower, and there are the inner ring fault data, outer ring fault data, rolling element failure data, and normal bearing data. The above four kinds of data form the original data of this experiment. Select 1024 data as a group from the original data and 40 groups for each state from the above four states, totally 160 groups of data, of which 10 groups randomly selected for each state as the training group and the remaining 30 groups as the test group.
5.2. Feature extraction and principal component analysis
In this experiment, EEMD is used to decompose the above-mentioned vibration signals, and then each IMF component is calculated for the energy, kurtosis and skewness. Next, PCA method is used to reduce the dimension, and finally input into PNN for state classification. The classification flow chart is as follows.
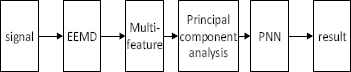
Troubleshooting flowchart.
Five IMF components are obtained after EEMD for each group of data, forming five-dimensional data, and then calculate each IMF component for the energy, kurtosis, and skewness, getting 15-dimensional data to form a multi-feature data index.
Then, the principal component analysis is performed on the multi feature data index, and the following principal component analysis table 1 is obtained
| Main component number | Contribution rate % | Cumulative contribution rate % |
|---|---|---|
| 1 | 47.5 | 47.5 |
| 2 | 24.5 | 72.0 |
| 3 | 7.6 | 79.6 |
| 4 | 4.8 | 84.4 |
| 5 | 4.5 | 88.9 |
| 6 | 3.9 | 92.8 |
| 7 | 3 | 95.8 |
Part of the main component contribution table.
In general, the cumulative contribution rate of the main component analysis up to 85% can keep most of the original signal information.6 As can be seen from the above table, starting from the 7th main element, the cumulative contribution rate reaches 95.8%, meeting the requirement of dimensionality reduction for the original data index.
5.3. Pattern recognition using PNN
This paper is based on the EEMD intrinsic mode energy method to improve. First, the energy of the first 5 IMF is calculated and then input into PNN, and the diagnostic accuracy is 85.33%; and then adds the other two features to form a 15-dimensional feature index, enter the PNN, the diagnostic accuracy is 91%. It can be concluded that after adding two features, PNN will increase the diagnostic accuracy.
Finally, the data analyzed by the principal component analysis are input to the PNN in turn for pattern recognition.
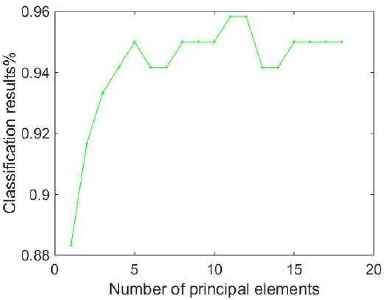
The number of different principal components to diagnose the correct rate.
As can be seen from the figure above, when the number of principal components reaches five, the correctness rate reaches 95%, and the cumulative contribution rate at this time is 88.9%. Then as the number of principal components increases, the cumulative contribution rate increases. The correct rate of accuracy fluctuates about 95%. Therefore, taking five main elements is the final solution, which can ensure the accuracy and efficiency. The comparison of the three methods is shown in Table 2.
| Method | Energy method | Multi - feature method | Multi - feature PCA |
|---|---|---|---|
| Accuracy | 85.33% | 91% | 95% |
Comparison of three methods for correct diagnosis.
It can be seen that the accuracy of the energy method is low, and the accuracy is improved effectively when two features are added. It is thus obvious that the kurtosis and skewness of vibration signal can be used to make up the deficiency of energy feature in fault information completeness. Finally, on the basis of multi-feature method, the PCA is processed to further improve the fault diagnosis accuracy, which proves that PCA can effectively remove the noise and redundancy in the vibration signal.
6. Conclusion
- (i)
The proposed feature index combined with the energy, kurtosis and skewness of first few IMFs, can recognize the fault type of rolling bearing.
- (ii)
The feature index of the principal component analysis has higher accuracy rate than that of the feature index without main component analysis, which indicates that the principal component analysis can eliminate the redundancy and noise in the information to a certain extent.
- (iii)
When the principal component analysis is used to reduce the dimensionality of the data, the higher the contribution rate is, the higher the accuracy is, but it remains within a certain range after reaching a certain limit.
Acknowledgements
Fund Project: National Key Research and Development Program (2016YFC0600906)
References
Cite this article
TY  - JOUR
AU  - Caixia Gao
AU  - Tong Wu
AU  - Ziyi Fu
PY  - 2018
DA  - 2018/06/30
TI  - Advanced Rolling Bearing Fault Diagnosis Using Ensemble Empirical Mode Decomposition, Principal Component Analysis and Probabilistic Neural Network
JO  - Journal of Robotics, Networking and Artificial Life
SP  - 10
EP  - 14
VL  - 5
IS  - 1
SN  - 2352-6386
UR  - https://doi.org/10.2991/jrnal.2018.5.1.3
DO  - 10.2991/jrnal.2018.5.1.3
ID  - Gao2018
ER  -