
Facial Expression Analysis and its Visualization While Writing Messages
- DOI
- 10.2991/jrnal.2018.5.1.9How to use a DOI?
- Keywords
- Facial expression analysis; Real-time system; Mouth area; Visualization; Writing messages; OpenCV
- Abstract
We have developed a real-time system for expressing emotion as a pictograph selected according to the facial expression while writing a message. The image signal is analyzed by our real-time system using image processing software (OpenCV) and a previously proposed feature parameter. We applied the system to post a message and a pictograph expressing the facial expression while writing the message on an SNS. The experimental results suggest that our system can be useful for expressing emotions while writing messages.
- Copyright
- Copyright © 2018, the Authors. Published by Atlantis Press.
- Open Access
- This is an open access article under the CC BY-NC license (http://creativecommons.org/licences/by-nc/4.0/).
1. Introduction
Social network services (SNSs) have become very popular worldwide as communication tools on the Internet. For example, Twitter, one of the most popular SNSs, has 328 million users active monthly.1 We can post a message, a static image, or a moving image on Twitter. However, we cannot post information on Twitter about our real emotions while writing a message.
One of our current studies is aimed at expressing the real emotions of persons writing messages for posting on an SNS site by analyzing their facial expressions and visualizing them as pictographs. In this paper, we propose a real-time system for analyzing a facial expression while writing a message, visualizing the facial expression as a pictograph, and posting the pictograph on Twitter together with the message. The moving image in our method is captured by a webcam and analyzed in real-time via Open Source Computer Vision (OpenCV) image-processing software2 by using a previously proposed feature parameter (facial expression intensity)3 that is based on the mouth area. The visualization method proposed in this paper is based on a previously reported method.4
2. Proposed System and Method
2.1. System overview and outline of the method
In this system (see Fig. 1), a webcam moving image captured in real-time is analyzed via the following process.
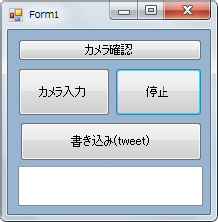
Display of the proposed system at startup.
The proposed method consists of (1) extracting the mouth area, (2) calculating the facial expression feature vectors, (3) determining the facial expression intensity and calculating its average value while writing a message, (4) and posting the message and an automatically selected pictograph for the message on Twitter. The details of these steps are explained in the following subsections.
2.2. Mouth area extraction
First, moving image data are changed from RGB to YCbCr image data, after which the face area is extracted from the YCbCr image as a rectangular shape, and the lower 40% portion of the face area is standardized. Next, the mouth area is extracted from that portion. The mouth area was selected for facial expression analysis because it is where the differences between neutral and smiling facial expressions appear most distinctly.
2.3. Facial expression intensity measurement
For the Y component of the selected frame, the facial expression feature vector is extracted for the mouth area using a two-dimensional discrete cosine transform (2D-DCT) for each 8×8-pixel section. In this study, two 8×8- pixel sections at each of the left and right lower corners (see Fig. 2) are not included for this measurement, because these sections might cause errors due to the appearance of the jaw and/or neck line(s) there. To measure the feature parameters of the facial expressions, we select low-frequency components from the 2D-DCT coefficients as the facial expression feature vector elements; however, the direct current component is not included. In total, 15 feature vector elements are obtained. The facial expression intensity is defined as the norm difference between the facial expression feature vectors of the reference and target frames. In this study, the first 20 continuous frames of mouth area data successfully extracted after the webcam recording begins are treated as reference frame candidates. The reference frame selection method is explained in detail in Reference 5.
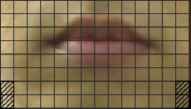
Mouth area. The four 8×8-pixel sections excluded from the measurement in mouth area appear as cross-hatched squares.
2.4. Posting a message and an automatically selected pictograph for the message on Twitter
Facial expression intensity is measured using our previously discussed method4, in which a straight line is drawn on a graph image prepared using OpenCV. A pictograph is automatically selected by comparing the average value of facial expression intensity and a threshold decided experimentally beforehand, and then the message and the selected pictograph are posted on Twitter when the user presses a button. In this system, two pictographs, expressing neutral and smiling facial expressions, are used (see Fig. 3).

Two pictographs expressing a neutral (left) or smiling (right) facial expression.
3. Experiment
3.1. Conditions
The experiment was performed on a Dell XPS 9350 PC equipped with an Intel Core i7-6560U 2.2 GHz central processing units (CPUs) and 8.0 GB of random access memory (RAM). The Microsoft Windows 7 Professional operating system (OS) was installed on the PC and Microsoft Visual C++ 2008 and 2013 Express Editions were used as the development language. CoreTweet6, as a library, and the Twitter API were used to post a message and pictograph on Twitter.
Seven males (subjects A to D in their 20s, subjects E and F in their 30s, and subject G in his 50s) participated in the experiments.
We first performed experiments with six males (all except subject G) under the two conditions listed below. As an initial condition in the experiment, the subjects were instructed to maintain a neutral facial expression and face forward without speaking for about five seconds just after the start of the experiment. After the initial state of a neutral facial expression was terminated, the subjects were requested to intentionally respond with one of two types of facial expressions (Experiment 1, neutral; Experiment 2, big smile) and write a message, ‘このぬいぐるみかわいくない’ (in Japanese), which means, ‘This stuffed toy is pretty, isn’t it?’ Experiments 1 and 2 were performed three times for each subject. In each experiment, facial expression intensity measurements were performed for each subject during writing a message for 40 seconds and then the average facial expression intensity for that message was calculated. In order to distinguish between the neutral and smiling facial expressions on the basis of average facial expression intensity for a message, a threshold was set as the average of the maximum among neutral expressions and minimum among smiling expressions of the six subjects.
Two additional experiments (Experiments 3 and 4) were next performed with only subject A. The same initial conditions were used in these experiments as in Experiments 1 and 2. After the initial state of a neutral facial expression was terminated, the subject was requested to intentionally respond with two types of emotions (Experiment 3, neutral; Experiment 4, smiling) and write a message, ‘明日は情報伝達システ ム学サブゼミに参加します。時間は5時限目、場 所は先生の部屋です。’ (in Japanese), which means, ‘I will attend the discussion section held at the professor’s room of the information communication system lab. in fifth period tomorrow.’ Fig. 4 shows snap-shots of Experiments 3 and 4, which were extracted from the captured moving images of those experiments. In each experiment, facial expression intensity measurement was performed for 30 seconds and then the average facial expression intensity for that message was calculated, after which both the message and the pictograph expressing the facial expression while writing the message were posted on Twitter. Then, subjects B, C, D, and G participated in two questionnaire surveys comprising questions asking them to assign one of four adjectives (neutral, happy, sad, or angry) to (a) each of the captured moving images, and (b) for each of the messages accompanied by pictographs (see Fig. 5) in Experiments 3 and 4.
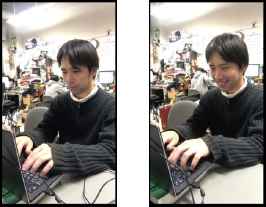
Snap-shots of subject A in Experiment 3 (neutral; left) and Experiment 4 (smiling; right).
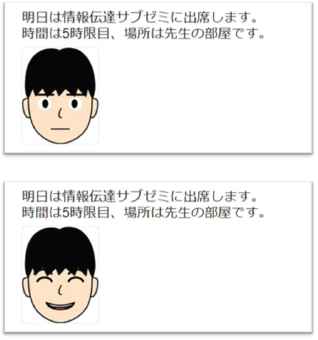
Messages and pictographs posted on Twitter in Experiment 3 (neutral; upper) and Experiment 4 (smiling; lower).
3.2. Results and discussion
The ranges of average values of facial expression intensities in Experiments 1 (neutral) and 2 (big smile) were 2.13 to 3.70 and 3.50 to 15.61, respectively. Therefore, the threshold for distinguishing between the two types of facial expressions was determined as 3.60. Thus, in the proposed system, a facial expression having an average facial expression intensity under 3.60 is judged to be a neutral facial expression, whereas one 3.60 or higher is judged to be a smiling expression.
As shown in Figs. 6 and 7, our proposed system was able to distinguish between the two types of facial expressions, neutral and smiling. The average facial expression intensities for the two types were 2.94 and 9.60, respectively, in Experiments 3 and 4, respectively. The former value is under 3.60 and the latter is above 3.60, resulting in our proposed system selecting the neural pictograph (Fig. 5, upper) in Experiment 3 and the smiling pictograph (Fig. 5, lower) in Experiment 4 for posting on Twitter. The results of the questionnaire surveys show that our proposed system distinguished correctly between the two types (neutral and smiling) of facial expressions for the subject, and that the pictographs selected by the system correctly reflected the facial expressions while writing messages for the subject.
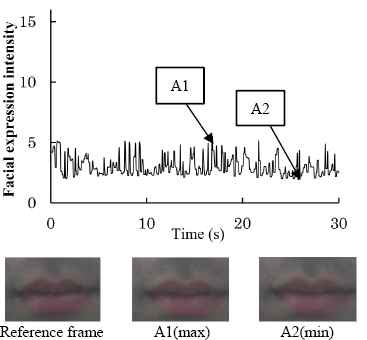
Changes in facial expression intensity of mouth area for subject A (upper graph). Mouth images are shown for two moments during Experiment 3 (neutral) (A1 (maximum of facial expression intensity) and A2 (minimum of facial expression intensity)), as indicated on the graph (lower images), along with that of reference frame.
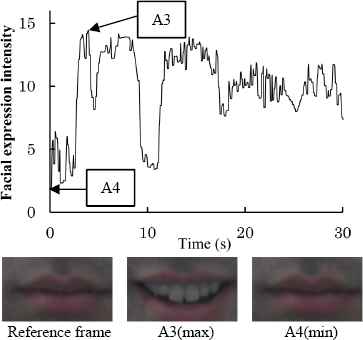
Changes in facial expression intensity of mouth area for subject A (upper graph). Mouth images are shown for two moments during Experiment 4 (smile) (A3 (maximum of facial expression intensity) and A4 (minimum of facial expression intensity)), as indicated on the graph (lower images), along with that of reference frame.
Note, in the case of subject F, for a typical example, the effect of exclusion of the four 8×8-pixel sections from the measurement in mouth area (see Fig. 2) was estimated to be about 22% in terms of difference in facial expression intensity.
4. Conclusion
We have developed a real-time system for expressing emotion as a pictograph selected according to the facial expression while writing a message. We applied the system to the posting on Twitter of both a message and a pictograph. The experimental results suggest that our system can be useful for expressing emotions during writing messages.
Acknowledgements
We would like to thank the subjects for their cooperation in the experiments.
References
Cite this article
TY  - JOUR
AU  - Yasunari Yoshitomi
AU  - Taro Asada
AU  - Kenta Mori
AU  - Ryoichi Shimada
AU  - Yuiko Yano
AU  - Masayoshi Tabuse
PY  - 2018
DA  - 2018/06/30
TI  - Facial Expression Analysis and its Visualization While Writing Messages
JO  - Journal of Robotics, Networking and Artificial Life
SP  - 37
EP  - 40
VL  - 5
IS  - 1
SN  - 2352-6386
UR  - https://doi.org/10.2991/jrnal.2018.5.1.9
DO  - 10.2991/jrnal.2018.5.1.9
ID  - Yoshitomi2018
ER  -