
An Alternative Measures of Moments Skewness Kurtosis and JB Test of Normality
- DOI
- 10.2991/jsta.d.210525.002How to use a DOI?
- Keywords
- Robust moments; Robust skewness; Robust Kurtosis; Robust test of normality
- Abstract
If we know the statistics of central tendency and dispersion, we still cannot nature a complete design about the distribution. About these measures we should know more information's of skewness and kurtosis, which are enables us to have a design the distribution. However, there is evidence that they may response poorly in the presence of non-normality or when outliers arise in data. We examine the performances of popular and frequently used measures of skewness
- Copyright
- © 2021 The Authors. Published by Atlantis Press B.V.
- Open Access
- This is an open access article distributed under the CC BY-NC 4.0 license (http://creativecommons.org/licenses/by-nc/4.0/).
1. INTRODUCTION
The learning of central tendency and dispersion provides us with variable information involving to the central value as well as the variability of the distribution. Unfortunately, these measures fail to exhibit how the observations are given and accumulated about the central value of the distribution. The arrangements and accumulation of the observations establish the characteristics of the distribution with respect to its shape and pattern [1]. By shape characteristics of a distribution, we refer to the level of these two characteristics what is known as the measures of skewness and kurtosis respectively. Skewness and kurtosis can help us to visualize the asymmetry and peakedness of a frequency distribution. The theoretical and practical background of various measures of moments, skewness and kurtosis are documented in several books [2–11] and journal articles [12], to name but a few. Among them the absolute measures of skewness are not calculate for comparing two series. On the other hand, Prof. Karl Pearson's coefficient of skewness is baffled to calculate, if mode is ill-defined as well as skewness for moderately asymmetrical distribution give limit is
The second, third and fourth moments of a distribution are often used in studying the “shape” of a probability distribution, in particular, its skewness, S (i.e., lack of symmetry) and kurtosis, K (i.e., tallness or flatness), are defined as
One measure of skewness is defined as
A commonly used measure of kurtosis is given by
Here we define a most popular and commonly used goodness of fit Robust Jarque and Bera [13] test for normality, which utilized the information of the skewness and kurtosis, is formulate by
In that case the value of the JB statistic is expected to be 0. Under the null hypothesis that the data set is normally distributed, JB showed that asymptotically (i.e., in large samples) the JB statistic follows the chi-square distribution with 2 degrees of freedom. If the computed p value of the JB statistic in an application is sufficiently low, which will happen if the value of JB is very different from 0, one can reject the hypothesis that the data are normally distributed. But if the p value is reasonably high, which will happen if the value of the statistic is close to 0, we do not reject the normality [13,14].
Since
2. PROPOSE ROBUST MODIFICATION OF MOMENTS SKEWNESS KURTOSIS AND JB STATISTIC
The presence of a small proportion of outliers in a sample can have a large distorting influence on the sample mean and the sample variance. It is well known that these classical estimators, optimal under the normality assumption, are extremely sensitive to atypical observations in the data. Since the measures of skewness and kurtosis are based on mean and variance, it's also sensitive to outliers. There exist several measures of robustness of an estimator [15,16], but in this paper, the decile mean (DM) will be used. This is rich tool that summarizes several aspects of the robustness of an estimator. A survey on DM is given by [1]. Now we define DM as
2.1. Robust Moments
In statistics, moments are certain constant values in a given distribution, it's obviously fall under descriptive statistics. Because of this nature, the moments help us to establish the nature and form of the underlying distribution. Consider a variable X, assuming values
The first-four raw moments about the value A are defined as
Replacing A by
In general, the
Thus, it is to be significant that you can compute an infinite number of moments for a given distribution, but in practice, we need only four moments to investigate the form and characteristics of a distribution.
2.1.1. Relation between raw moments and central moments
Recall that
Similarly,
In general,
Thus the formula enable us to find the moments about any point, once the decile mean
2.1.2. Effect of change of origin and scale on moments
Let
Now the
And the
Thus the
2.2. Robust Skewness and Robust Kurtosis
Literally, skewness means “lack of symmetry” as well as kurtosis means “convexity of curve.” We study skewness and kurtosis to have an idea about the shape and pattern of the curve. The robust measures of skewness and kurtosis may also be obtained by making use of the proposed robust moments. A relative measure of robust skewness denoted by
The value of
The most important measure of robust kurtosis is
For normal distribution
2.2.1. Prove that ϕ 1 ϕ 2
Proof:
Let
Let Y be a transformed variable assuming values
Now, suppose
The corresponding phi values are as follows:
Hence the proof.
2.2.2. For any set of values x 1 , x 2 , ⋯ , x n ϕ 2 ≥ 1 + ϕ 1
Proof:
Let us recall that
Consider the following expression
Choosing
This completes the proof.
2.2.3. For any set of values x 1 , x 2 , ⋯ , x n ϕ 2 ≥ 1
Proof:
Let us recall that
Consider the following expression
Choosing
2.3. Robust Jarque–Bera (RJB) Test of Normality
AS a result, and following the measures of robust skewness
It follows that the value of the
3. REAL DATA EXAMPLES
In this section, we apply some recognized graphs, classical and our newly proposed measures as well as tests on real data sets to make out the data are normal or not. Let us first consider the weight of a bag of carrots data, which is taken from [17]. This data consists of 12 observations. When we apply usual outliers' detection method (Med-MAD) [18,19], we notice that this data does not hold any outlier. The outcome of graphical, classical and newly proposed measures and tests for this data are given below:
Since, the original data set is free from outliers we watch from Figure 1 that the type of the density plot is positively skewed distribution as well as QQ-plot are reasonably normal in shape.

A graphical comparison of normality.
From Table 1 reports the data are positively skewed and platykurtic normal shape based on both classical and proposes estimators. Any more notice that the inference of classical and propose JB tests results are same. But it is worth mentioning that Hogg and Tanis [17] used only graphical two tests and announced that the data is normal.
| JB/RJB Value | p-Value | Remarks | ||||
|---|---|---|---|---|---|---|
| Classical | 0.000087 | 0.0457 | 1.9797 | 0.5246 | 0.7692 | Normal |
| Proposed | 0.000080 | 0.0539 | 1.8303 | 0.6898 | 0.7082 | Normal |
Four measures result of the weight of a bag of carrots data.
Now judge another data set, the diameter of individual grains of soil, such as porosity, data has taken as of [17], which contains 30 observations. In the beginning, we make sure outliers by usual method (Med-MAD) [18,19]; it detects 2 outliers (cases 6 and 14). Original data and deleting these outliers we verify the normality of the data set by graphical as well as analytical tests of normality, which results has publicized below:
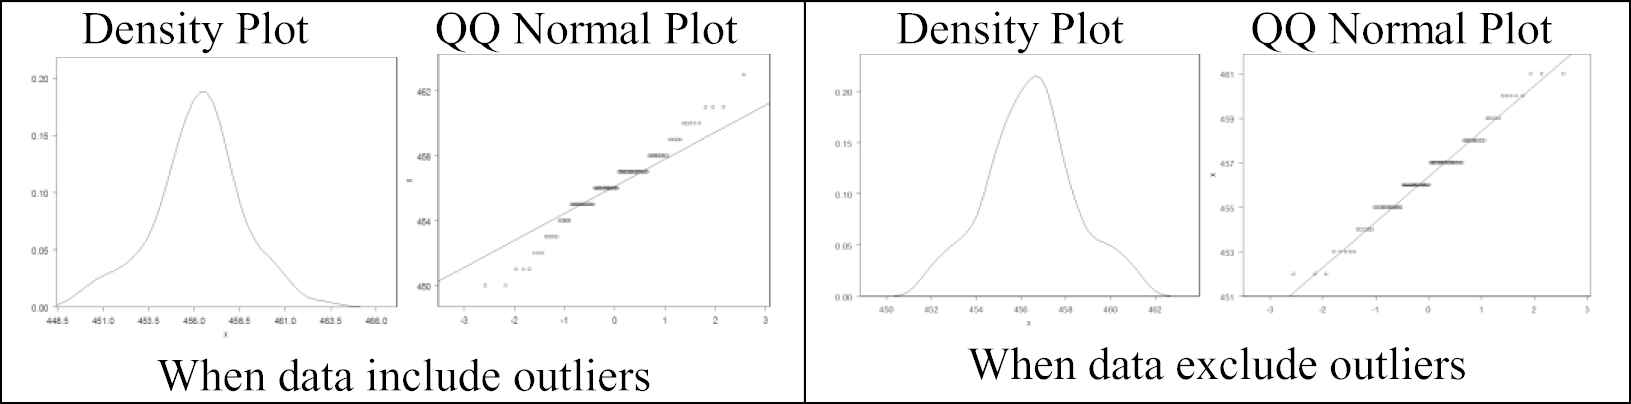
In Figure 2 gives the two conclusions: one the density and QQ plots indicate the data set is positively skewed and normal characteristics when the data contain outliers, another graphs look negatively skewed and non-normal pattern because of free from contamination.

A graphical comparison of normality when data hold outliers and not.
From Table 2 demonstrate that the classical measures
| JB/RJB Value | p-Value | Remarks | ||||||||||
|---|---|---|---|---|---|---|---|---|---|---|---|---|
| WO | WOO | WO | WOO | WO | WOO | WO | WOO | WO | WOO | WO | WOO | |
| Classical | 0.000031 | −8.053 |
0.0166 | 0.0037 | 2.941 | 2.044 | 0.0057 | 1.0659 | 0.997 | 0.586 | Normal | Not normal |
| Proposed | −0.00001 | −8.559 |
0.0075 | 0.0067 | 1.919 | 1.794 | 1.4606 | 1.6970 | 0.482 | 0.428 | Not normal | Not normal |
Four measures of the diameter of individual grains of soil, such as porosity, data with outliers (WO) and without outliers (WOO).
Again, we assume a real data; the weight of packaged product data is taken from [17], which is consists of 100 observations. Initially, we confirm outliers by usual method (Med-MAD) [18,19]; it detects 6 outliers (cases 29, 50, 70, 71, 75 and 81). We test out the normality of the data set by graphical and analytical methods, which results have shown below:
From Figure 3 demonstrate that the data display positively skewed and non-normal because the points do fall far from a straight line in QQ-plot when the data contain extreme values. Conversely, we show that the data exhibit negatively skewed and normal for the reason that the points do drop over the straight line in QQ-plot when the data set is free from outliers.
A graphical comparison of normality when data have outliers and not.
From Table 3 shows that the classical statistics
| JB/RJB Value | p-Value | Remarks | ||||||||||
|---|---|---|---|---|---|---|---|---|---|---|---|---|
| WO | WOO | WO | WOO | WO | WOO | WO | WOO | WO | WOO | WO | WOO | |
| Classical | 2.688 | −0.6001 | 0.0352 | 0.0054 | 3.442 | 2.933 | 0.836 | 0.0179 | 0.658 | 0.9910 | Not normal | Normal |
| Proposed | −1.015 | −0.7407 | 0.0120 | 0.0164 | 2.650 | 2.670 | 0.512 | 0.4297 | 0.774 | 0.8066 | Normal | Normal |
Four measures of the weight of packaged product data with outliers (WO) and without outliers (WOO).
4. REPORT OF MONTE CARLO SIMULATION STUDY
In this section, we report a Monte Carlo simulation study which is aim to compare the performance of the newly proposed robust measure of moment
From Table 4 shows that the classical measure
| Power (In Percentage) |
||||
|---|---|---|---|---|
| JB/RJB | ||||
| n = 50 | ||||
| Classical | 13.39 | 13.39 | 13.39 | 13.39 |
| Proposed | 1.31 | 1.31 | 1.31 | 1.31 |
| n = 100 | ||||
| Classical | 19.64 | 19.64 | 19.64 | 19.64 |
| Proposed | 0.97 | 0.97 | 0.97 | 0.97 |
| n = 200 | ||||
| Classical | 27.58 | 27.58 | 27.58 | 27.58 |
| Proposed | 0.053 | 0.053 | 0.053 | 0.053 |
| n = 500 | ||||
| Classical | 31.89 | 31.89 | 31.89 | 31.89 |
| Proposed | 0.0019 | 0.0019 | 0.0019 | 0.0019 |
| n = 1000 | ||||
| Classical | 37.49 | 37.49 | 37.49 | 37.49 |
| Proposed | 0.0004 | 0.0004 | 0.0004 | 0.0004 |
Performance comparison under not normal.
From Table 5 reports that the classical measure
| Power (In Percentage) |
||||
|---|---|---|---|---|
| JB/RJB | ||||
| n = 50 | ||||
| Classical | 7.60 | 7.60 | 7.60 | 7.60 |
| Proposed | 93.47 | 93.47 | 93.47 | 93.47 |
| n = 100 | ||||
| Classical | 11.81 | 11.81 | 11.81 | 11.81 |
| Proposed | 98.89 | 98.89 | 98.89 | 98.89 |
| n = 200 | ||||
| Classical | 18.99 | 18.99 | 18.99 | 18.99 |
| Proposed | 100 | 100 | 100 | 100 |
| n = 500 | ||||
| Classical | 34.03 | 34.03 | 34.03 | 34.03 |
| Proposed | 100 | 100 | 100 | 100 |
| n = 1000 | ||||
| Classical | 39.68 | 39.68 | 39.68 | 39.68 |
| Proposed | 100 | 100 | 100 | 100 |
Performance comparison under normal.
Analyzing the above discussion, we demonstrate that the proposed measures and test give right outcome when the data set is normal and not normal. So over all we can say that the proposed measures and test are better than any other measures and tests to check the normality.
5. CONCLUSION
In this paper, to sum up the whole aforesaid discussion, our main objectives was to propose a new robust measures of moments, skewness, kurtosis which represent the data better than any others existing tools. We also propose a new statistic of Jarque–Bera test of normality, so that it can correctly identify right inference than any others existing tests. Both cases we have seen that irrespective of the presence of outliers or not, our newly proposed robust measures of moments, skewness, kurtosis and RJB test performs better than other classical measures and tests for different sample sizes. Note that our proposed measures fulfill the various properties and conditions which we proved in Appendices. Mention that all existing graphical and analytical measures and test of normality fail to identify appropriate outcome for real data sets and small to moderate sample sizes when outliers present in the data sets. Not only that, both the real-life data and simulation study demonstrate that our newly proposed robust moments, robust skewness, robust kurtosis and RJB test of normality have given more actual sound results in a variety of situations and hence can be recommended to use an effective measures and test.
CONFLICTS OF INTEREST
The authors declare they have no conflicts of interest.
AUTHORS' CONTRIBUTIONS
Md.Siraj-Ud-Doulah conceived and designed the study, analyzed the data, interpretation of the data and wrote the manuscript. The final version of the manuscript was reviewed and approved by the author.
ACKNOWLEDGMENTS
The author would like to thank the anonymous referees for their helpful remarks.
REFERENCES
Cite this article
TY  - JOUR
AU  - Md. Siraj-Ud-Doulah
PY  - 2021
DA  - 2021/05/31
TI  - An Alternative Measures of Moments Skewness Kurtosis and JB Test of Normality
JO  - Journal of Statistical Theory and Applications
SP  - 219
EP  - 227
VL  - 20
IS  - 2
SN  - 2214-1766
UR  - https://doi.org/10.2991/jsta.d.210525.002
DO  - 10.2991/jsta.d.210525.002
ID  - Siraj-Ud-Doulah2021
ER  -