
A new teaching model of the systemic circulation that incorporates reservoir characteristics
- DOI
- 10.1016/j.artres.2015.02.001How to use a DOI?
- Keywords
- Wave intensity analysis; Hydraulic model; Systemic circulation; Arterial-ventricular coupling; Elastance; Compliance
- Abstract
A hydraulic teaching model of the human systemic circulation is proposed, based on the principles of the reservoir-wave approach. Reservoir characteristics are portrayed by the arterial tall-and-narrow and venous short-and-wide columns, the relative compliances of which are signified by their diameters. Wave characteristics are represented by proximal arterial and venous resistances; rapid left ventricular ejection and rapid right atrial filling cause flow-dependent pressure drops across the respective resistances. (The value of the proximal arterial resistance is numerically equal to the characteristic impedance.) The pressure drop across the proximal arterial resistance, excess pressure, is understood to be fundamentally wave-related and has been shown to be a measure of the efficiency of cardiac-vascular coupling. Excess pressure also predicts an incremental risk of cardiovascular morbidity and largely accounts for the hysteresis evidenced by an open aortic pressure-volume loop.
- Copyright
- © 2015 Association for Research into Arterial Structure and Physiology. Published by Elsevier B.V. All rights reserved.
- Open Access
- This is an open access article distributed under the CC BY-NC license.
Recent conceptual advances regarding wave travel in the systemic circulation point to the need of a new teaching diagram that would represent these advances semi-quantitatively, intuitively, and accurately.
With this new teaching diagram (Fig. 1), we consider the heart to be a pulsating, reciprocating pump that, by generating waves that increase pressure and velocity, transfers blood from the low-pressure/high-compliance venous reservoir (on the right) to a high-pressure/low-compliance arterial reservoir (on the left), somewhat similar to the model proposed by Shoukas and Sagawa.1 The reservoirs are separated functionally by a resistance — conventionally, by systemic vascular resistance but, as explained below, by a series of resistances that we have defined.2 The higher the cardiac output, the higher the pressure in the arterial reservoir and the lower the pressure in the venous reservoir. Blood flows passively from the arterial to the venous reservoir via the microcirculatory resistance (v.i.).
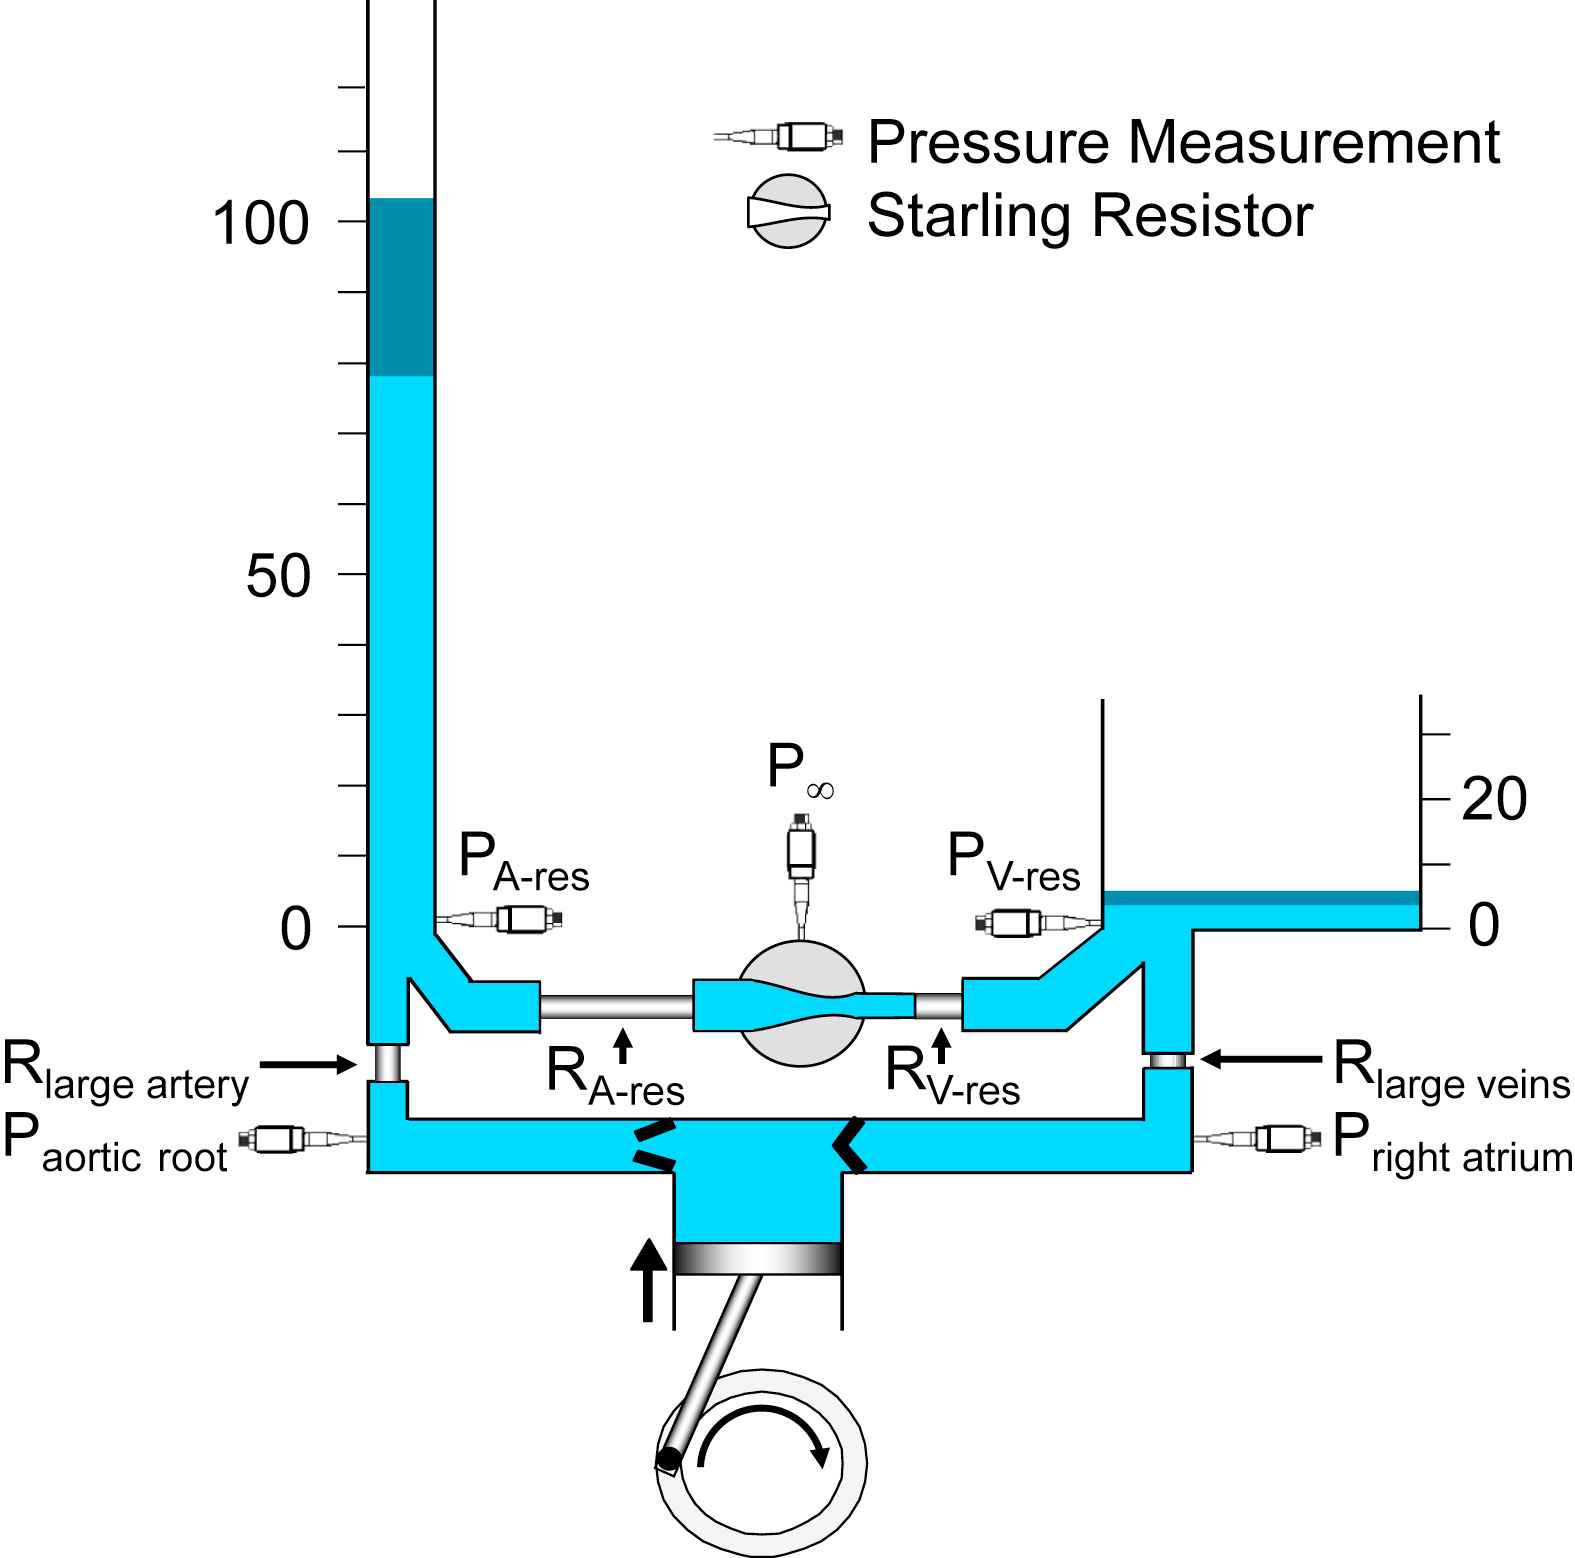
A hydraulic model of the systemic circulation illustrating the essential features of the reservoir-wave approach. The left ventricle is represented by the cylinder and piston, coupled to a crank. Pressure transducers are represented schematically. Note that arterial (PA-res) and venous (PV-res) pressures are measured at the bottom of their respective reservoirs, thus reflecting the height of the column of liquid, measured in mmHg. The dark-blue segments at the tops of the arterial and venous reservoirs indicate the typical amplitudes of the changes in reservoir pressures. Aortic root (Paortic root) and right atrial (Pright atrium) pressures are respectively higher and lower than their reservoir pressures, because of the flow-related pressure drops across the large artery (Rlarge artery) and large vein (Rlarge veins) resistances. The relative magnitudes of the resistances are represented by their lengths and correspond approximately to the values calculated from data measured in the normal dog.37 The Starling resistor between the arterial reservoir (RA-res) and venous reservoir (RV-res) resistances is represented schematically as a pressurized chamber (P∞) that encloses a collapsible segment of tubing.
Guyton’s approach to the relation between venous return (cardiac output in the steady state) and systemic venous pressure3 is well-known but Levy4 offered a provocative alternative interpretation in which the inverse relation between cardiac output and central venous pressure was explained as increasing cardiac output depleting the venous reservoir, as shown in Fig. 1. Further, we developed an approach whereby the mobilization of peripherally stored blood, sometimes attributed to “increased venous return”, is represented instead by a shift in a venous pressure–volume relationship toward the pressure axis.5–10 Shifts in the venous pressure–volume relationship occur over several seconds or minutes.
Wave intensity analysis (WIA) and the reservoir-wave approach (RWA) focus on individual cardiac cycles which, with this new teaching model, we attempt to accommodate. WIA was developed by Parker and his colleagues.11,12 Wave intensity is calculated from the differentials of pressure and velocity and has the outstanding features of being able to discriminate forward from backward waves and to identify their character — whether they increase (compression waves) or decrease (decompression waves) pressure as they pass. However, it later became clear to us that although waves change pressure, pressures may also change if the volume of an elastic vessel changes or if the elastance of a cardiac chamber changes.13 Thus, we modified WIA such that the volume- or elastance-dependent change in pressure is calculated first and then subtracted from the measured pressure.13 This yields “excess pressure”,14 which we interpret as being fundamentally wave-related. We have called this modified analysis the RWA.15,16 The essential concepts of the RWA are illustrated in Fig. 2,15 in which changes in reservoir pressure may thought to be analogous tidal excursions over which changes in wave pressure may be superimposed.
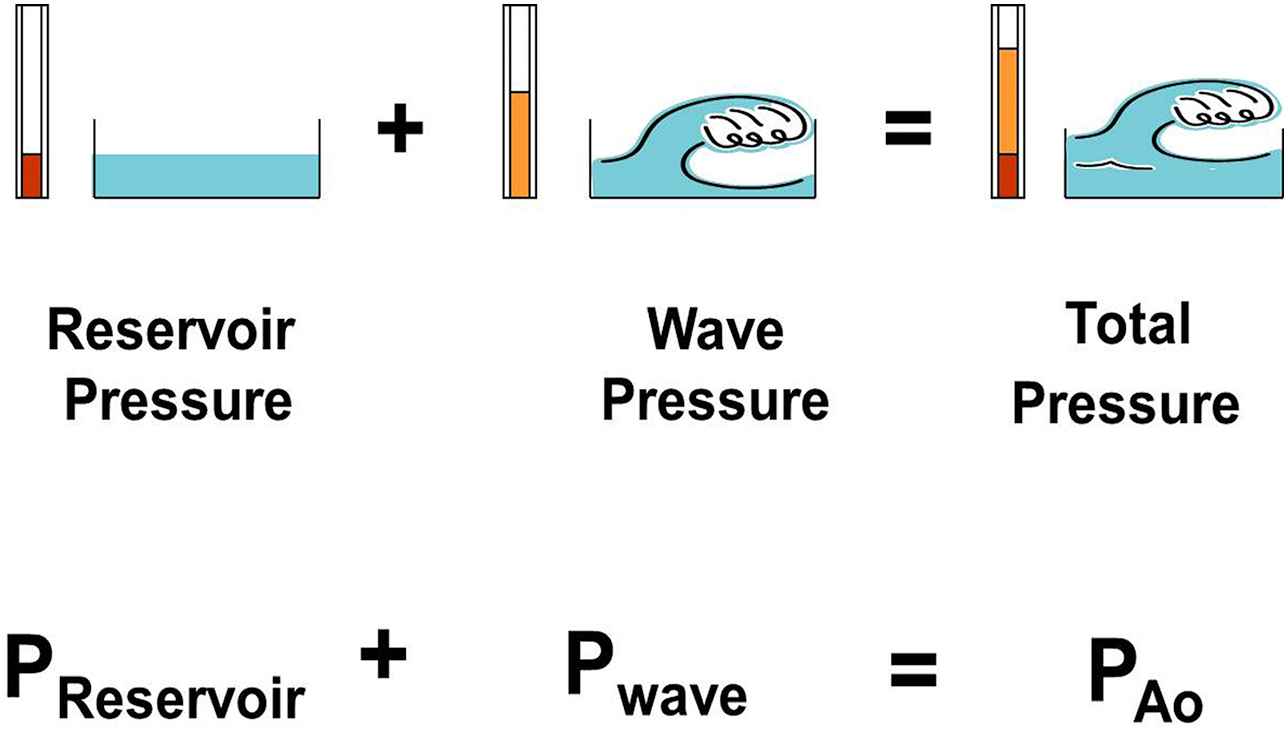
A figure illustrating the concept that changes in measured aortic pressure are equal to the sum of the changes in reservoir pressure and wave (excess) pressure. (From Tyberg et al.15 with permission of Elsevier Ireland Ltd.)
The new model (Fig. 1) differs from the previous one9 by the presence of a cyclic pump with inflow and outflow valves and a detailed representation of the arterio-venous resistance (systemic vascular resistance). A resistor between the left ventricle (Rlarge artery) and the arterial reservoir and another, between the venous reservoir and the right atrium (Rlarge vein), have been added. As others have done,4 the pulmonary circulation has been ignored for simplicity at the current time. However, an equivalent pulmonary model could be constructed, based on the recent findings of Bouwmeester et al.17–19 Also, the microvascular resistance has been expanded into arterial (RA-res) and venous (RV-res) reservoir resistances and a Starling resistor.20 The Starling resistor is represented as a pressurized container traversed by a flexible conduit. If the inflow pressure of the conduit falls to the pressure in the container, inflow (i.e., arterial outflow) ceases, thus defining P∞.13 The resistance of the flexible conduit represents microvascular resistance.
Rlarge artery corresponds to the proximal resistance in our interpretation16 of Westerhof’s classic 3-element Windkessel.21–23 In our interpretation, the proximal resistance functionally separates the left ventricle from the distal resistance and the compliance (i.e., the RC “filter”), which are properties of the arterial reservoir. As we pointed out,13 the numerical value of Rlarge artery2 is identical to “characteristic impedance”. Characteristic impedance has been a somewhat arcane concept, accessible only to those who are comfortable with frequency-domain analysis. When elevated, characteristic impedance was shown to be associated with systolic hypertension,24 which in turn was associated with narrowed and/or stiffened aortas.25–27 Perhaps all this became more understandable when characteristic impedance was equated to proximal resistance, as it was originally represented.22 Changes in this resistance selectively modify systolic pressure.16,28 It has been suggested that excess pressure, which is the systolic pressure drop across the proximal resistance, is a measure of the inefficiency of cardiac-vascular coupling.29 Also, Davies et al. have shown that a function of excess pressure predicts an incremental risk of cardiovascular disease30 and Schultz et al., have shown that excess pressure largely accounts for the hysteresis evidenced by an open aortic pressure-volume loop.31
Rlarge vein2 is equal to the ratio of venous excess pressure to (right atrial) inflow. Although it has not been studied, we would expect that increased (proximal) venous resistance might be shown to explain increased amplitude of right atrial pressure during rapid filling.
The dark-blue segments at the tops of the arterial and venous reservoirs indicate the typical amplitudes of the changes in reservoir pressures.
Others have questioned the validity of the separation of aortic pressure into the sum of excess and reservoir pressure.32–34 We have dealt with these concerns in as much detail as possible15,35 but more time will have to pass before the status of the RWA is settled. We recognize that all models have limitations, including the one proposed here. As Milnor said, results from mathematical models tell us the “implications of the hypotheses built into the model, hypotheses that may or may not be valid in living animals”.36 We hope that clinical investigators will continue to evaluate the utility of the RWA and that experimental investigators and modelers will continue to evaluate its validity. In the future, each student of arterial hemodynamics will have to decide which better represents “reality” — experimental data or computational results.
This new dynamic model of the systemic circulation incorporates proximal arterial and venous resistances and should help the student of cardiovascular physiology understand their substantial importance.
Conflict of interest
The authors have no conflicts of interest or financial disclosures to declare.
Acknowledgments
The authors are grateful for the helpful suggestions of Dr. Israel Belenkie and the superb surgical skills of Cheryl Meek.
References
Cite this article
TY  - JOUR
AU  - John V. Tyberg
AU  - J. Christopher Bouwmeester
AU  - Lindsay M. Burrowes
AU  - Kim H. Parker
AU  - Nigel G. Shrive
AU  - Jiun-Jr. Wang
PY  - 2015
DA  - 2015/02/24
TI  - A new teaching model of the systemic circulation that incorporates reservoir characteristics
JO  - Artery Research
SP  - 38
EP  - 41
VL  - 10
IS  - C
SN  - 1876-4401
UR  - https://doi.org/10.1016/j.artres.2015.02.001
DO  - 10.1016/j.artres.2015.02.001
ID  - Tyberg2015
ER  -