
Validation of a new piezo-electronic device for non-invasive measurement of arterial pulse wave velocity according to the artery society guidelines
- DOI
- 10.1016/j.artres.2015.03.001How to use a DOI?
- Keywords
- Arterial stiffness; Pulse wave velocity; Validation; Piezo-electronic
- Abstract
Our aim was to validate a new device for pulse wave velocity (PWV) measurement – Aortic according to the recommendations of the Artery Society and using SphygmoCor as the comparator device.
Methods: 85 subjects 18–80 years-old from both sexes were included, divided into 3 age-groups: <30, 30–60 and >60 years (minimum of 25 individuals per group) and with an equal number of hypertensive and normotensive subjects per group. Weight, height, blood pressure (BP) and PWV were assessed, performing 6 PWV determinations per subject: 3 with Aortic and 3 with SphygmoCor, in an alternate fashion. The Bland–Altman method was used to establish the level of agreement between the two devices.
Results: PWV was 6.96 (±1.84) and 7 (±1.54) m/s with Aortic and SphygmoCor, respectively, showing a high correlation: r = 0.89, p < 0.001. Applying the Bland–Altman method, the mean difference between devices was 0.02 (±0.84) m/s, which is considered an excellent level of agreement. Of the study population, 75.3% (n = 64), 15.3% (n = 13) and 9.4% (n = 8) reached an excellent (mean difference ≤0.5 ± 0.8 m/s), acceptable (mean difference ≤1.0 ± 1.5 m/s) and poor (mean difference ≥ 1.0 ± 1.5 m/s) level of agreement, respectively.
Conclusion: Aortic showed an excellent level of agreement with SphygmoCor, the reference method, according to the Artery Society recommendations for PWV measurement. This was observed particularly for lower PWV values.
- Copyright
- © 2015 Association for Research into Arterial Structure and Physiology. Published by Elsevier B.V. All rights reserved.
- Open Access
- This is an open access article distributed under the CC BY-NC license.
Introduction
Cardiovascular diseases are the worldwide main cause of morbidity and mortality. As a result, researchers are continuously searching different markers that allow to identify subjects at risk of cardiovascular events.1
During the last decades, large population-based studies such as the Framingham,2,3 the Mr. Fit4 and the Interheart5 study identified which is now known as traditional cardiovascular risk factors.
The interest on vascular structure and function has recently increased and arterial stiffness is now considered a cardiovascular risk marker.6,7 Particularly, aortic stiffness measured through the carotid-femoral pulse wave velocity (PWV) has an independent predictive value for all-cause and cardiovascular mortality,8 fatal and non-fatal coronary events9 and fatal stroke in hypertensive patients,10 type 2 diabetics,11 subjects with chronic kidney disease12 and the general population,13 even after adjusting for traditional risk factors and blood pressure (BP) level. This would indicate that arterial stiffness has a predictive value higher than each traditional risk factor alone and it is currently accepted as an intermediate step in the progression to established cardiovascular disease. Carotid-femoral PWV is currently considered the gold standard for the measurement of regional arterial stiffness.14 Several authors acknowledge that there is enough evidence to include the PWV assessment in the routinely evaluation of subjects at possible cardiovascular risk.15 This concept has been reinforced by the recently published guidelines for the evaluation and management of hypertension.11
In order to incorporate PWV assessment in clinical practice, not only a standardized technique is required, but also the increased availability of properly validated devices is crucial. The aim of our study was to validate a new device for carotid-femoral PWV measurement (Aortic), according to the ARTERY Society guidelines for validation of non-invasive hemodynamic measurement devices,17 using SphygmoCor as the comparator device.
Methods
Study population
Subjects from both sexes 18–80 years old were included. They were classified into 3 groups, according to their age: <30 years, 30–60 years and >60 years, with a minimum of 25 individuals per group.17 The same number of healthy volunteers and hypertensive patients was included in each group.
Individuals with a body mass index (BMI) > 30, pregnant women, patients with arrhythmia or pacemaker, patients with significant stenoses of the femoral or carotid arteries or a history of stent or surgery, patients with carotid sinus hypersensitivity and subjects in whom the carotid or femoral pulse was not palpable were excluded from the study.17
The study protocol was approved by the local ethics committee and participants gave written informed consent.
Anthropometric and blood pressure measurements
Weight and height were assessed in all patients and body mass index (BMI) was calculated as weight/height2 (kg/m2). Blood pressure (BP) and pulse rate were subsequently measured thrice following the recommendations of the European Society of Hypertension,16 in the non-dominant arm, two minutes apart (average of the last two readings was used for analysis), after a five minute rest with the patient in a supine position, and using an appropriate cuff size according to their arm circumference. For this purpose, an automatic oscillometric device Omron 705 CP (Omron Corp., Tokyo, Japan) was used.
Pulse wave velocity
Carotid-femoral pulse wave velocity (PWV) is currently considered the gold standard for measurement of arterial stiffness. Distance traveled by the pulse wave (D), expressed in meters, and transit time (TT), expressed in seconds, are used for its determination (PWV = D/TT m/s).14
PWV can be obtained through two different methods: the simultaneous measurement of both carotid and femoral pulse waves, or sequentially, using the ECG for the synchronization of the waves. Both methods have previously been validated.18,19
SphygmoCor (AtCor Medical, Sydney, Australia) was used as the comparator device. It uses a tonometric Millar transducer, allowing carotid-femoral PWV measurements in two steps: the first step is used to simultaneously record carotid pulse wave and ECG whereas the second step is the recording of femoral pulse wave and ECG. ECG recording during measurements is crucial for synchronization of carotid and femoral pulse wave times. The foot-to-foot method is applied in order to determine transit time between carotid and femoral pressure waves. In turn, intersecting tangent algorithms are used to identify such wave foots. In order to calculate the traveled distance, two distances on the body surface are measured: from the sternal notch to the femoral location and from the sternal notch to the carotid location of respective pulse wave recording. Traveled distance is automatically calculated as the difference between the femoral location-sternal notch minus the sternal notch-carotid location.21
The device validated in the present study is Aortic (Exxer, Buenos Aires, Argentina), which uses simultaneous pressure signals sampled at 1 KHz on 24 bits, allowing PWV determination in one step, given that two piezo-electronic transducers simultaneously register PWV at the neck and at the groin. This method has the advantage of avoiding changes in baseline conditions, such as the pulse rate, that can occur when waves are registered sequentially, as it is the case of SphygmoCor. Transit time between both wave foots are then calculated in milliseconds, using the foot-to-foot method, similar to SphygmoCor. The pulse waveform signal is filtered with a 20 Hz low-pass filter. First, the point of the maximum positive slope previous to the initiation of the QRS complex is identified and measured, then the point in which such slope is the 20% of the maximum value found is calculated. This point represents the wave foot (Supplementary figure).
The study participants were asked to avoid alcoholic and caffeinated beverages 10 and 3 h prior to the measurements, respectively. Given that tobacco acutely increases arterial stiffness, subjects were asked to refrain from smoking 3 h before measurements.
In order to keep baseline conditions, the protocol was carried out in a quiet environment, with stable temperature at 22 °C and isolated from external noises. The procedure was clearly explained to participants and they were instructed to avoid talking or sleeping during measurements.
PWV was registered thrice with SphygmoCor and with Aortic in an alternate fashion, always on the right side of the subject in the supine position and by the same observer. The sequence of measurements was initiated with SphygmoCor or Aortic also in an alternate fashion. The distances between the carotid artery to the sternal notch and from there to the femoral artery were registered, introducing the values into both equipments’ software. In both cases the carotid-sternal notch distance was subtracted from the carotid-femoral distance. The carotid-sternal notch distance was measured with a flexible and inextensible metallic measuring tape whereas the sternal notch-femoral distance was registered using a pediatric anthropometer to avoid a possible source of bias due to large bust or abdominal obesity. Each point was marked using an anthropometric pencil to allow the six measurements to be performed using exactly the same distances. Between each pair of determinations (Sphygmocor-Aortic), BP and pulse rate were registered to confirm the maintenance of baseline conditions.
Sample size calculation
Sample size calculation was performed according to the recommendations of the international guidelines for validation of non-invasive hemodynamic measurement devices,17 taking into account that the Bland–Altman method(21) would be used in the statistical analysis.
In previous studies the standard deviation of the between measurement differences obtained with two devices was 0.8 m/s. Therefore, to obtain a confidence interval of the mean differences of 0.08 m/s, a minimum of 83 eligible subjects for analysis were required. To detect any tendency regarding the differences with the mean value with both methods, a wide range of PWV values was considered. Given that sex and age are determinants of PWV values, subjects were stratified according to age: <30 years, 30–60 years and >60 years, with a minimum of 25 individuals per stratum, and at least 40% of either sex.17
Statistical analysis
In each subject, average of the three PWV measurements with each device was analyzed. The Bland–Altman method was used to evaluate the level of agreement between the two devices.
A scatter plot of mean values for each subject from Aortic and Sphygmocor was examined to determine if there was a trend in the data. The slope, intercept, root mean square (RMSE) error and R2 coefficient were calculated.
The difference between values obtained by the two devices was plotted against the mean for both devices. This Bland–Altman plot was inspected to determine if there was bias in the data. For formal assessment of the presence of bias and trend in the variability of the between-method differences, one-way ANOVA test for linear trend was applied.22
The precision of the tested device (Aortic) was compared to the standard method (SphygmoCor) through the mean difference and standard deviation (SD), determining the 95% confidence interval (95%CI) for the mean difference and the upper and lower limit of agreement. The device’s precision was considered excellent when mean difference between devices was ≤0.5 m/s and SD ≤ 0.8 m/s, acceptable when <1.0 m/s and SD ≤ 1.5 m/s and poor when ≥1.0 m/s and SD > 1.5 m/s.17
The repeatability was evaluated through the coefficient of repeatability, calculated as 1.96 (∼2) times the within-subject standard deviation and the within–subject coefficient of variation (WCV) for repeated measurements.
Results
Initially, the study included 87 subjects. From them, two subjects were excluded from analysis: one normotensive subject because of an elevated BP level during the study visit and one hypertensive patient due to the impossibility to maintain baseline conditions during measurements, possibly because of anxiety. Therefore, 85 individuals were finally analyzed: 45 women and 40 men, mean age 46 years, half of them normotensive subjects and the other half hypertensives under treatment (Table 1). Given that 6 PWV measurements per patient were performed (3 with each device), 510 determinations were analyzed in the study.
| Variable | n = 85 |
|---|---|
| Age (years, range) | 46 (18–80) |
| Sex (male/female%) | 47.1/52.9 |
| Weight (kg, ±SD) | 72 ± 12.6 |
| Height (cm, ±SD) | 169 ± 10 |
| BMI (kg/m2, ±SD) | 25.1 ± 2.8 |
| SBP (mmHg, ±SD) | 123.8 ± 13.8 |
| DBP (mmHg, ±SD) | 72.6 ± 7.12 |
| SphygmoCor PWV (m/s, ±SD) | 7.0 ± 1.54 |
| Aortic PWV (m/s, ±SD) | 6.96 ± 1.84 |
| PWV difference | 0.04 ± 0.3 |
| SphygmoCor/Aortic (m/s, ±SD) | |
| SphygmoCor HR (bpm, ±SD) | 70.1 ± 10.5 |
| Aortic HR (bpm, ±SD) | 70.1 ± 10.1 |
| HR difference | 0.02 ± 2.3 |
| SphygmoCor/Aortic (bpm, ±SD) |
BMI = body mass index; bpm = beats per minute; DBP = diastolic blood pressure; HR = heart rate; PWV = pulse wave velocity; SBP = systolic blood pressure; SD = standard deviation.
Clinical characteristics and hemodynamic parameters of the study population.
Mean systolic and diastolic BP levels were 123.8 (±13.8) and 72.6 (±7.12) mmHg, respectively. Mean PWV values were 7 (±1.54) m/s, obtained with SphygmoCor, and 6.96 (±1.84) m/s, obtained with Aortic. Between devices’ mean difference was 0.04 m/s (Table 1). PWV values ranged from 4 to 11.2 m/s for SphygmoCor and from 4.23 to 13.10 m/s for Aortic.
The comparison between tonometric (SphygmoCor) with piezo-electronic measurements (Aortic) showed a highly significant correlation: r = 0.89, p < 0.001 (y = 1.0805x – 0.5958, RMSE 0.831, R2 = 0.799).
However, higher differences were observed in the upper extreme of PWV values (p trend = 0.009), similar to those described when comparing the Complior (piezo-electronic) and SphygmoCor, two devices recommended as reference methods by the Artery Society (Fig. 1).17
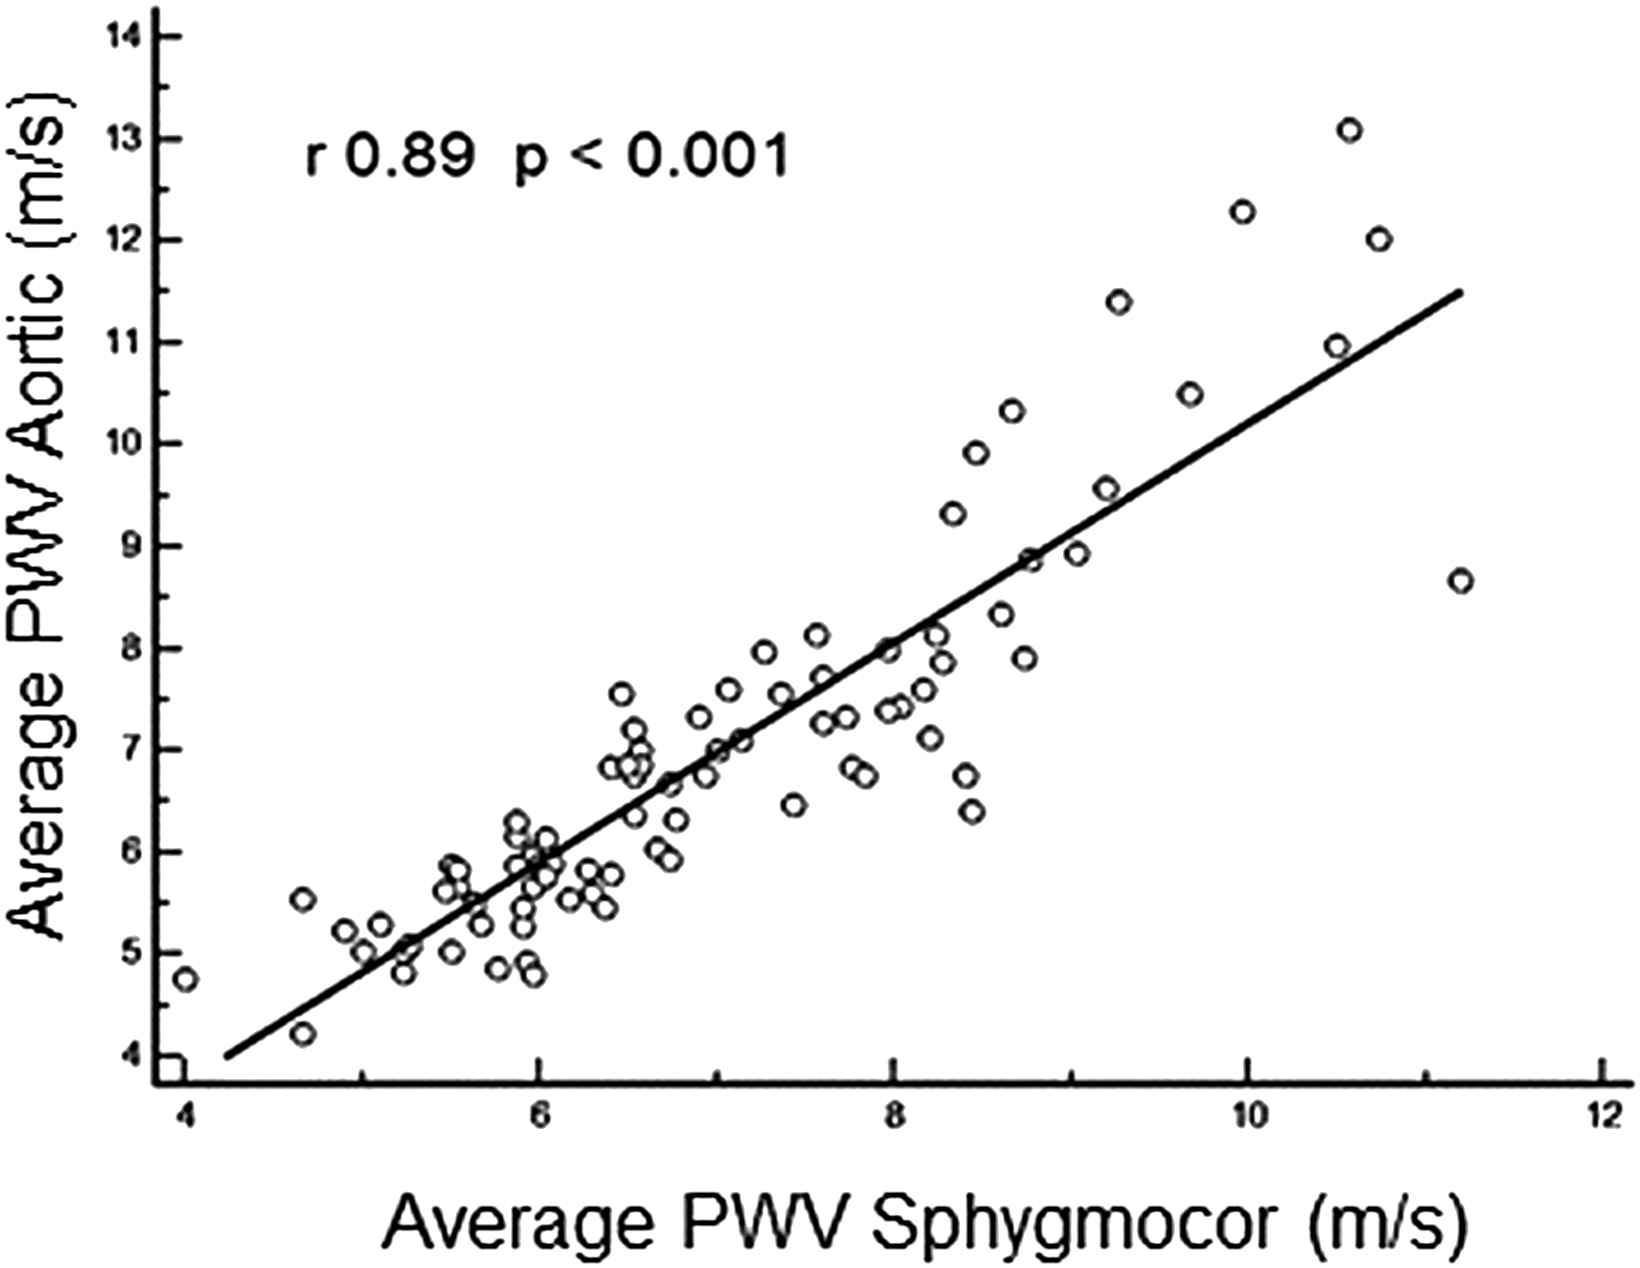
Scatter plot showing average pulse wave velocity determined by Aortic and Sphygmocor.
When the Bland–Altman method was applied to evaluate the level of agreement between the devices, the mean difference was 0.02 (±0.84) m/s, which is considered excellent (Fig. 2). From the study population, the level of agreement was excellent for 75.3% (n = 64) of subjects and acceptable for 15.3% (n = 13). Only 9.4% (n = 8) had a poor level of agreement.
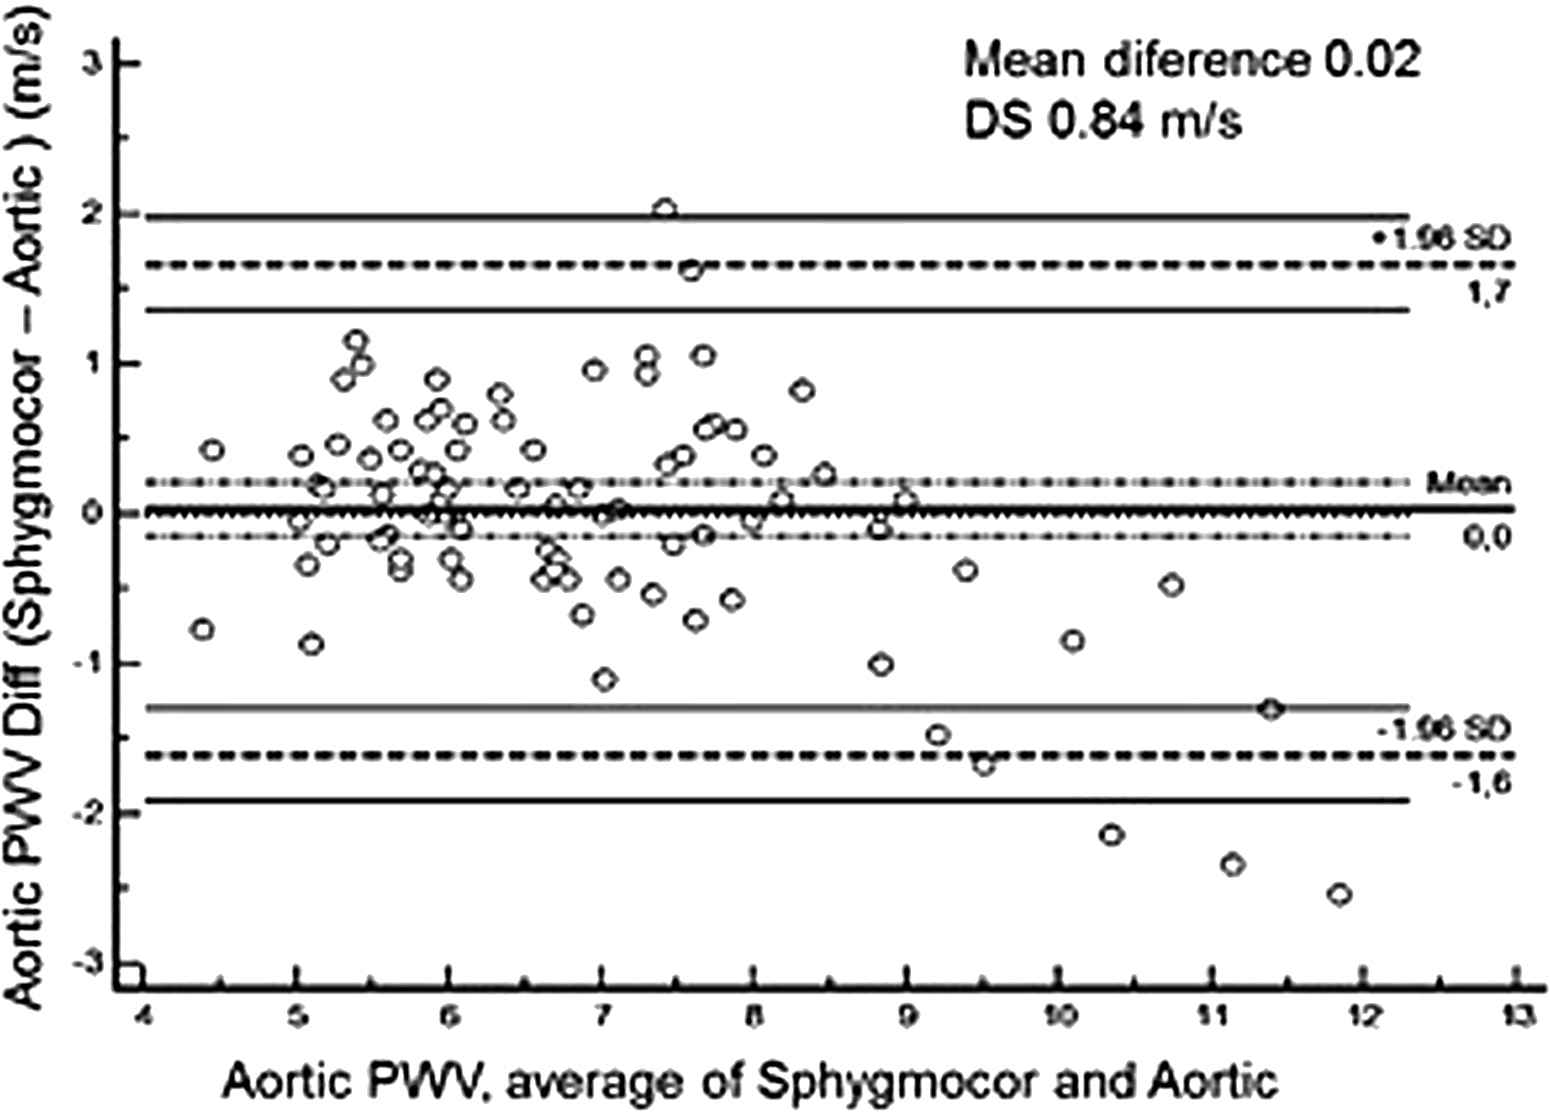
Bland–Altman plot of the difference between measurements of pulse wave velocity by SphygmoCor and Aortic.
The coefficient of repeatability was 1.13 m/s for Aortic and 1.55 m/s for Sphygmocor and WVC was 8.5% and 11.1%, respectively.
Discussion
In our study we found an excellent level of agreement between Aortic and SphygmoCor devices when measuring the carotid-femoral PWV according to the Artery Society guidelines for validation of non-invasive hemodynamic measurement devices.17
Given that the factors that have an influence on BP also directly or indirectly influence arterial stiffness,26,17 we were extremely careful in controlling and maintaining baseline conditions during the whole study.
Both hypertensive and normotensive individuals were included in the study, with a wide age range (equally distributed among age groups), an adequate representation of sexes and a wide range of BP and PWV values. All these factors have been shown to cause a poor correlation when comparing different devices.23 This was not observed in our study in which we found a high correlation between Aortic and SphygmoCor (r = 0.89 p < 0.001). However, the correlation coefficient is not a measurement of the level of agreement and it could be misleading when comparing two devices or methods. A more appropriate statistical approach – such as the Bland–Altman method is required in order to estimate the 95%CI for the ability of one method to predict another. When applying this method in our study we found a mean difference between the two devices of 0.02 (±0.84) m/s, considered an excellent level of agreement according to the Artery Society criteria (≤0.5 [±0.8] m/s).17
Baulmann et al. compared SphygmoCor with the Complior (a piezo-electronic device, like ours) and with the Arteriograph (an oscillometric device), finding correlation coefficients of 0.87 (p < 0.001) and 0.67 (p < 0.001), respectively,24 whereas Rajzer et al. found a poorer correlation: 0.57 (p < 0.0001) and 0.36 (p < 0.0048), respectively.20 In this latter study, higher PWV values were found with the Complior compared to SphygmoCor, and, when analyzing both techniques, the authors arrived to the conclusion that the difference in the measured distances was the more likely explanation, given that they used the manufacturer’s recommended distances for each device.
Different methods have been recommended to establish the distance between the carotid and femoral measurement points. The ‘Expert consensus document on arterial stiffness’14 and the Task Force III25 describes three methods for measuring the traveled distance: using the total distance between the carotid and femoral sites of measurement, subtracting the distance from the carotid location to the sternal notch from the total distance, or subtracting the distance from the carotid location to the sternal notch from the distance between the sternal notch and the femoral site of measurement. More recently, it has been suggested that, taking into account studies using magnetic resonance images, the 80% of the direct carotid-femoral distance appears the most accurate.26 In our study we used the distance measurement recommended for SphygmoCor for both devices. We also attempted to avoid other sources of error regarding distance measurement by excluding subjects with a BMI>30 and pregnant women and by using an inextensible metallic measuring tape and a pediatric anthropometer and, in order to guarantee that the measured distance was exactly the same with both devices, we marked the points on the subjects’ skin.
For PWV values >8 m/s, those measured with Aortic were found to be higher than those measured with SphygmoCor. A similar finding was described by other authors when comparing the Complior and SphygmoCor.20,27 On the other hand, Millasseau et al. found higher PWV values with SphygmoCor compared to the Complior, and such difference was even higher with increasing PWV values. Interestingly, these authors used the same distance with both devices and when analyzing the possible causes of their results, they concluded that the differences were due to the different algorithms employed to determine the transit time. The contribution of other sources of variability was considered marginal.28 Similar results were obtained by Salvi et al. when comparing different devices using the manual method.29 The Artery Society recommends the use of the intersecting tangent method for transit time calculation.17,30 Although this could also be the cause of the between-devices greater differences for higher PWV values found in our study, this issue was not specifically evaluated.
Finally, our results must be interpreted within the context of the study limitations: first, all measurements were performed by the same observer and, as a consequence, the calculation of an inter-observer coefficient of variation is not possible; second, because measurements were not repeated on two separate occasions, the reproducibility cannot be established in our study.
In conclusion, Aortic, a new device for PWV measurement validated in this study, following the recommendations of the Artery Society, had an excellent level of agreement with SphygmoCor, used as the reference method. However, a trend towards higher between-device differences with increasing PWV values precludes the generalization for all the PWV values range.
Conflict of interest
The authors declare that they have no competing interests.
Grant support
None.
Acknowledgments
We are grateful to Ms Layta SILVA FONTES and to the volunteers who participated in the study.
Appendix A
Supplementary data
Supplementary data related to this article can be found at
References
Cite this article
TY  - JOUR
AU  - Margarita S. Morales
AU  - Paula E. Cuffaro
AU  - Jessica Barochiner
AU  - Marcelo A. Rada
AU  - Jose Alfie
AU  - Lucas Aparicio
AU  - Marcos Marin
AU  - Carlos R. Galarza
AU  - Gabriel D. Waisman
PY  - 2015
DA  - 2015/04/11
TI  - Validation of a new piezo-electronic device for non-invasive measurement of arterial pulse wave velocity according to the artery society guidelines
JO  - Artery Research
SP  - 32
EP  - 37
VL  - 10
IS  - C
SN  - 1876-4401
UR  - https://doi.org/10.1016/j.artres.2015.03.001
DO  - 10.1016/j.artres.2015.03.001
ID  - Morales2015
ER  -