
Central Hemodynamic Parameters are Altered in Resistant Hypertensive Individuals
- DOI
- 10.2991/artres.k.191203.002How to use a DOI?
- Keywords
- Hypertension; resistant hypertension; sodium; arterial stiffness
- Abstract
Background: Systemic arterial hypertension (SAH) is one of the major risk factors related to the development of cardiovascular diseases (CVD). Sodium intake is linked to elevated blood pressure and can be estimated by 24-h urinary sodium excretion. The objective of this study was to correlate 24 h urinary sodium excretion, blood pressure and arterial stiffness (AS) parameters in hypertensive individuals.
Methods: We evaluated 53 patients who underwent in-office 24-h blood pressure tests and AS parameters using the Mobil-O-Graph® equipment. The patients were divided into controlled hypertensive and resistant hypertensive. Unpaired t-test was performed with significance at p < 0.05.
Results: Mean age was 64.32 years; weight 77.56 kg; height 1.61 m; and BMI of 29.68 kg/m2. Resistant hypertensive patients (25 subjects) have systolic blood pressure (SBP) (p < 0.0001), diastolic blood pressure (DBP) (p = 0.004), 24 h SBP (p < 0.0001), 24 h DBP (p = 0.002), pulse pressure (PP) (p < 0.0001), central systolic blood pressure (cSBP) (p = 0.0003) and central diastolic blood pressure (cDBP) (p = 0.021) higher than controlled hypertensive patients (28 subjects).
Conclusion: Peripheral and central arterial pressures are higher in resistant hypertensive than in controlled hypertensive. Sodium excretion is unrelated to hemodynamic variables. Age is related to the elevation of central pressure and pulse wave velocity.
- Copyright
- © 2019 Association for Research into Arterial Structure and Physiology. Publishing services by Atlantis Press International B.V.
- Open Access
- This is an open access article distributed under the CC BY-NC 4.0 license (http://creativecommons.org/licenses/by-nc/4.0/).
1. INTRODUCTION
Systemic Arterial Hypertension (SAH) is known to be one of the major risk factors responsible for the development of target organ damage, such as heart, brain and kidneys, culminating in the main known Cardiovascular Diseases (CVD), including Acute Myocardial Infarction (AMI), Cerebrovascular Accident (CVA) and Chronic Kidney Disease (CKD), respectively [1]. It is also known that the prevalence of SAH in the world is in both developed and developing countries, and it is on the increase in the latter [2].
It is estimated that there are around 1.4 billion hypertensive people in the world [3], with 45 million in Brazil alone [4]. Considering this high prevalence and also taking into account the chronicity of the disease, studies that target clinical therapies for outcomes in which morbidity and mortality are decreasing and patients can live with a higher quality of life are needed.
Among the strategies for control of Blood Pressure (BP) by non-medical means, we found the reduction of sodium intake as one of the strategies. It has been found that hypertensive patients who decrease their salt intake reduce up to 5.5 mmHg of their Systolic Blood Pressure (SBP) and 2.9 mmHg of Diastolic Blood Pressure (DBP) [5].
This effect is due to the involvement of sodium in the increase of Cardiac Output (CO) and Peripheral Vascular Resistance (PVR). Increased CO occurs due to the retention volume that sodium provides, as the kidneys cannot support excreting excess ingested sodium. This leads to increased plasma volume, preload and CO [6]. Elevation of PVR, in turn, is related to complex mechanisms involving changes in the secretory properties of vascular smooth muscle cells [7]. Such mechanisms seem to be associated with the pro-fibrotic effect of Transforming Growth Factor β-1 (TGF β-1) and the reduction of Nitric Oxide (NO) bioavailability, which promote decreased vascular compliance and vasoconstriction [8].
An indirect way of estimating sodium intake is by analyzing the 24-h urinary sodium (Na+ U 24 h) test, since about 95% of ingested sodium is excreted [9]. Thus, Na+ U 24 h is very useful for analyses that relate salt consumption with arterial hypertension parameters.
To evaluate the hypertensive patient, we can use mechanisms that go beyond the measurement of brachial BP in the office. A 24-h Ambulatory Blood Pressure Monitoring (24 h ABPM) provides us with critical data for diagnosis and follow-up, as well as informing us of central BP values and parameters related to arterial stiffness (AS) such as Pulse Wave Velocity (PWV) and Augmentation Index (AI) [3,10]. All these data make it possible for the physician to proceed in his conduct with more precision and safety, knowing several unusual indicators for patient evaluation. Central BP, for example, has been shown to be important for directing antihypertensive therapy, as it more reliably expresses changes related to arterial stiffness and is a better predictor of cardiovascular mortality [11,12].
The objective of this study was to correlate Na+ U 24 h excretion with blood pressure and various arterial stiffness parameters, such as central arterial pressure, PWV and augmentation index, in individuals with controlled or resistant systemic arterial hypertension.
2. MATERIALS AND METHODS
Cross-sectional study was performed at the Hypertension Outpatient Clinic of the São José do Rio Preto Medical School - FAMERP, São Paulo State, Brazil. The sample, consisting of 53 patients, was randomly constructed, according to the appointment schedule of the mentioned service. All participants were informed about their involvement with the study and signed the Informed Consent Form (ICF) approved by the institution’s Research Ethics Committee.
Patients who participated were over 18 years, diagnosed with hypertension for at least 4 weeks, regularly enrolled in the service mentioned above. Patients who met at least one of the following criteria were excluded from the study: renal failure on dialysis program, hospitalization within the last 60 days before enrollment, hemodynamic instability requiring vasoactive drugs within 30 days prior to inclusion, heart failure with functional class III or IV, pregnancy/breastfeeding, severe liver disease, people with HIV, psychiatric disorders that prevented compliance with the protocol, stroke or AMI within 30 days prior to inclusion, severe diseases and/or cancer with a prognosis of <1 year.
Through the analysis of electronic medical records, the following data were collected: Na+ U 24 h, peripheral blood pressure measured in the office and antihypertensive drugs used by patients, in addition to confirming anthropometric data such as age, gender, weight, height and Body Mass Index (BMI).
Values related to peripheral blood pressure, central blood pressure and other parameters of arterial stiffness, such as PWV and augmentation index, were obtained through 24 h ABPM, with the Mobil-O-Graph® equipment (version 12, 2000, UK) according to the manufacturer’s instructions. Such technique increasingly becomes clinically available as a noninvasive mechanism for central pressure assessment [2].
Participants were divided into two groups: “controlled hypertensive” and “resistant hypertensive”, which was made based on analysis of the medications and blood pressure values obtained in this study, and their indicators were compared.
Descriptive analysis of quantitative variables was performed with values presented as mean and standard deviation. For comparison of central blood pressure behavior, unpaired t-test was performed in the Controlled Hypertensive and Resistant Hypertensive groups. To evaluate the correlation between Na+ U 24 h excretion and central arterial pressure, Pearson’s correlation coefficient was used. Multivariate analysis of central pressure behavior was also performed in each study group.
All statistical analyses were performed using the Sigma-Stat Statistical Software program and Graph-Pad In Stat version 5.0 (Systat Software Inc., California, USA). Sample size was estimated based on a test power of 80% and significance level of p < 0.05.
3. RESULTS
Of the 53 participants in this study, 28 were classified in the controlled hypertensive group and 25 in the resistant hypertensive group. The average age of the sample as a whole was 64.32 years; weight 77.56 kg; height 1.61 m; and BMI of 29.68 kg/m2.
The general characteristics, hemodynamic characteristics such as 24 h SBP, 24 h DBP, Pulse Pressure (PP), central SBP (cSBP), central DBP (cDBP) and PWV - corresponding values of Mobil-O-Graph® - analysis and Na+ U 24 h excretion rate are presented in Table 1, divided into controlled and resistant hypertensive groups. Some statistical differences between the groups are shown in Figure 1. The Na+ U 24 h excretion did not correlate with hemodynamic changes in both groups.
| Data | Controlled hypertensive (N = 28) | Resistant hypertensive (N = 25) | p |
|---|---|---|---|
| Age (years) | 64.107 ± 10.3435 | 64.560 ± 12.8390 | 0.889 |
| Weight (kg) | 78.804 ± 13.1257 | 76.164 ± 19.3691 | 0.569 |
| Height (m) | 1.630 ± 0.09014 | 1.595 ± 0.1052 | 0.204 |
| BMI (kg/m2) | 29.675 ± 4.6009 | 29.694 ± 6.1557 | 0.989 |
| SBP (mmHg) | 123.929 ± 9.5914 | 157.760 ± 19.4064 | <0.0001 |
| DBP (mmHg) | 74.321 ± 8.0326 | 84.640 ± 14.9328 | 0.004 |
| Heart rate HR (bpm) | 73.750 ± 8.6864 | 70.120 ± 7.8226 | 0.115 |
| SBP 24 h (mmHg) | 114.107 ± 8.0615 | 128.000 ± 12.9422 | <0.0001 |
| DBP 24 h (mmHg) | 71.500 ± 5.7639 | 74.720 ± 10.4782 | 0.002 |
| PP (mmHg) | 42.607 ± 7.4850 | 53.120 ± 8.1359 | <0.0001 |
| cSBP (mmHg) | 105.964 ± 7.4956 | 118.000 ± 13.6961 | 0.0003 |
| cDBP (mmHg) | 72.571 ± 6.0150 | 76.000 ± 10.6105 | 0.021 |
| PWV (m/s) | 8.914 ± 1.5818 | 9.444 ± 1.9935 | 0.105 |
| Na+ U 24 h (mEq/L) | 170.643 ± 83.9057 | 158.280 ± 64.1317 | 0.553 |
Mean ± standard deviation for all data presented.
General and hemodynamic characteristics of the study population
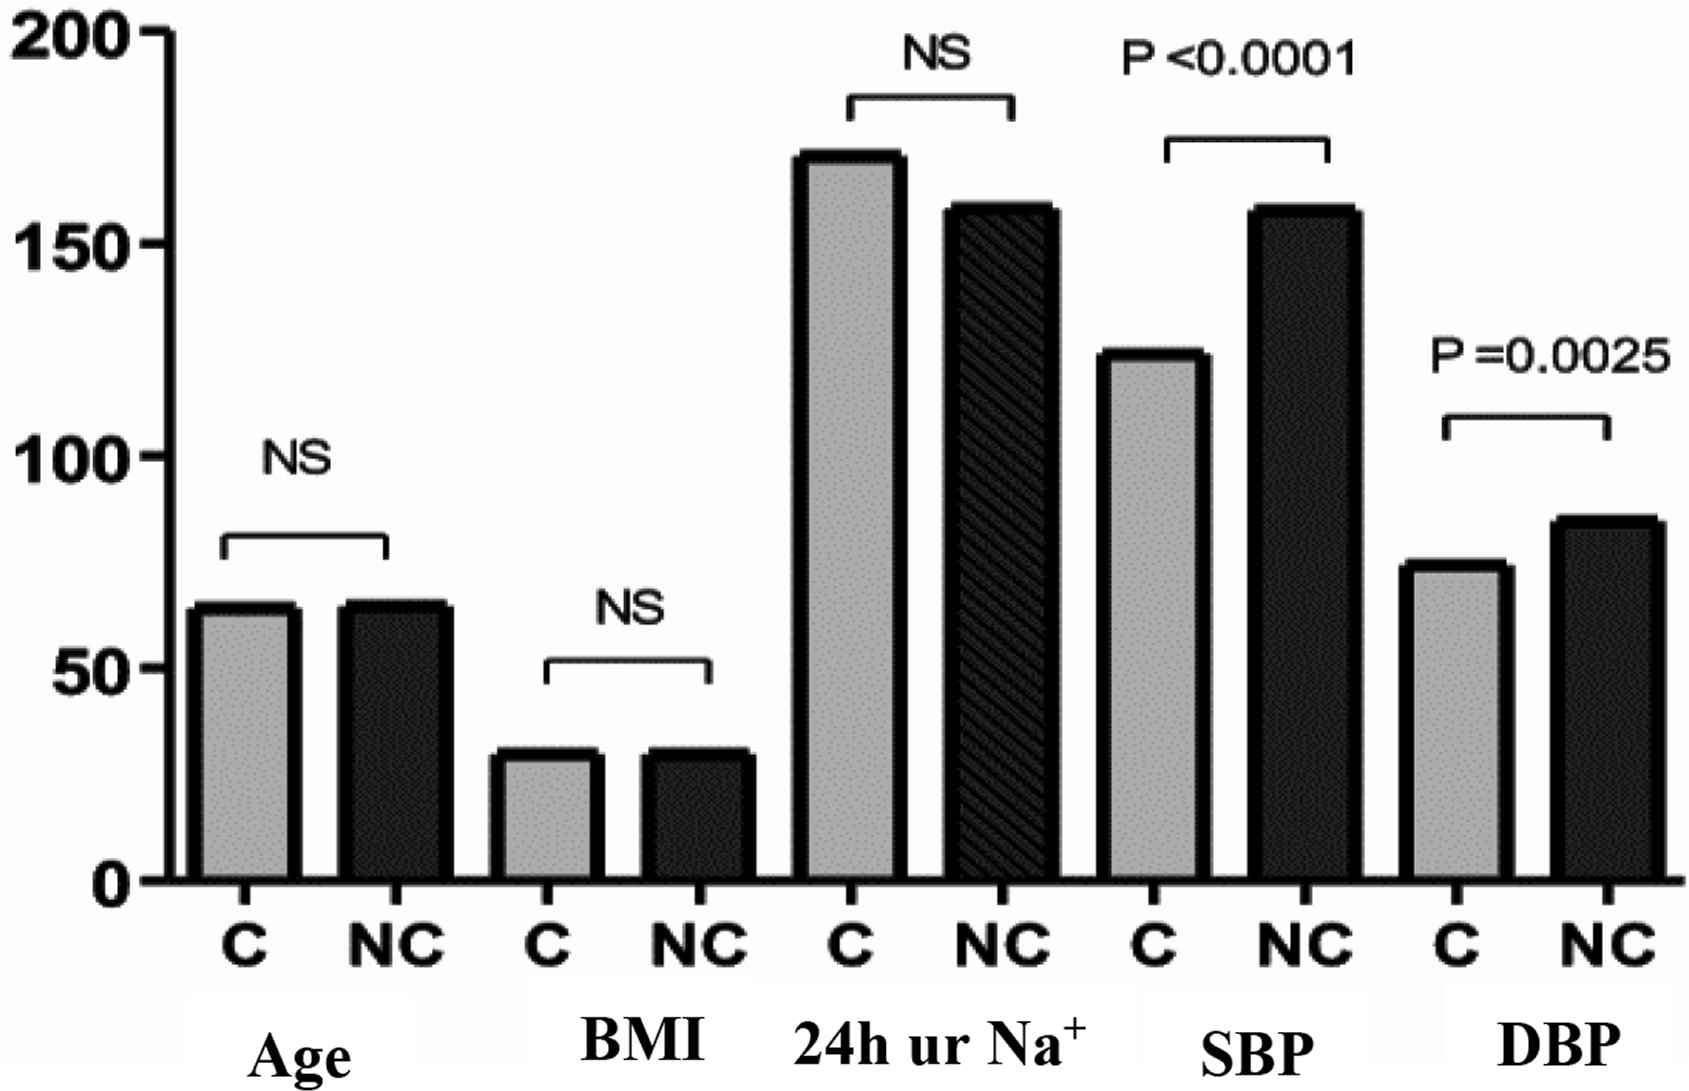
Comparison between Controlled Hypertensive (C) and Resistant/Non-controlled (NC) groups. NS, not significant.
Multivariate analysis of the controlled hypertensive group for PWV (measured by Mobil-O-Graph) and SBP, DBP, cSBP, cDBP, Age, BMI, and Na+ U 24 h showed an association of PWV with SBP (p = 0.0229) and age (p < 0.0001). Results are presented in Table 2.
| Independent variables | β coefficient | Standard deviation | p |
|---|---|---|---|
| SBP | −0.0008421 | 0.007827 | 0.9154 |
| DBP | −0.02198 | 0.01326 | 0.1128 |
| cSBP (Mobil-O-Graph) | 0.03246 | 0.01317 | 0.0229* |
| cDBP (Mobil-O-Graph) | 0.02248 | 0.01872 | 0.2437 |
| Age | 0.1096 | 0.03849 | <0.0001* |
| BMI | 0.2066 | 0.06963 | 0.4116 |
| Na+ U 24 h | −0.002360 | 0.004066 | 0.6576 |
p < 0.05.
Multivariate analysis of controlled hypertensive for PWV (measured by Mobil-O-Graph) and SBP, DBP, cSBP, cDBP, Age, BMI and Na+ U 24 h
Multivariate analysis of the controlled hypertensive group for augmentation index (measured by Mobil-O-Graph) and SBP, DBP, cSBP, cDBP, age, BMI and Na+ U 24 h showed association of augmentation index with SBP (p = 0.0466), DBP (p = 0.0175) and office DBP (p = 0.0230). Results are presented in Table 3.
| Independent variables | β coefficient | Standard deviation | p |
|---|---|---|---|
| SBP | −0.01603 | 0.1533 | 0.9178 |
| DBP | 0.06611 | 0.2685 | 0.0230* |
| cSBP (Mobil-O-Graph) | 0.4882 | 0.2302 | 0.0466* |
| cDBP (Mobil-O-Graph) | −0.9526 | 0.3677 | 0.0175* |
| Age | −0.07417 | 0.1705 | 0.6682 |
| BMI | −0.2784 | 0.3078 | 0.3765 |
| Na+ U 24 h | −0.007094 | 0.01843 | 0.9178 |
p < 0.05.
Multivariate analysis of controlled hypertensive for augmentation index (measured by Mobil-O-Graph) and SBP, DBP, cSBP, cDBP, age, BMI and Na+ U 24 h
Multivariate analysis of the resistant hypertensive group for PWV (measured by Mobil-O-Graph) and SBP, DBP, age, BMI and Na+ U 24 h showed an association of PWV with SBP (p = 0.0043) and age (p < 0.0001). Results are presented in Table 4.
| Independent variables | β coefficient | Standard deviation | p |
|---|---|---|---|
| cSBP (Mobil-O-Graph) | 0.03061 | 0.009436 | 0.0043* |
| cDBP (Mobil-O-Graph) | 0.00003800 | 0.01272 | 0.9976 |
| Age | 0.1527 | 0.006513 | <0.0001* |
| BMI | −0.02009 | 0.01263 | 0.1282 |
| Na+ U 24 h | 0.0001081 | 0.001250 | 0.9320 |
p < 0.05.
Multivariate analysis of resistant hypertensive for PWV (as measured by Mobil-O-Graph) and cSBP, cDBP, age, BMI and Na+ U 24 h
Multivariate analysis of the resistant hypertension group for augmentation index (measured by Mobil-O-Graph) and SBP, DBP, cSBP, cDBP, age, BMI and Na+ U 24 h showed association of augmentation index with cSBP (p = 0.0227). The results are presented in Table 5.
| Independent variables | β coefficient | Standard deviation | p |
|---|---|---|---|
| SBP | 0.1008 | 0.1326 | 0.4574 |
| DBP | −0.1484 | 0.1908 | 0.4472 |
| cSBP (Mobil-O-Graph) | 0.6080 | 0.2427 | 0.0227* |
| cDBP (Mobil-O-Graph) | −0.3408 | 0.3279 | 0.3132 |
| Age | 0.2221 | 0.1990 | 0.2800 |
| BMI | 0.005054 | 0.3275 | 0.9879 |
| Na+ U 24 h | −0.01868 | 0.03167 | 0.5631 |
p < 0.05.
Multivariate analysis of resistant hypertensive for augmentation index (measured with Mobil-O-Graph) and SBP, DBP, cSBP, cDBP, age, BMI and Na+ U 24 h
4. DISCUSSION
Central systolic pressure is an important predictor of cardiovascular risk; arterial properties that determine central systolic pressure values and peripheral blood pressure amplification are modulated by age, cardiovascular risk factors, drugs, and vasoactive substances. Elevated Na+ U 24 h excretion correlates with hemodynamic and structural changes in the vascular wall.
Analyzing the results of this study, it was possible to observe that, among the general characteristics, SBP and DBP (both office measurements) are higher in the resistant hypertensive group. Among the hemodynamic variables, 24 h SBP, 24 h DBP, PP, cSBP and cDBP were also statistically higher in the resistant hypertensive group. These findings reflect the direct relationship between being a patient resistant to antihypertensive treatment and having higher blood pressure and stiffness.
These findings are corroborated by the results of the study by Chung et al. [13], who worked with 1620 hypertensive patients. The means of anthropometric variables, age and BMI are similar to those of the present study. They concluded that the degree of arterial stiffness and SBP alone are higher in resistant hypertensive patients compared with controlled hypertensive patients.
Another study that also presented results that support those found in the present study was conducted by Mendes [14], who concluded that resistant hypertensive individuals have higher levels of peripheral and central blood pressure than controlled hypertensive individuals.
We can highlight at this time, the average medications for blood pressure control used in each group of this study. Controlled hypertensive used on average, 2.89 antihypertensives; while resistant hypertensive used 3.44 antihypertensives. We realized that more medication is needed in order to lower blood pressure in resistant hypertensive patients, which is often a frustrated attempt.
Although PWV did not present a statistically significant difference between the two groups, its mean was higher in resistant hypertensive individuals, indicating that arterial stiffness increases blood velocity and contributes to possible target organ damage. The study by Mendes presented the same results, that is, a higher mean PWV in resistant hypertensive than in controlled hypertensive, but not statistically significant [14].
Chung et al. [13], in turn, found significantly that PWV is higher in resistant hypertensive individuals, confirming the trend observed in the present study. Lotufo et al. [15], in the first Brazilian study that analyzed the prevalence of resistant hypertension in the country, also presented results similar to those of Chung et al. when analyzing PWV comparing controlled and resistant hypertensive patients.
Regarding Na+ U 24 h excretion, we found higher values in the controlled hypertensive group than in the resistant hypertensive group. We believe this was due to the need for resistant patients to better control their sodium intake as part of their non-drug treatment. Also, because of the importance of their condition, these patients are more often advised by healthcare professionals to reduce their intake of high-salt foods. Boutari et al. [16] demonstrated that 91% of resistant hypertensive patients received clear instructions on the harmful effects of salt intake to control blood pressure and 76% of these reduced consumption.
By performing multivariate analysis, a direct relationship of PWV with cSBP and age was observed in the controlled hypertensive group and with SBP and age in the resistant hypertensive group. With these data, we found that PWV tends to increase with increasing cSBP and SBP, as well as with the patient’s age. This finding was also reported by Chung et al. [13], regarding SBP, who concluded that PWV is directly related to blood pressure levels. Regarding the relationship of PWV with the patient’s age, Díaz et al. [17] confirmed their increasing behavior according to aging, about 6–8% every decade of life, highlighting a more significant increase after 50 years. Meyer et al. [18], in a study with 4974 patients, also found a direct association between PWV and age.
Also by multivariate analysis, there was a direct relationship between AI and DBP, cSBP and cDBP, in the controlled hypertensive group, and with cSBP, in the RESISTANT HYPERTENSIVE group. Thus, AI should be higher as DBP, cSBP and cDBP increase. Terentes-Printzios et al. [19] also demonstrated that AI is directly related to increased cardiovascular risk. The study by Totaro et al. [20] also showed a relationship between AI and cBP, reaffirming the findings of the present study.
It is noteworthy that there was no statistically significant difference between the groups regarding age, height, weight and BMI, which represents the homogeneity of the population sample studied.
It is worth noting that the main limitation of this study concerns the number of patients studied. We believe that more statistically significant comparisons could have been found if the sample were larger.
5. CONCLUSION
Peripheral blood pressure, central blood pressure, and pulse pressure are higher in resistant hypertensive patients than in controlled hypertensive patients.
The mean PWV was also higher in resistant hypertensive patients, although this result was not statistically significant. The Na+ U 24 h excretion did not correlate with hemodynamic changes in both groups studied.
Age is the main independent variable associated with increased central blood pressure and PWV in both controlled and resistant hypertensive patients. Augmentation index is directly related to central blood pressure. Further studies with larger sample size are needed to confirm the results.
CONFLICTS OF INTEREST
The author declare they have no conflicts of interest.
AUTHORS’ CONTRIBUTION
JMMZ and FSR contributed in the study design, data collection and performed the writing. EESC, TA and JRU contributed in the data collection. LNCM participated in the data analysis and review. JCYT performed the statistical analysis and review. JFVM contributed in the study design, coordination, and data analysis and helped to draft the manuscript.
FUNDING
This work was supported by the
ACADEMIC LINK
This study is linked to the postgraduate program of the School of Medicine of São José do Rio Preto, Sao Paulo, Brazil.
ACKNOWLEDGMENTS
The authors would like to specially thank each of the patients who freely accepted to participate in this study, giving their time for data collection and thus contributing to the enrichment of science.
Footnotes
REFERENCES
Cite this article
TY  - JOUR
AU  - João Marcos de Menezes Zanatta
AU  - Fábio dos Santos Ricardi
AU  - Elizabeth do Espírito Santo Cestário
AU  - Tatiana Azevedo
AU  - Jéssica Rodrigues Uyemura
AU  - Luciana Neves Cosenso-Martin
AU  - Juan Carlos Yugar-Toledo
AU  - José Fernando Vilela-Martin
PY  - 2019
DA  - 2019/12/17
TI  - Central Hemodynamic Parameters are Altered in Resistant Hypertensive Individuals
JO  - Artery Research
SP  - 101
EP  - 105
VL  - 25
IS  - 3-4
SN  - 1876-4401
UR  - https://doi.org/10.2991/artres.k.191203.002
DO  - 10.2991/artres.k.191203.002
ID  - Zanatta2019
ER  -