
Pressure Dependency of Retinal Arterial Pulse Wave Velocity in the Rat
- DOI
- 10.2991/artres.k.200201.001How to use a DOI?
- Keywords
- Retinal artery; small vessel; arterial stiffness; pressure dependence; pulse wave velocity
- Abstract
Purpose: The retinal vasculature provides unique in vivo access to the microcirculation and presents the possibility of measuring small artery (retinal) stiffness using pulse wave velocity (PWV). This study investigates whether retinal artery PWV (rPWV) has a blood pressure (BP) dependency.
Methods: Fundus videos from eight Sprague-Dawley rats aged 12 weeks were captured (Zeiss fundus microscope with high-speed camera, 125 fps, Optronis, Germany) simultaneously with aortic BP. Retinal artery diameter waveforms at proximal and distal sites were extracted and transit time calculated from the phase delay between frequency components (4–6 Hz, typical heart rate of rats) of the waveforms. rPWV was measured across a physiological range of mean arterial pressure (MAP): baseline (90–110 mmHg); 130 mmHg to baseline following systemic phenylephrine (PE) infusion (30 μg/kg/min); 130 mmHg to baseline during PE infusion with simultaneous inferior vena cava occlusion (VO); 70 mmHg to baseline following systemic sodium nitroprusside infusion; and 70 mmHg to baseline following VO. The correlation between retinal artery rPWV and BP was quantified.
Results: There was a significant positive correlation between retinal artery rPWV and MAP as expected (0.19 mm/s/mmHg, R2 = 0.59, p < 0.001). There was a positive correlation between retinal and aortic PWV (R2 = 0.09, p = 0.03).
Conclusion: The pressure dependency of the measured rPWV indicates the measure has utility in in vivo quantification of the impact on microvessels of cardiovascular diseases. To elucidate the predictive value of screening rPWV in systemic cardiovascular abnormalities, the relation needs to be investigated in humans.
- HIGHLIGHTS
- •
Retinal pulse wave velocity (rPWV) presents the opportunity for measuring small vessel arterial stiffness in vivo.
- •
rPWV measurement relies on complex image filtering to obtain diameter waveforms, bringing uncertainty as to whether the measure does reflect arterial stiffness.
- •
This study measures rPWV in the rat showing that it varies with blood pressure, a fundamental property of material stiffness of arteries.
- •
This indicates that the rPWV measure is associated with arterial stiffness.
- •
- Copyright
- © 2020 Association for Research into Arterial Structure and Physiology. Publishing services by Atlantis Press International B.V.
- Open Access
- This is an open access article distributed under the CC BY-NC 4.0 license (http://creativecommons.org/licenses/by-nc/4.0/).
1. INTRODUCTION
Arterial stiffness increases through life due to changes in smooth muscle and endothelial function, and alteration of the extracellular matrix through elastin degeneration, collagen cross-linking, and calcification. These processes occur with age and are accelerated in certain diseases including hypertension, diabetes mellitus, and end-stage renal failure [1]. Arterial stiffness as a predictor of cardiovascular disease particularly in the elderly [2] has been receiving increasing interest in preventive health care. The association between cardiovascular disease risk factors and measures of arterial stiffness has been demonstrated in large-population studies [3–5]. Arterial stiffness has been linked to vascular morbidity and mortality in cohorts with hypertension [6,7], end-stage renal disease [8], and type 2 diabetes mellitus [9].
There is increasing recognition that the interrelations between arterial stiffness and cardiovascular events are mediated by microvascular remodelling and obliteration [10,11]. Human and animal studies have evidenced arteriolar remodelling and capillary rarefaction in early stages of hypertension [12]. The possibility that the microcirculatory impairment may occur early in the onset of increasing arterial stiffness underlines the importance of monitoring microcirculation for more effective preventive and therapeutic measures [13].
The eye fundus has been traditionally used for identification of vascular changes. The advent of emerging ophthalmic imaging techniques in recent years has been translated into a more advanced investigation of disease phenotype through the eyes. The microcirculation can be directly and non-invasively monitored and imaged via the retina. Since the cornea and lens in the anterior segment of the eye are transparent and avascular, and the vitreous in the posterior segment also, retinal circulation can be easily and non-invasively visualized and imaged. The retina has a rich vascular network which shares the same embryological origin and common histological, anatomical, and physiological characteristics with the heart and brain [14]. Moreover, retinal vessels and cardio-vasculature are impacted by the same intrinsic and environmental factors. Therefore, retinal vascular changes are clinically highly relevant to cardio- and cerebrovascular pathologies.
These advantageous characteristics make the retina an ideal window to study not only ocular but also vascular related pathogenesis. Prior studies have provided strong evidence for retinal vascular changes in association with different types of disease including stroke [15], dementia [16], Alzheimer’s disease [17], hypertension [18], aortic stiffness [19], diabetes [13], glaucoma [20], and sleep apnea [21]. In particular, retinal arteriolar narrowing, widening of retinal veins, and arteriovenous nipping are hypertensive retinopathy signs which have been evidenced to correlate with cardiovascular events [22–24].
These studies use static vessel dimensions to characterise small vessel disease. They do not quantify the stiffness of the retinal arteries. High speed video imaging of the retina presents the opportunity of measuring retinal artery pulse wave velocity (rPWV), a correlate of material stiffness. Measurement of rPWV is not yet a standard. Due to the image processing and algorithmic complexities in assessing rPWV, it is difficult to ascertain if rPWV is a surrogate of retinal artery stiffness, given the intrinsic association of pulse wave velocity with arterial stiffness.
The current study investigates whether measured rPWV is (a) affected by vasoactive drugs and (b) changes with blood pressure (BP). Changes in rPWV in the correct direction with administration of vasoactive drugs and/or BP changes would indicate that the measure is reflective of retinal artery stiffness. This study mimics a methodology presented by Butlin et al. [25] quantifying the BP and vasoactive drug effect on large artery (aortic) stiffness in rats, but applied to the study of rPWV as a way of investigating the pressure, and vasoactive drug dependency of retinal artery stiffness, as measured by rPWV, in the rat.
2. MATERIALS AND METHODS
2.1. Animal Preparation
Experiments were performed on eight Sprague-Dawley rats (five female) aged 12 weeks with a total of 11 eyes (six right eyes and five left eyes) analysed between the eight rats. All experiments were conducted in accordance with the Australian Code for the Care and Use of Animals for Scientific Purposes and were approved by the Macquarie University Animal Ethics Committee.
Anaesthesia was induced with urethane (ethyl carbamate, 1.3 g/kg) administered intraperitoneally and maintained by intravenous urethane as required. Rats were placed in a supine position on a heat mat regulated via a rectal temperature probe. Two femoral veins were cannulated for intravenous infusion of anaesthetic and vasoactive drugs. For the purpose of aortic PWV (aPWV) measurement, two 1.2 F solid state pressure catheters (Transonic Scisense, London, Canada) were advanced via the left carotid and femoral arteries and into the descending aorta just distal to the aortic arch and just proximal to the iliac bifurcation. Pressure waveforms were used to ascertain proper location of transducers and catheter placement was confirmed post-mortem. A suture was placed loosely around the inferior vena cava accessed via a right flank incision and externalized for later application of tension to reduce venous return for drug-independent lowering of BP. The electrocardiogram (ECG) was monitored using lead II of a three-lead electrode configuration throughout the experiments. BP variations for each rat were compared with their own baseline.
Blood pressure and ECG signals were recorded throughout the experiment with the ECG sampled at 2 kHz and the BP waveforms sampled at 10 kHz (Power 1401 data acquisition system, Spike2 software version 7.09, Cambridge Electronic Design Ltd, Cambridge, England).
2.2. Retinal Imaging
The animal was placed prone on the microscope stage for eye imaging. The pupil was dilated by a single drop of 0.5% tropicamide (Alcon, Fort Worth, Texas, USA). Gen Teal moisturizing eye gel (0.3% Hypromellose ophthalmic gel) was also applied to moisten and clarify the surface of the cornea. 0.9% saline (sodium chloride) solution was used as required during the experiment to hydrate and lubricate the eye. Retinal images were recorded for offline analysis using a high-speed camera (Optronis, Kehl, Germany) mounted on a Zeiss ff450Plus fundus camera (Zeiss, Oberkochen, Germany) at a rate of 125 frames per second with a 30° field of view at a resolution of 1280 × 1024 pixels. The final spatial resolution of the whole optical imaging system was 6.06 μm.
2.3. Alteration of Blood Pressure
Following a 10 s recording of signals and retinal video at baseline resting anaesthetized conditions, retinal and aortic BP recordings were acquired across a physiological range of BP achieved through vasoactive substances and through a passive mechanism. About 40-s long retinal recordings were obtained across each of the following mean arterial pressure (MAP) ranges achieved in the following ways:
- •
130 mmHg to baseline BP following systemic phenylephrine (PE) infusion;
- •
130 mmHg to baseline BP during PE infusion with simultaneous inferior vena cava occlusion (referred to as PEVO in this article);
- •
70 mmHg to baseline BP following systemic sodium nitroprusside (SNP); and
- •
70 mmHg to baseline BP following venous occlusion (VO).
Phenylephrine and SNP were administered intravenously at a dose rate of 30 μg/kg/min. PE is an α1-adrenoceptor agonist which binds to α-receptors on vascular smooth muscle and increases BP by inducing vasoconstriction. SNP mediates vasodilation by releasing nitric oxide. It has been shown that these drugs have minimal effect on aortic stiffness in humans [26] and in rats [25]. It is assumed that the effect is imparted mostly on the peripheral vasculature and this is likely to include the retinal vasculature. Therefore, this experiment used a passive means of changing BP (VO) to compare to the drug-induced method to quantify the direct drug effect on retinal artery stiffness as opposed to the BP effect.
2.4. Calculation of Retinal Artery Diameter and Pulse Wave Velocity
Retinal artery diameter waveforms at proximal and distal sites were obtained using an in-house algorithm written in MATLAB® (The MathWorks Inc., Natick, MA, USA). The algorithm is composed of three modules: vessel segmentation, diameter measurement and calculation of pulse transit time. The vessel segmentation method starts with an adaptive contrast adjustment procedure to enhance the intensity of the vessels against the background. Next, the entire sequence of images is registered to align the frames and compensate for motion artefacts produced by the eye and the respiratory displacements. To achieve more accurate diameter measurements at a faster speed and less computational cost, an artery is selected interactively by the user by drawing a line crossing the boundaries of the vessel of interest at both sides. Given the length of the vessel segment to be analysed, the algorithm automatically crops the vessel segment from all frames. The rest of the algorithm operates on this region of interest cropped from the image sequence rather than whole frames. For a precise segmentation of the vessel boundaries, image artefacts are first removed by an anisotropic diffusion filter. Using an edge detection algorithm, the boundaries of the vessel segment are defined. The diameter of the vessel is measured as the Euclidean distance between the intersection pairs of the input line with the vessel boundaries at each side. To obtain more robust and accurate measurements, the algorithm measures the diameter along four parallel lines shifted by one or two pixels on each side of the input line. After computing the intersections, missing values and outliers are replaced by spline interpolation. To obtain rPWV, proximal and distal points were set along a straight segment of an artery approximately 420 μm apart. This distance was selected to avoid vessel bifurcations and intensity variations along the vessel segment due to concave shape of the retina.
In eight out of 11 eyes, vessel diameter changes were taken in the superior nasal quadrant of the fundus and within one to three optic disc diameter from the optic disc rim. In the remaining three eyes, image quality was not suitable in that same quadrant and measurements were made in the superior temporal segment. rPWV was then calculated as the ratio of the distance between two places of diameter measurement to the time taken for a pulse to travel that distance. The pulse transit time was calculated as the slope of the regression line of phase delays on angular frequencies obtained from the Fourier components of proximal and distal diameter waveforms. Fourier analysis was performed on the whole duration of diameter waveforms (i.e. 10 s for the baseline and 40 s for each episode of BP manipulation) to obtain a higher frequency resolution and consequently more precise time delay measurements. The regression was calculated only for the frequency components between 4 and 6 Hz covering the cardiac frequency of rats.
2.5. Calculation of Aortic Parameters
Mean arterial pressure, systolic blood pressure (SBP), diastolic blood pressure (DBP), heart rate (HR), and aPWV were extracted from ECG, thoracic, and abdominal pressure waveform using a custom script written in Spike2 software (Version 7.09, Cambridge Electronic Design Ltd). Aortic pulse transit time was calculated as the foot-to-foot time interval between the thoracic and abdominal pressure waves. The foot of the signals was located using the peak of the second derivative of the pressure waveforms. The distance between the sensors was measured at autopsy using a wetted suture placed directly along the aorta between the two pressure sensors, and the length of the suture segment measured using a ruler.
2.6. Statistical Analysis
Difference in rPWV between active (vasoactive drug) and passive (venous occlusion) methods of altering BP were analysed by analysis of variance with post-hoc Tukey’s Honest Significant Difference tests. Linear mixed model analysis was conducted to find predictors of rPWV.
3. RESULTS
Figure 1A shows a representative retinal arterial diameter waveform. Although a clear cardiac related waveform is not visually apparent, the diameter signal exhibits power at the cardiac frequency (Figure 1B).
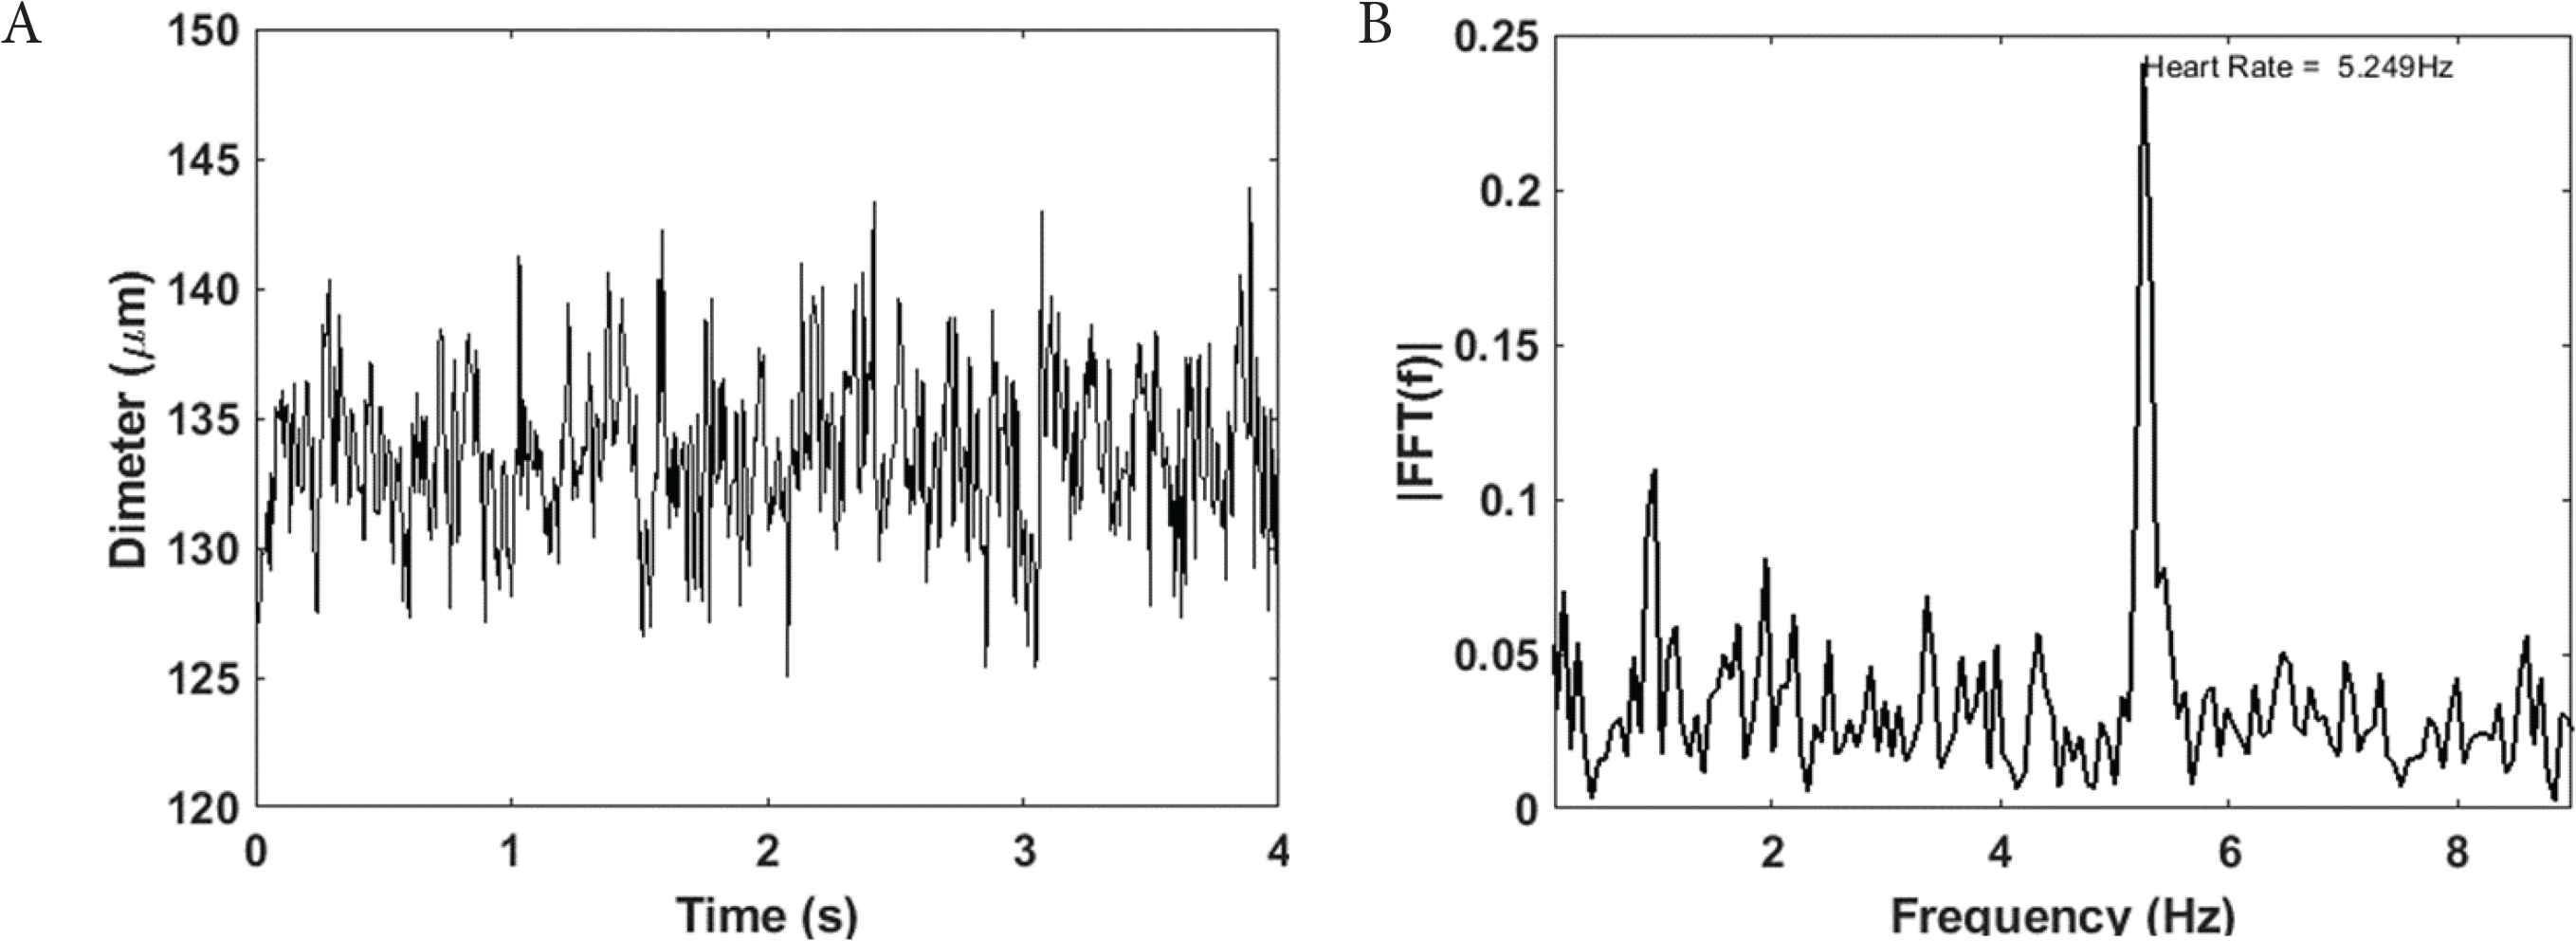
Retinal arterial diameter waveform (A) have power at cardiac frequency (B)
The average pressure range analysed following PE infusion did not differ from the pressure range during PE infusion with venous occlusion (PEVO, Figure 2A). Similarly, the pressure range analysed following SNP infusion did not differ from VO (Figure 2A). Therefore, rPWV results could be compared between the active and passive BP altering mechanisms. The manipulations to raise BP gave the expected significantly higher pressure to the manipulations to lower BP (Figure 2A). Along with the measurements at anaesthetised resting BP, the data gave results across a range of physiological BP.
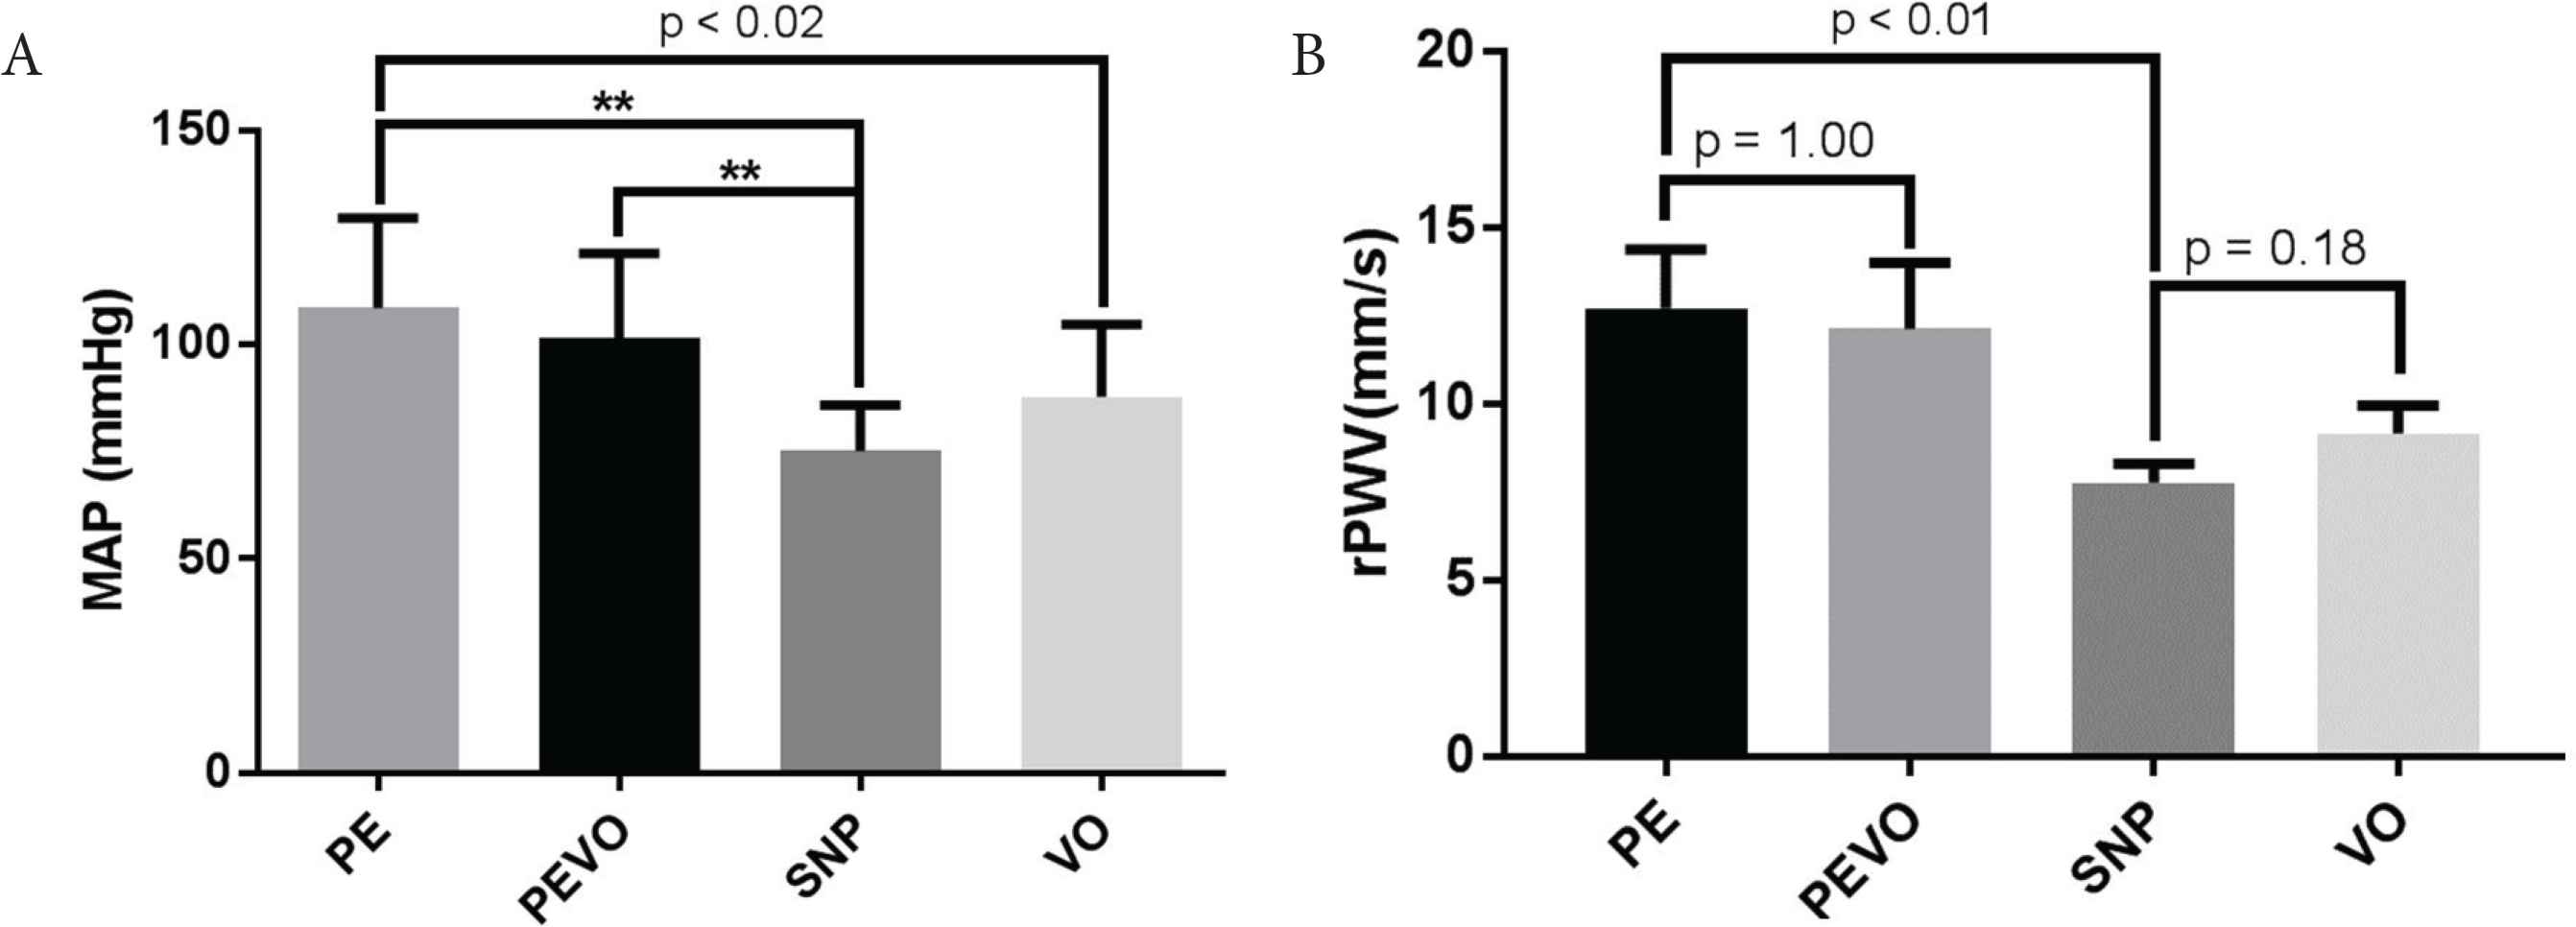
Average (A) mean arterial pressure (MAP) and (B) retinal artery pulse wave velocity (rPWV) following infusion of phenylephrine (PE), sodium nitroprusside (SNP) and the use of venous occlusion (VO) as means of manipulating blood pressure; **p < 0.01
Vasoactive drugs did not affect rPWV (Figure 2B), with results following PE infusion (12.7 ± 1.7 mm/s) not differing from those during PE infusion and venous occlusion (12.2 ± 1.6 mm/s, p = 1.00) following correction for multiple comparison). Results following SNP infusion (7.7 ± 0.5 mm/s) did not differ from those following venous occlusion (9.2 ± 0.8 mm/s, p = 0.35). rPWV curves as a function of DBP, SBP, and MAP for each of the episodes are depicted in Figure 3.
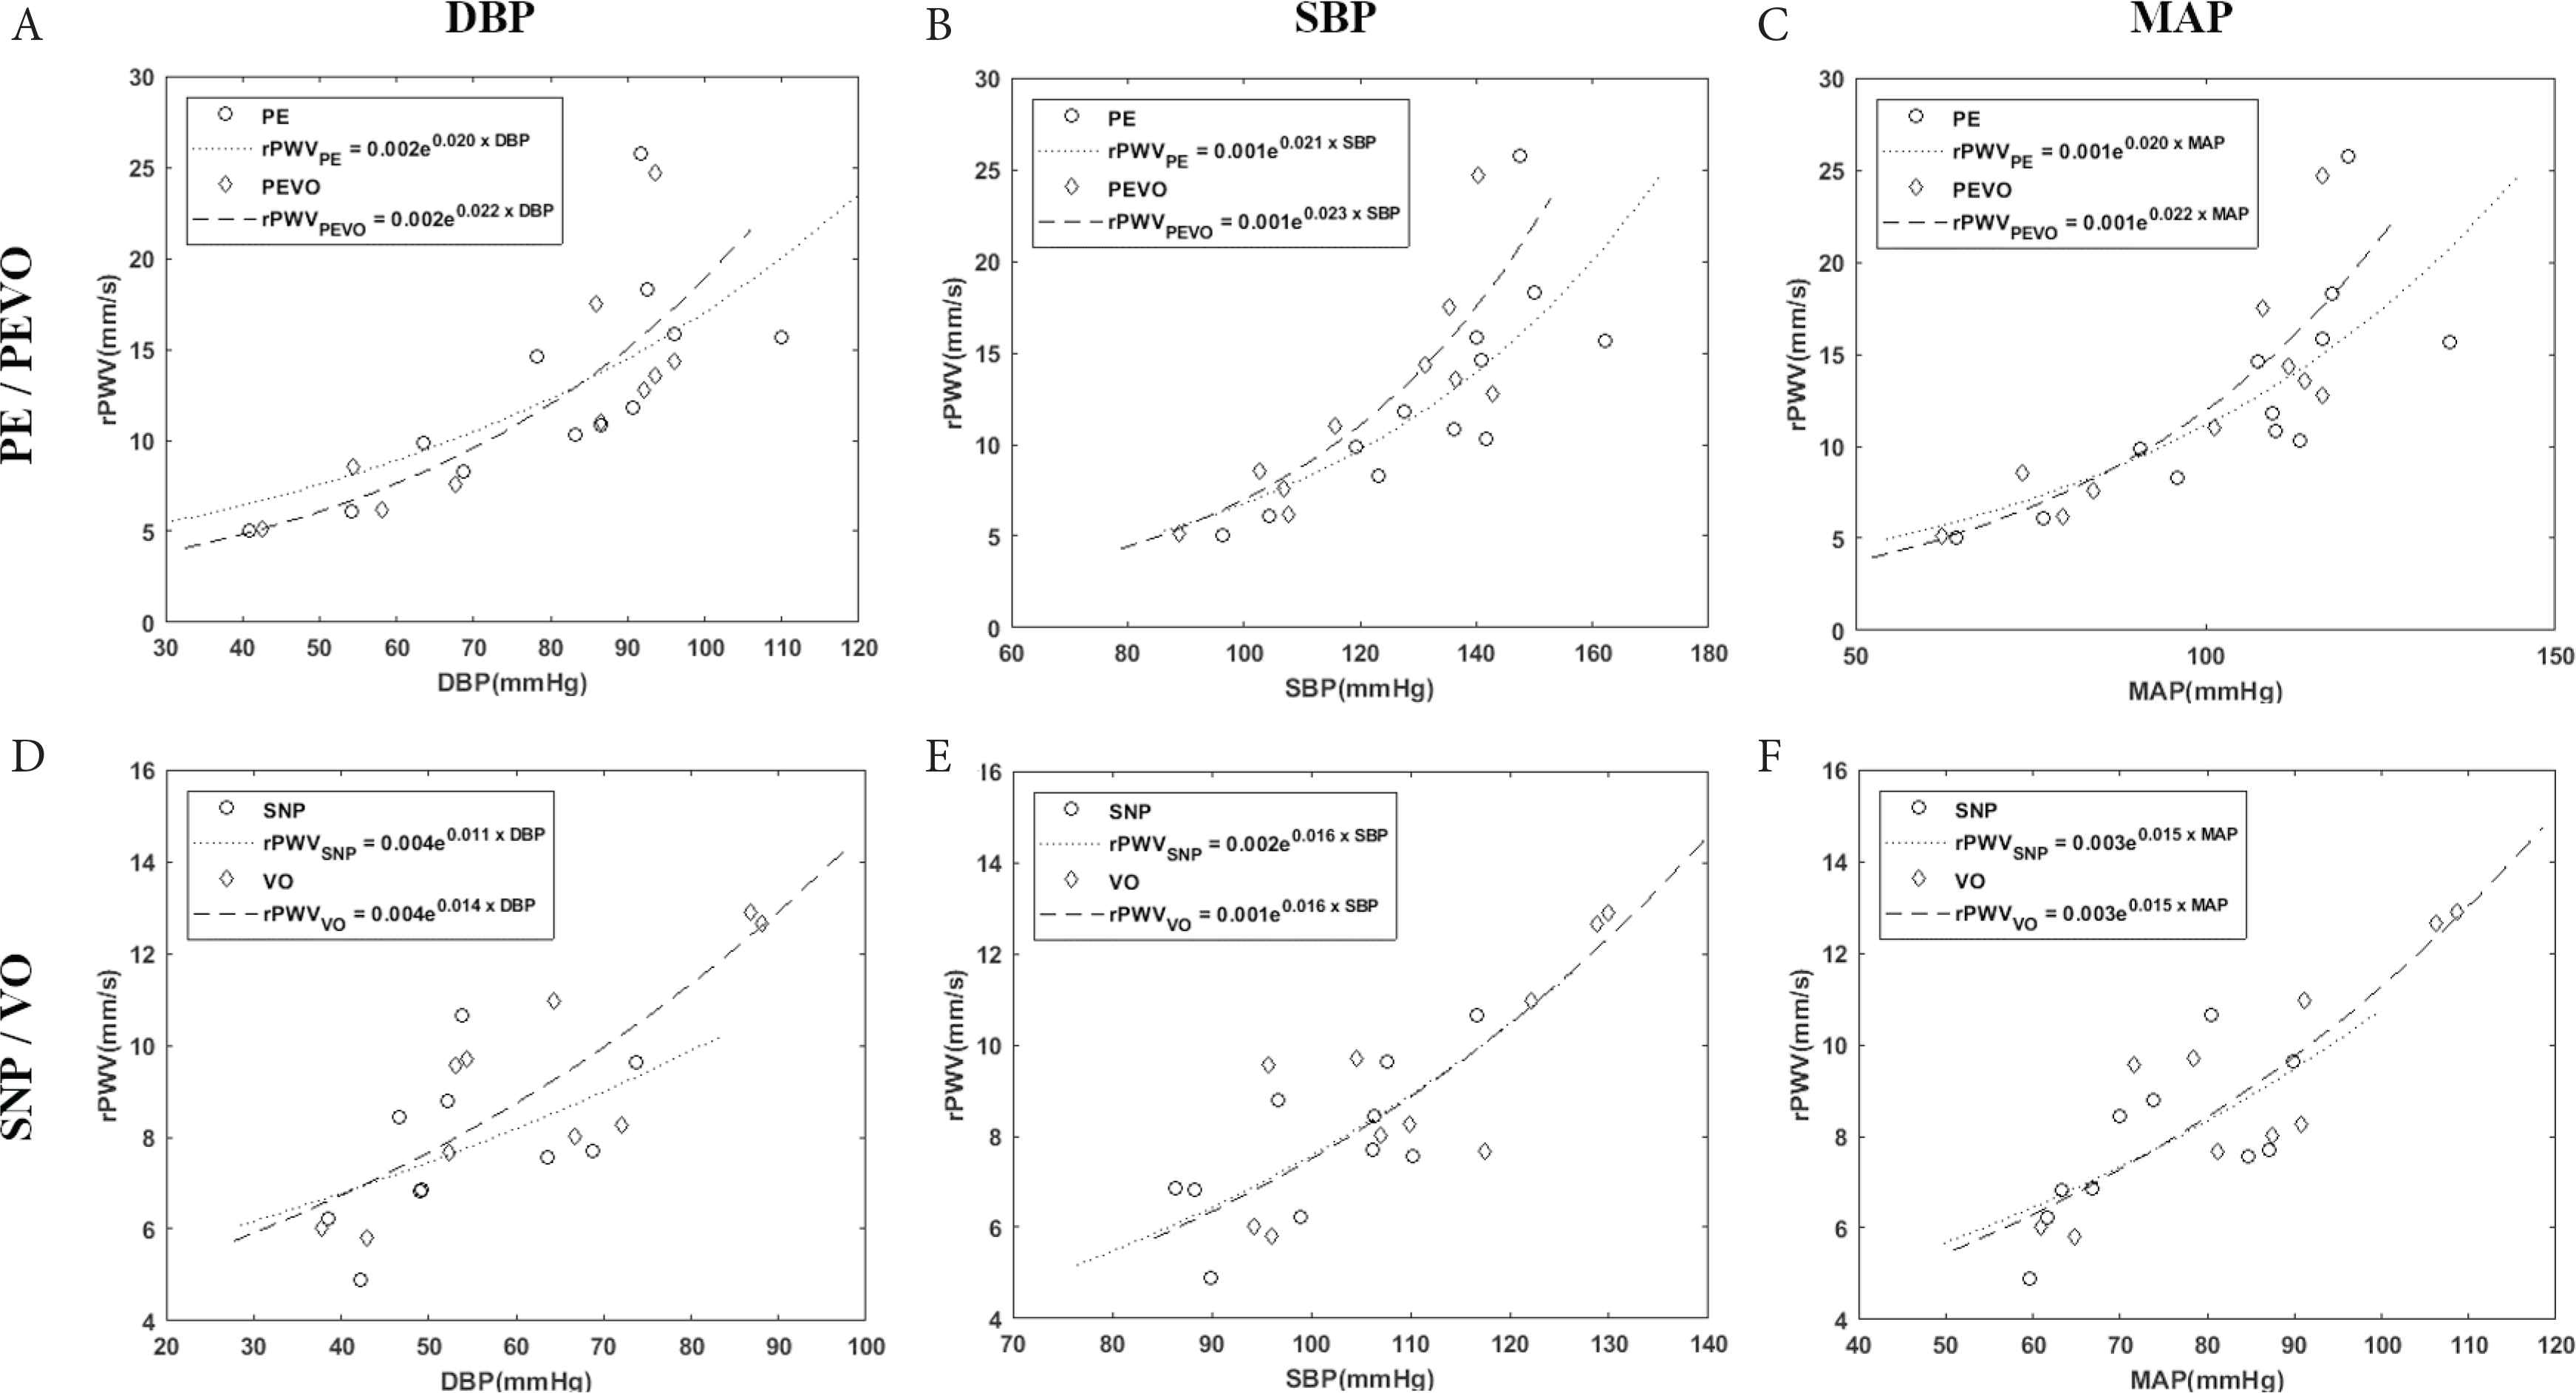
Retinal artery pulse wave velocity (rPWV) regression against diastolic (DBP), systolic (SBP), and mean arterial blood pressure (MAP) comparing blood pressure achieved by either (A–C) phenylephrine infusion (PE) or phenylephrine infusion during venous occlusion (PEVO), or (D–F) sodium nitroprusside infusion (SNP) or venous occlusion (VO)
There was a positive correlation between rPWV and MAP (R2 = 0.69, p < 0.001, Figure 4A) and between rPWV and aPWV (R2 = 0.09, p = 0.03; Figure 4B). Incorporation of random effects specified for between animal and within episodes for each eye in a linear mixed model resulted in a significant main effect of aPWV was found in rPWV as rPWV = 4.74 × 10⁻³ × aPWV − 0.61 × sex − 1.09 × eye side − 18.44 (R = 0.65, p < 0.0001). This means that rPWV increases with aPWV with a slope of 4.74 × 10⁻³ and when aPWV and sex are held constant, rPWV would be −1.09 mm/s slower in the left eye compared with the right eye.
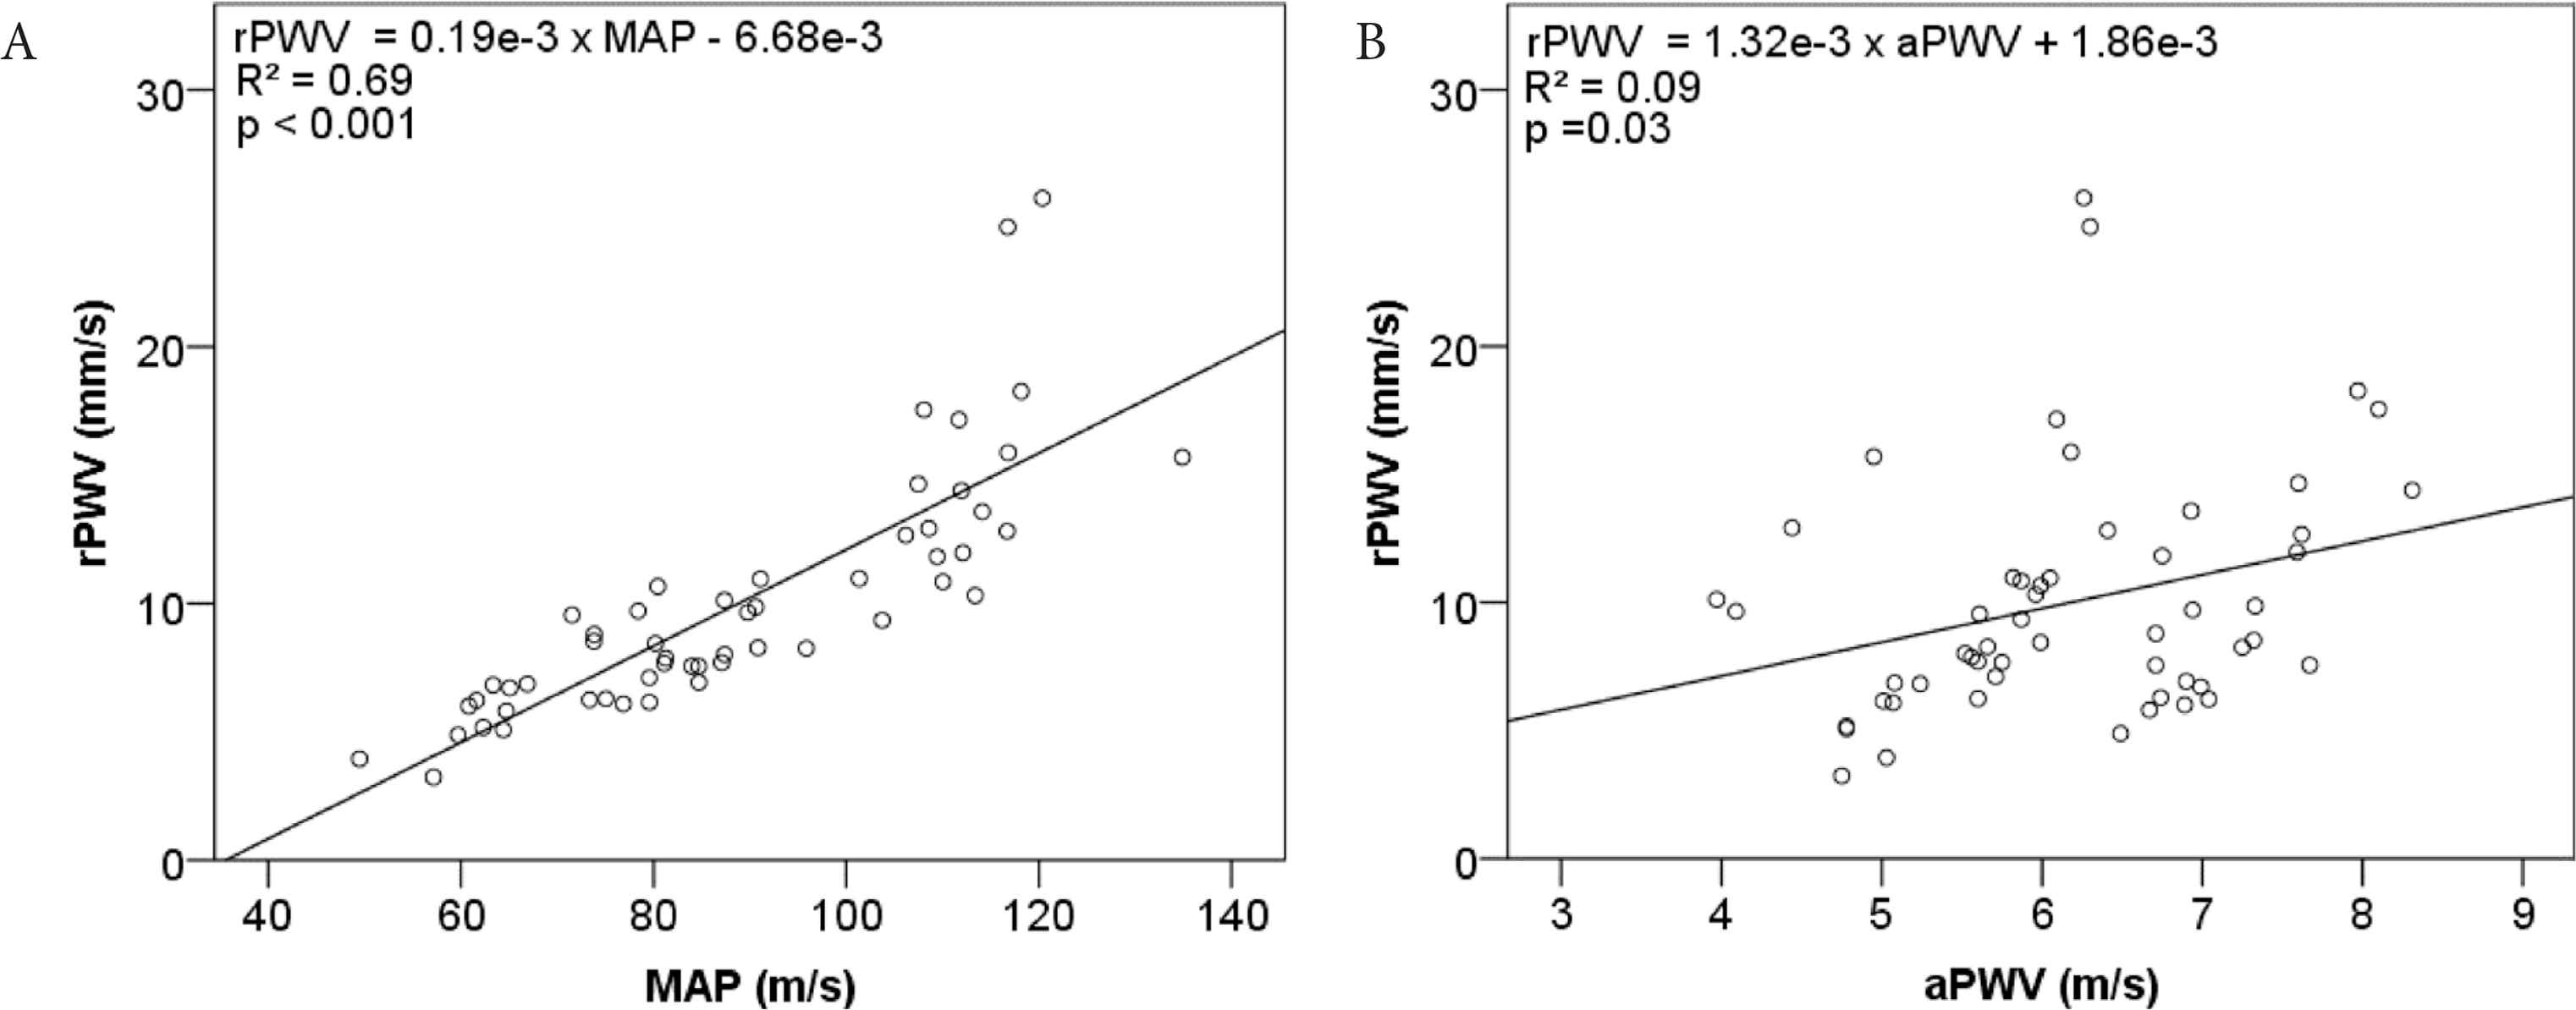
Linear regression of retinal artery pulse wave velocity (rPWV) against (A) mean arterial pressure (MAP), and (B) aortic pulse wave velocity (aPWV)
4. DISCUSSION
Utilizing high-speed retinal imaging the transit time of the pulse along the retinal arteries of rodents was able to be quantified from data related to retinal artery diameters. The study is the first to show that the calculated rPWV from these transit times, as a measure of retinal artery stiffness, was not changed directly by vasoactive drugs but was correlated with systemic arterial pressure and aPWV.
Pulse wave velocity in macro-vessels as a measure of arterial stiffness is highly correlated with BP, this being a fundamental property of arterial biomechanics. Large artery stiffness also increases with age and during cardiovascular disease progression [27]. As large artery stiffness can be measured in humans (and animals) non-invasively makes it a useful summative marker of the effect of age and disease on the vasculature. There is much less research in arterial stiffness alterations in microvessels largely due to the limitations in non-invasive assessment of microvessels. The eye provides a window to microvessels and the measurement of rPWV could provide a quantitative assessment of microvessel stiffness. However, the diameter waveforms acquired (Figure 1A) require significant processing to arrive at a value of pulse transit time and rPWV reducing the confidence that the rPWV being measured is accurate and reflective of microvessel stiffness. Perhaps due to the degree of processing required, rPWV values reported in the literature have varied in order of magnitude considerably. The first attempt to measure rPWV in the rat retina using a similar imaging modality [28] reported an average rPWV of 114 mm/s in Wistar-Kyoto rats and 98 mm/s in Sprague-Dawley rats which differ by one order of magnitude from the values reported in this study. In 2016, an investigation of the mouse retina by Song et al. [29] using swept-source OCT concluded that rPWV of more than 1 m/s is expected. The discrepancy between reported values of rPWV resulted in debate between researchers in the field [30,31]. This study does not tackle the issue of order of magnitude of the rPWV measure but attempts to validate the rPWV measure by demonstrating that it changes with BP – a fundamental property of arterial stiffness. BP was changed through use of vasoactive substances, and to ensure that the vasoactive substances themselves did not affect stiffness, these results were compared with methods using a BP-altering method independent of vasoactive drugs.
The current study found a strong association between rPWV and BP indicating increased stiffness in the retinal artery with increasing BP. In the human carotid artery, there is an average change of 1 m/s for a change of pressure of 10 mmHg [32]. This current investigation on the rat showed an average increase of 1.9 mm/s in rPWV for a 10 mmHg increase in MAP compared with a rate of 0.1 m/s per 10 mmHg in the rat aorta. The rPWV therefore shows the expected directional change with change in MAP, and expected greater sensitivity at higher BP. The further implication is that the same level of increase in BP results in a more pronounced increase in rPWV than aPWV.
The rPWV/BP relationship fitted an exponential model (R2 = 0.64, p < 0.0001) instead of a second-order polynomial (R2 = 0.71, p < 0.0001) as obtained in the aorta [25]. This might be attributed to the structural difference between the aorta and retinal vessels. With varying arterial wall properties, PWV dependency on BP might be expected to be different between proximal, more elastic and peripheral, more muscular arteries. Retinal arteries are also unique (along with cerebral vessels) in that they exist in a positive pressure environment. Intraocular pressure (IOP) alters the transmural pressure, the pressure determinant of arterial stiffness. Although it is assumed that IOP under anaesthetised conditions was relatively constant though it was not measured. However, physiological IOP changes are in the range of up to 10 mmHg and unlikely to have significantly affected the result over the systemic BP changes measured.
The pressure sensitivity of rPWV was greater at higher levels of BP similar to that observed in large arteries [25]. This was evidenced both as greater sensitivity of rPWV to SBP compared with DBP and when comparing pressure sensitivity of rPWV during PE/PEVO episodes with that during SNP/VO. Prior to this study the pressure dependency of rPWV was only evidenced cross-sectionally by comparison of normotensive and hypertensive young subjects [33], which may be a change in rPWV evoked by differences in systemic BP and/or differences in underlying retinal artery characteristics under chronic hypertensive conditions. The current study demonstrated the acute effects of BP on rPWV prior to irreversible structural damages in micro- and macro-vessels. Given the homology between retinal microvasculature and peripheral small resistant arteries, this novel observation is of interest in in vivo non-invasive evaluation of microvascular changes associated with hypertension and arterial stiffness.
This study, for the first time reports a positive correlation between rPWV and aPWV in rodents. This provides further confirmation of the validity of rPWV. However, the common factor in both measures is the dependency on BP and therefore it would be expected that if rPWV is correlated with BP, it would also be correlated with aPWV.
One limitation of this study is that we were only able to measure average rPWV throughout each episode of BP manipulation, providing an average rPWV over a BP range and not a single value of rPWV for a single BP point. Dividing the 40-s recording into shorter epochs resulted in regression of phase shifts on frequency that were non-significant due to insufficient number of fast Fourier transform samples. Therefore, the method as currently proposed is most useful under conditions of stable BP.
Retinal vasculature provides an opportunity for non-invasive measurement of arterial stiffness in small vessels. Recent published studies have reported attempts to non-invasively quantify rPWV [28,31,33–35]. However, the reported values in those studies yield variable results bringing into doubt the accuracy of the measurements. By measuring material stiffness and geometry of retinal arteries, the order of magnitude of rPWV can be determined using the Moens–Korteweg equation. To estimate the theoretical value of rPWV, the effect of blood viscosity needs to be accounted for. Considering viscosity of blood, the wave propagation speed of oscillatory flow is characterised by a non-dimensional α parameter which is related to the vessel radius (r), frequency of oscillation (ω), fluid density (ρ), and fluid viscosity (μ) as follows:
By taking into account the effect of α parameter for the oscillatory flow of a fluid with finite viscosity, lower PWV values by 1–2 orders of magnitude difference with PWV in large arteries are expected in vessels of size of retinal arteries (50–100 μm) [36].
5. CONCLUSION
This study provides validation of rPWV measurement in rodents by demonstrating that the measure of rPWV shows the expected dependency on BP and correlates with large artery stiffness. The associations between rPWV and both BP and aPWV though expected based on physiological evidence, had not been corroborated before. Further research is required to establish the relationship in human vasculature and potential clinical applicability of these findings via large cohort and longitudinal studies.
CONFLICTS OF INTEREST
The authors declare they have no conflicts of interest.
AUTHORS’ CONTRIBUTION
MB, AA and SG were responsible for the study conceptualization and writing (review and editing) the manuscript. MR, DG and MB did the data collection and curation. MR performed formal analysis and wrote (original draft) the manuscript. SMG and SG contributed in funding acquisition. MB, SG, and SMG supervised the project.
FUNDING
M.R. is supported by an Australian Government Research Training Program Scholarship. SM.G is supported by a National Health and Medical Research Council-Australian Research Council Dementia Fellowship. This research was supported by
Footnotes
REFERENCES
Cite this article
TY  - JOUR
AU  - Mahdieh Rezaeian
AU  - Dana Georgevsky
AU  - S. Mojtaba Golzan
AU  - Stuart Graham
AU  - Alberto Avolio
AU  - Mark Butlin
PY  - 2020
DA  - 2020/02/11
TI  - Pressure Dependency of Retinal Arterial Pulse Wave Velocity in the Rat
JO  - Artery Research
SP  - 27
EP  - 33
VL  - 26
IS  - 1
SN  - 1876-4401
UR  - https://doi.org/10.2991/artres.k.200201.001
DO  - 10.2991/artres.k.200201.001
ID  - Rezaeian2020
ER  -