
Study Protocol – Insight 46 Cardiovascular: A Sub-study of the MRC National Survey of Health and Development
- DOI
- 10.2991/artres.k.200417.001How to use a DOI?
- Keywords
- Dementia; cognitive decline; vascular cognitive impairment; functional near infrared spectroscopy (fNIRS)
- Abstract
The commonest causes of dementia are Alzheimer’s disease and vascular cognitive impairment. Although these conditions have been viewed as distinct entities, there is increasing evidence that neurodegenerative and vascular pathologies interact or overlap to cause cognitive decline, and that at least in some cases individuals at risk of cognitive decline exhibit abnormal cardiovascular physiology long before emergence of disease. However, the mechanisms linking haemodynamic disturbances with cognitive impairment and the various pathologies that cause dementia are poorly understood. A sub-sample of 502 participants from the Medical Research Council National Survey of Health and Development (NSHD) have participated in the first visit of a neuroscience sub-study referred to as Insight 46, where clinical, cognitive, imaging, and lifestyle data have been collected for the purpose of elucidating the pathological changes preceding dementia. This paper outlines the cardiovascular phenotyping performed in the follow-up visit of Insight 46, with the study participants now aged 74. In addition to standard cardiovascular assessments such as blood pressure measurements, echocardiography, and electrocardiography (ECG), functional Near Infrared Spectroscopy (fNIRS) has been included to provide an assessment of cerebrovascular function. A detailed description of the fNIRS protocol along with preliminary results from pilot data is presented. The combination of lifestyle data, brain structure/function, cognitive performance, and cardiovascular health obtained not only from Insight 46, but also from the whole NSHD provides an exciting opportunity to advance our understanding of the cardiovascular mechanisms underlying dementia and cognitive decline, and identify novel targets for intervention.
- Copyright
- © 2020 Association for Research into Arterial Structure and Physiology. Publishing services by Atlantis Press International B.V.
- Open Access
- This is an open access article distributed under the CC BY-NC 4.0 license (http://creativecommons.org/licenses/by-nc/4.0/).
1. INTRODUCTION
The number of adults over 80 years of age is expected to increase threefold from 2015 to 2050 [1]. Dementia is one of the most important health challenges facing older adults, as an estimated 20–30% of people aged 85 and above are living with this condition [2,3], and two to four times as many experience mild cognitive impairment, a strong predictor of dementia [4,5]. There is currently no cure or proven preventative treatment for cognitive decline or dementia.
The commonest causes of dementia are Alzheimer’s Disease (AD) and Vascular Cognitive Impairment (VCI). In the past these conditions have been viewed as distinct entities, with AD having a neurodegenerative basis (i.e. accumulation of β -amyloid and neurofibrillary tau tangles leading to neuronal cell loss), and VCI having a vascular basis (i.e. cerebral microbleeds, leukoaraiosis, and cortical infarcts) [6]. However, there is an increasing evidence that neurodegenerative and vascular pathologies interact or overlap to cause cognitive decline. For example, cerebral hypo-perfusion is present in both vascular and non-vascular dementia [7], cortical microbleeds related to amyloid angiopathy [8], and environmental risk factors for vascular disease may be associated with AD, and may also act synergistically with AD pathology to contribute to cognitive decline [9,10]. Several studies [11–14] have also shown that cardiac dysfunction and adverse hemodynamic patterns are associated with cognitive impairment, seemingly independent of other indices of macro- and micro-vascular disease.
Neurovascular coupling lies at the interface between the cardiovascular system and neurocognitive function, directly linking neuronal activity to local perfusion. It has been shown that dysregulation of neurovascular coupling results in abnormal cerebral blood flow to the neurovascular unit, thereby resulting in compromised oxygen/nutrient delivery, inefficient removal of toxic metabolites, and defects in the blood–brain barrier [15]. It is hypothesized that this may accelerate net deposition of β-amyloid and neurodegeneration, potentially accounting for synergy and a bi-directional relationship between vascular and neurodegenerative pathologies [16,17]. Although there is growing evidence suggesting that at least some individuals at risk of cognitive decline exhibit abnormal cardiovascular physiology long before emergence of disease [18–21], mechanisms linking haemodynamic disturbances with cognitive impairment and dementia are still poorly understood.
There are many well-established methods for assessing cardiovascular health, such as measurements of blood pressure, arterial stiffness, atherosclerotic burden, exercise capacity, and cardiac function and structure. Several methods for measuring cerebrovascular function exist, and include Transcranial Doppler (TCD), Positron Emission Tomography (PET), and functional Magnetic Resonance Imaging (fMRI). However, TCD can only be used to assess blood flow in the basal arteries in the brain, and TCD, PET, and fMRI are not performed in a naturalistic environment, thereby limiting the types of psychometric tests that can be performed whilst scanning. Functional Near Infrared Spectroscopy (fNIRS) is an emerging technology that provides low-cost, non-invasive assessment of cerebral haemodynamics, which can be performed during cognitive and functional tests in a naturalistic environment. fNIRS is described extensively elsewhere [22], but briefly, this technique measures changes in the concentration of Oxygenated Haemoglobin (OHB) and Deoxygenated Haemoglobin (HHB) in the superficial layer of the cerebral cortex in response to cognitive stimuli. In healthy neurovascular coupling, an increase in localised blood flow in response to a stimulus exceeds the metabolic demand, leading to an increase in the concentration of OHB and a decrease in concentration of HHB. The resulting Haemodynamic Response Function (HRF) [23] is modulated according to the length of the stimulus, as shown in Figure 1. Details about the HRF are included in Supplementary data (S1). These changes in OHB and HHB concentration (or lack thereof) can be used to assess the pattern and strength of cerebral activation and to detect abnormalities in the neurovascular unit, perhaps arising from cognitive impairment.

Demonstrates the haemodynamic response function (HRF) under different stimulus lengths. Column 1 – boxcar function, indicating onset and duration of stimulus (y = 1). Column 2 – canonical HRF for oxygenated haemoglobin, OHB (red) and deoxygenated haemoglobin, HHB (blue). Column 3 – result of convolving boxcar stimulus function with canonical HRF in a healthy neurovascular unit. Dotted lines correspond to the onset and end of the corresponding stimulus. The * symbol denotes the convolution operator.
Overall, there is a scarcity of research describing the mechanisms linking the cardiovascular system with cognitive impairment, partially due to challenges associated with measuring cerebrovascular function on a wide-scale. Although several small studies have shown a relationship between abnormal cerebrovascular function and individual biomarkers of Cardiovascular Disease (CVD) [24–27] a comprehensive evaluation of (1) cerebrovascular haemodynamics, in tandem with (2) comprehensive measures of cardiovascular health and (3) biomarkers of AD and cognitive function has not yet been performed in a population at risk of dementia.
Insight 46 [28] is a longitudinal two-time point sub-study of the Medical Research Council (MRC) National Survey of Health and Development (NSHD) [29] specifically designed to explore preclinical dementia and the causes and consequences of cerebrovascular and amyloid pathology on brain health. NSHD is a British birth cohort study that has followed 5362 individuals born during 1 week in March 1946 in England, Scotland and Wales [29]. This is a rich dataset including social factors, psychological measures, and physical and health measures (including cardiovascular function and cognition) collected over the course of the participants’ lives. By pooling this life course data measured from NSHD with the imaging, neuropsychological, clinical, cardiovascular, and cerebrovascular assessments performed as part of Insight 46, we have a powerful opportunity to study the mechanisms underpinning the association between cardiovascular disease and cognitive impairment. This paper will provide an in-depth description of the cardiovascular phenotyping performed in Insight 46, with an emphasis on how fNIRS will be used to investigate cerebrovascular function.
2. METHODS/DESIGN
The Insight 46 sub-study of NSHD is a random subsample of 502 study participants aged 69–74 who had attended a clinic-based assessment at age 60–64 (doi: 10.5522/NSHD/Q102), had previously intimated that they were willing to attend a clinic visit in London, and for whom complete data in childhood and adulthood were available (doi: 10.5522/NSHD/Q101) [30]. Participants attended for the first round of investigation over the period 2015–2018, when they were aged 69–71 years (doi: 10.5522/NSHD/Q103). Investigations included a cognitive testing battery and PET-MRI imaging as described previously [28]. Repeat cognitive testing and PET-MRI imaging for Insight 46 commenced in 2018. This second visit was augmented by detailed cardiovascular phenotyping which included: brachial and central blood pressure measurements including and reservoir excess pressure analysis, Pulse Wave Analysis (PWA), measurements of Pulse Wave Velocity (PWV), assessment of Carotid Intimal Medial Thickness (cIMT) and carotid plaques, echocardiography, a submaximal exercise stepper test [31], a 12-lead electrocardiography (ECG) including Heart Rate Variability (HRV), and fNIRS measurements of cerebrovascular function. Each of these are described in depth in the following sections. Details of other Insight 46 investigations - including anthropometric measures, cognitive tests, PET-MRI, audiometry and the collection of wet biomarkers – can be found in the Insight 46 study protocol paper [28].
2.1. Anticipated Sample Size and Antecedent Data
At the time of writing, 356 participants have completed the second Insight 46 visit. Based on current rates of completion, we estimate that about 450 participants will have completed the second Insight visit by the time the study ends in the spring of 2020. Based on the first Insight 46 visit [32], we anticipate that at least 18% (n = 81) of these participants will be positive for β-amyloid. By design, all participants will have complete cardiovascular data from the 60–64 NSHD clinic (as described) [29], and the majority will have complete blood pressure and anthropometric data from ages 26, 43, 53, 60–64 and 69–71 in previous NSHD sweeps.
Ethical approvals for NSHD and Insight 46 were provided by Research Ethics Committees in England and Scotland as described previously [28,29,33,34]. Ethical approval for the Insight 46 Cardiovascular sub-study was given by the National Research Ethics Service Committee London (REC reference 14/LO/1173). All participants provided written informed consent to participate and for their data to be stored in accordance with the Data Protection Act.
2.2. Brachial Blood Pressure Measurement
Brachial blood pressure was measured in duplicate in the left arm using an HEM-907 Omron (Omron Corporation, Kyoto, Japan) with the study participant in three positions: (1) supine, (2) seated, and (3) standing. If there was a problem with the left arm (e.g. mastectomy, broken arm, etc.), the right arm was used. The following steps were repeated for each position:
- •
0–3 min: participant positioned (either seated, lying down, or standing).
- •
3 min: first blood pressure measurement recorded.
- •
4 min: second blood pressure measurement recorded.
2.3. Central Blood Pressure Measurements including Pulse Wave Analysis and Reservoir Excess Pressure Analysis
Pulse wave analysis is the gold standard for non-invasively measuring central blood pressure in addition to providing relevant hemodynamic measures. We used a hand-held tonometer (SphygmoCor, AtCor Medical Pty, Sydney, Australia) to record the blood pressure waveform at the right radial artery in a semi-supine position (bed inclined at an angle or 30–45°). The waveform was calibrated to the seated systolic and diastolic brachial blood pressure measured using the MIT Elite Plus device (Omron, Kyoto, Japan). Measurements were made until a reproducible waveform was displayed for at least 12 s. If the operator index was <80 the measurement was repeated until an adequate recording is achieved. The waveform overlay was also visually inspected to ensure little variability between each waveform (Figure 2). Further analysis of the blood pressure waveform will be performed using custom-written software in MATLAB to separate the pressure waveform into forward and backward components and to derive reservoir parameters [35].

Example output from Sphygmocor device showing the blood pressure waveform measured at the right radial artery for participant one of Insight 46. Clinical parameters such as the aortic Systolic Pressure (SP) and aortic Pulse Pressure (PP) are calculated from the average aortic pulse waveform.
2.4. Pulse Wave Velocity
Pulse wave velocity refers to the speed of travel of a pressure pulse along an arterial segment and is the gold standard for measuring arterial stiffness [36]. We evaluated carotid-femoral PWV using a Vicorder instrument (Skidmore Medical, Germany) to measure the transit time between a pressure sensor cuff placed over the carotid artery, and a pressure sensor cuff placed on the right thigh over the femoral artery according to recent consensus guidelines [36]. Participants were positioned with the shoulders and head raised by approximately 30°. To ensure an accurate measure of the path length between the two sensors, the following distance measures were performed:
- 1.
Proximal distance (carotid): The distance from the suprasternal notch diagonally to the lower edge of the neck cuff.
- 2.
Distal distance (femoral): The distance between the suprasternal notch directly to the top of the thigh cuff.
The waveforms from each pressure sensor were inspected to ensure each trace was noise free, and stable. If a waveform failed any of these criteria, the cuffs were readjusted, or the participant was re-positioned. We performed three repeat measurements. If the PWV varied between repeats by more than 0.5 m/s, two more measurements were acquired. If the difference between the latter three PWV measurements was still greater than 0.5 m/s, the original three measurements were accepted.
2.5. Common Carotid Intimal Medial Thickness and Carotid Plaque
Carotid intimal medial thickness and carotid artery plaque are used as measures of sub-clinical atherosclerosis. Vascular ultrasound of the left and right carotid arteries was performed using a EPIQ 7G scanner (Philips Healthcare, Andover MA, USA) with a linear array transducer (L12–3). A plaque was defined as a focal structure encroaching ≥0.5 mm into the arterial lumen, ≥50% of the surrounding IMT value, or having a thickness >1.5 mm as measured from the intima–lumen interface to the media–adventitia interface [37,38]. Image acquisition settings are specified in Supplementary data (S2).
Longitudinal and transverse views of plaques were obtained and Power Doppler was used to assist in delineation of plaques. For measurement of cIMT, three cine loops of five cardiac cycles of both left and right vessels were recorded from the proximal (posterior), mid, (lateral) and distal (anterior) angulations. A still image at the R wave for each angle was also acquired. Analysis of far wall and near wall carotid intimal-media thickness layer will be performed over a 10-mm straight length proximal to the bulb according to the Mannheim carotid intima-media thickness and plaque consensus recommendations [38], and measurement of plaque area, grey composition, and Gray-Weale classification will be performed using validated software (Arterial Measurement System, AMS 3.0, Chalmers University of Technology, Göteborg, Sweden) [39].
2.6. Echocardiography
All participants underwent transthoracic echocardiography using a Philips EPIQ 7G scanner equipped with an X5-1 transducer [see Supplementary Data (S3) for more details]. Three ECG leads were placed on the participant’s chest ensuring an adequate ECG signal quality and clear QRS complex throughout the examination. Five cardiac cycles were recorded for 2D-images and 10 cardiac cycles were recorded for spectral Doppler imaging. 2D images were optimized ensuring a frame rate of at least 40 frames per second, and clear endocardial delineation before recording. Doppler acquisitions were performed with a sample volume size of 1–3 mm for PW Doppler and with a sweep speed ranging between 50 and 100 mm/s. For 3D-imaging, an ECG-gated full-volume 3D dataset (four sub-volumes acquired over four cardiac-cycles) of the Left Ventricle (LV) and Left Atrium (LA) was obtained. Analysis will be performed using QLab (Q-Station, version 3.9, Philips, Hamburg, Germany) for 2D and Doppler measurements and Tomtec for 3D and 4D measurements (TomTec Image Arena, version 2.30, TomTec Imaging Systems, Munich, Germany).
2.7. Submaximal Exercise (Stepper) Test
A self-paced, 6-min Stepper Test (6MST) was performed. Results from the 6MST have been shown to correlate closely with distance achieved in a 6-min walk test [31]. Furthermore, the 6MST permitted concurrent physiological assessments of blood pressure and heart rate using a motion-insensitive blood pressure monitor fitted with 3-lead ECG (TANGO M2, SunTech Medical Inc., Morrisville, NC, USA).
2.8. Resting ECG and Heart Rate Variability
A standard 12-lead ECG was performed at rest in the supine position. An additional 5-min recording of the 12-lead ECG was also collected to assess resting heart rate and HRV using a CardioPerfect ECG monitor (Welch Allyn Inc., Skaneateles Falls, NY, USA).
2.9. Cerebrovascular Assessments using fNIRS
To measure cerebral haemodynamics, we used a continuous wave NIRS device (Brite 24, Artinis Medical Systems, BV, Zetten, The Netherlands), which has 18 channels (10 sources and eight detectors) with wavelengths of 752 and 839 nm and a sampling frequency of 10 Hz. Sixteen of the channels are referred to as ‘long-separation’ channels as they are separated by 3 cm, thereby detecting light reflected from the cortical layer of the brain (~1.5 cm depth). These were arranged in quadrants approximately over the left and right prefrontal cortices, and the left and right motor cortices. The remaining two channels are referred to as ‘short-separation’ channels, as they are separated by 1 cm, thereby detecting light reflected from the superficial layers of the head (~0.5 cm depth), including the scalp and skull. These were arranged over the left and right prefrontal cortices. fNIRS measurements were continuously recorded during three psychometric tests (see following sections for details).
2.9.1. Spatial calibration
Our fNIRS system was integrated with a Polhemus Patriot Digitization device (Polhemus, Colchester, VT, USA) which enables the fNIRS measurements to be spatially registered to the Montreal Neurological Institute stereotaxic coordinate system. The Polhemus works by using an electromagnetic source (located in a fixed position in the room near the head) to track the position of a sensor, which is used to label anatomical landmarks on the head (specifically the nasion, inion, left preauricular point, right preauricular point, and the central zero point) [40], and the position of each individual source and detector. The result of the digitization is illustrated in Figure 3a, where the position of each source and detector with respect to the brain was determined.

(a) Position of sources and detectors with respect to the head obtained using the Polhemus digitization system. The detectors are shown in blue and the sources are shown in yellow (long separation channels) and red (short separation channels). The channels are arranged in quadrants over the left and right prefrontal cortices and the left and right motor cortices. (b) Photograph showing the Brite 24 cap and the Finometer finger cuff in position on a study participant. The channels in the left motor cortex are outlined in magenta in both (a) and (b). RMC, right motor cortex; LMC, left motor cortex; RPFC, right prefrontal cortex; LPFC, left prefrontal cortex.
2.9.2. Peripheral blood pressure and heart rate
During psychometric testing (described in following section), beat-to-beat peripheral blood pressure and heart rate were measured using a Finometer. To set up the Finometer, an appropriately sized cuff was selected according to the manufacturer’s guidelines and fitted on the middle finger of the non-dominant hand of each participant; in some cases, the index finger was used if this provided a better fit. Electronic markers were placed to indicate the start of events within the psychometric testing protocols, thereby enabling synchronisation of hemodynamic measurements with fNIRS measurements.
An example of the experimental setup is given in Figure 3b, which shows a study participant wearing the Brite 24 fNIRS cap and the Finometer finger cuff. The orientation of the sources and detectors as measured by the Polhemus Digitization step (Figure 3a) with respect to the photograph (Figure 3b) is indicated by the magenta dashed line which corresponds to the left motor cortex in both images.
2.10. Psychometric Testing Protocols
We used psychometric tests that require executive and motor function as (i) these functions have been shown to be impaired in people with dementia in previous studies and (ii) the areas of the brain required to perform these functions are located near the surface, and are amenable to measurement using fNIRS.
The tests included in the fNIRS psychometric protocol are the (1) Colour Trails Test (CTT), (2) Stroop Colour Word task, and (3) finger tapping test. OHB and HHB, blood pressure, and heart rate were measured continuously throughout each test using the Brite 24 and the Finometer. The testing protocols are described below.
- 1.
Colour Trail Test (CTT): We used the CTT test developed by D’Elie and Satz where the participant was required to draw lines connecting circles in ascending order (from 1 to 25) but alternating colour (pink and yellow) [see Supplementary Data (S4)] [41–43]. Each participant was given an abbreviated practice CTT with numeric values from 1 to 8 to demonstrate their understanding of the test instructions. After the practice CTT was completed, the protocol proceeded as follows:
- •
60-s baseline.
- •
Participant performed CTT, starting at the pink ‘1’ and ending at the pink ‘25’. If they made a mistake, the operator re-directed them to the last correct value and asked them to start from there.
- •
60-s recovery.
- •
- 2.
Stroop Colour Word task: In this test, the participant was required to read out loud either the colour of the ink or the word as it was spelled depending on the administrator’s instruction [see Supplementary Data (S5)]. The Stroop Colour Word task is a well-established psychometric test described extensively elsewhere [44,45]. Our protocol was comprised of three blocks, each interspersed with a 60-s baseline period where the participant was resting. The exact protocol is as follows:
- •
60-s baseline.
- •
Block 1: Read 100 words printed on the page in black ink. The words were either ‘Red’, ‘Green’, or ‘Blue’.
- •
60-s recovery.
- •
Block 2: Read 100 ‘XXXX’ printed on a page in coloured ink. The ink colours were red, green, and blue.
- •
60-s recovery.
- •
Block 3 – the incongruous Stroop task: Read 100 words printed on a page in an ink colour that does not match what the word said.
- •
60-s recovery.
- •
- 3.
Finger tapping test: An electronic tapping test device [see S6 in Supplementary Data] [46] was used to measure tapping speed by counting the number of times the button was depressed with the index finger within a 10-s time period. Participants were instructed to lay their palm as flat as possible (with the fingers extended) on the table and device such that the index finger was the only part of the hand moving whilst tapping the device. Before setting up the fNIRS cap and the finometer, we recorded (1) the tapping speed of the participant’s non-dominant hand during a single 10-s trial and (2) the tapping speed of the participant’s dominant hand during a single 10-s trial. The remainder of the finger tapping protocol occurred after the fNIRS cap and Finometer had been set up, and only involved the dominant hand. Specifically, we repeated the finger tapping test five times, with short recovery periods (10–20 s) between tapping trials, and long recovery periods (60 s) before the first trial and after the fifth trial.
2.11. fNIRS Signal Post-processing
Cerebral and extracerebral tissues contribute to the overall fNIRS signal, with the latter considered a signal contaminant since it masks functional brain activity [47]. Non-evoked systemic and neuronal physiological processes (such as Mayer waves and respiration) and motion artefacts may also confound functional brain activity. To extract the component of the fNIRS signal corresponding to functional brain activity, a freely available Matlab package called HOMER2 and built-in Matlab functions were used to remove these physiological confounds and to convert the raw intensity fNIRS data to concentration using well-established fNIRS signal processing techniques. For more information on the processing steps, the reader is referred to Scholkmann et al., 2014 [22]. Our specific post-processing pipeline is described in Supplementary information (S7) [48,49].
3. INITIAL RESULTS AND PILOT DATA
We present preliminary data from Insight 46 participants to illustrate results from the cerebrovascular assessments using fNIRS in combination with beat-to-beat blood pressure monitoring.
Figure 4 shows how Mean Arterial Pressure (MAP) changes throughout each psychometric test from a representative participant. Note how the MAP tends to increase during the task blocks (denoted by the yellow boxes superimposed over the graph) compared with the baseline periods.

Change in mean arterial pressure for participant two of Insight 46 during the Colour Trail Test (CTT), Stroop, and finger tapping tasks. The yellow boxes correspond to the time periods where the participant was performing the task.
Figure 5 shows the changes observed in heart rate, MAP and OHB measured during the Stroop task for a different study participant. Note that the OHB trace shown in Figure 5 is shown before the contribution of extracerebral blood flow has been regressed from the signal. All three of these cardiovascular measures tend to rise in response to the stimuli compared to the baseline periods. This figure also demonstrates the feasibility of synchronising the Finometer and the Brite 24 fNIRS cap.

The change in mean arterial pressure, heart rate, and the concentration of Oxygenated Haemoglobin (OHB) measured during the Stroop task for participant three of Insight 46. Blocks 1–3 of the Stroop task (the cognitive stimuli) are denoted by the yellow rectangles superimposed over each individual graph. Note how all three cardiovascular measures increase in response to the stimuli compared with the baseline readings.
Preliminary finger-tapping fNIRS results from an Insight 46 study participant considered to be in good cardiovascular health are shown in Figure 6. The block averaged fNIRS results for each channel are organised in rows according to their location over the brain. Note the strong increase in OHB in Left Motor Cortex (LMC), and the weaker but clear increase in OHB on the Right Motor Cortex (RMC) and Left Prefrontal Cortex (LPFC).
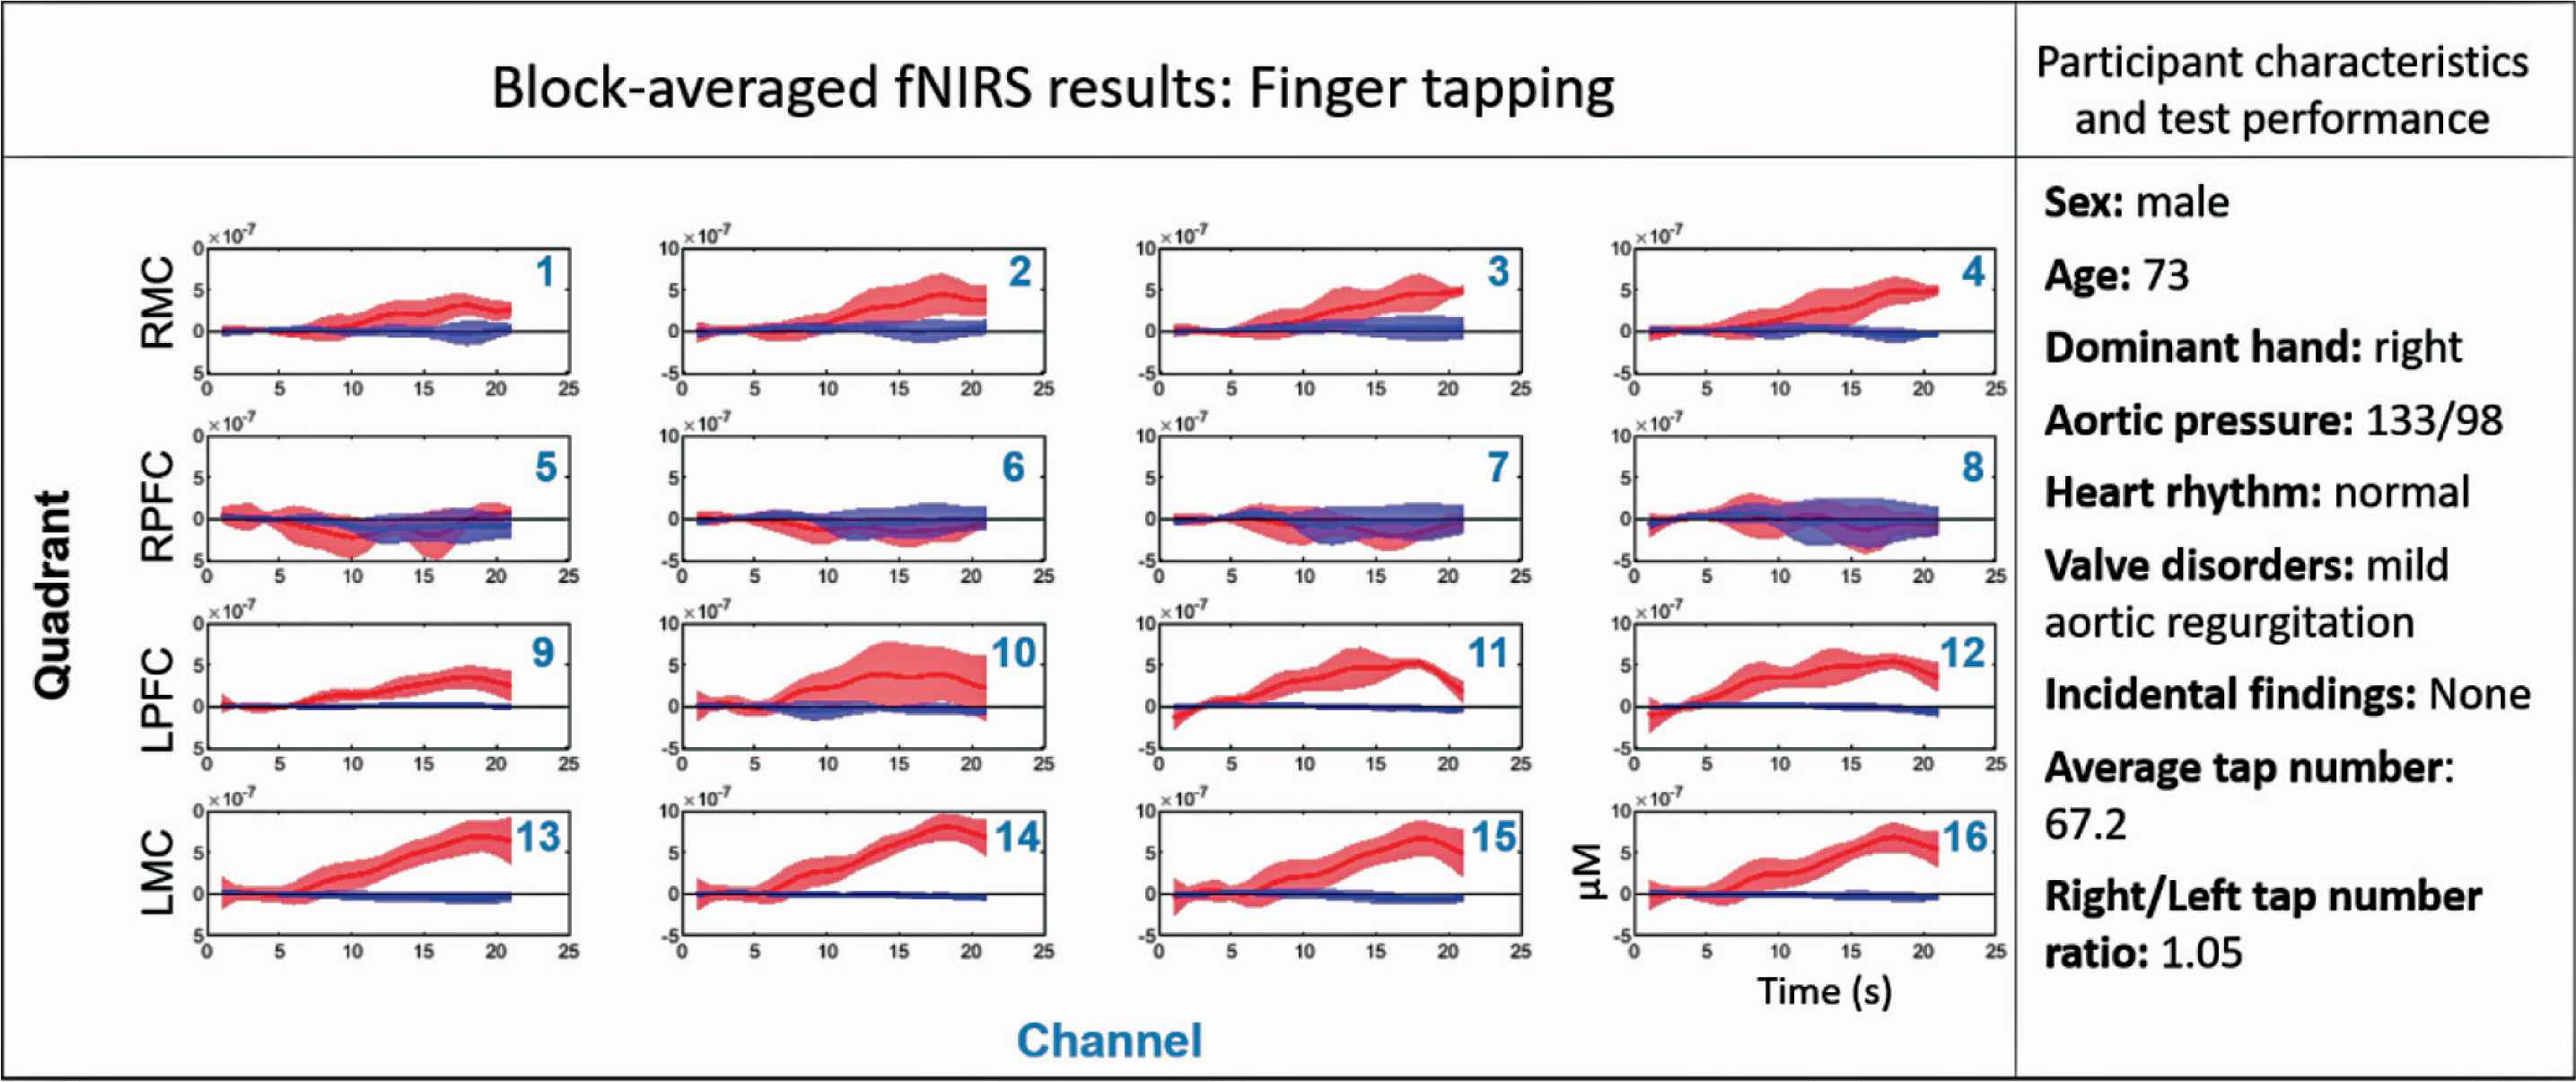
Results from the finger tapping test, participant characteristics, and test performance shown for participant one of Insight 46. The cardiovascular characteristics reported were measured during the standard cardiovascular assessments using echocardiography, ECG, and PWV. The bottom right subplot indicates the axes labels for all other subplots. The red and blue solid lines correspond to the mean Oxygenated Haemoglobin (OHB) and Deoxygenated Haemoglobin (HHB) signals respectively over the five finger-tapping blocks, and the shaded areas represent the standard deviation. Finger tapping occurred over a 10-s period starting at 5 s and ending at 15 s. 0–5 s and 15–20 s are baseline periods. Each of the 16 long-separation channels are displayed for each participant, and are arranged in rows corresponding to position over the brain. Row 1 = Right Motor Cortex (RMC), row 2 = Right Prefrontal Cortex (RPFC), row 3 = Left Prefrontal Cortex (LPFC), row 4 = Left Motor Cortex (LMC).
4. DISCUSSION
Preliminary results from this pilot data indicate that the Finometer and fNIRS are sensitive to the physiological changes induced by the psychometric tests performed in the second visit of Insight 46. The increase in MAP and heart rate suggest activation of the sympathetic nervous system during the cognitive tasks, which is in line with previously published observations [22,50].
As fNIRS is the most exploratory technique performed in Insight 46, it is important to establish the integrity with which it can assess cerebrovascular function. The well-established activation patterns of finger tapping make this psychometric test an ideal candidate for validating the fNIRS-derived measures of neurovascular coupling for this study. In a participant with good cognitive function, the strongest functional brain activity (i.e. neurovascular coupling) is expected to occur in the motor cortex on the contralateral side of the hand performing the tapping, with a lesser signal expected in the ipsilateral side [51,52]. Indeed, the fNIRS results shown in Figure 6 are reassuring, as the HRF measured in the LMC of this right-handed individual is characteristic of strong neurovascular coupling. As expected, weaker neurovascular coupling also occurred in the RMC of this participant during the finger tapping task. Future work will involve comparing expected patterns of functional brain activity on all three psychometric tests with fNIRS results in the participants with the best cardiovascular health to (1) ensure use of the optimal post-processing pipeline for each test and (2) to establish a benchmark with which we can compare sub-populations of Insight 46, such as those with cardiovascular disease or amyloid plaques.
The neurovascular element is critical to understanding the mechanisms of cognitive decline, yet is largely understudied. Insight 46 attempts to bridge that gap. Although further optimisation and validation of fNIRS for our specific application is still required, the promising results from the pilot data suggest that it could be a powerful tool for investigating the link between neurovascular coupling and cognitive performance. These fNIRS measurements in conjunction with task-free functional MRI measurements of cerebral blood flow (resting-state MRI arterial spin labelling) performed on both Insight 46 visits will provide an unprecedented assessment cerebrovascular function in older adults.
Detailed assessment of the cardiovascular system and particularly the integrity of the neurovascular unit will enhance the imaging and cognitive data collected as part of Insight 46, and it should provide novel insights into the interrelationships between cardiovascular health and brain ageing. The inclusion of fNIRS in a population-based study is a relatively novel approach that has the potential to provide an evaluation of cerebrovascular function on a wide-scale in a representative sample. The combination of lifestyle data, brain structure and function, cognitive performance, and cardiovascular health obtained not only from Insight 46, but also from the whole-NSHD provides an exciting opportunity to advance our understanding of the cardiovascular mechanisms underlying the commonest forms of cognitive decline and dementia and identify novel CVD targets for intervention.
CONFLICTS OF INTEREST
Nish Chaturvedi serves on a Data Safety and Monitoring Board for a clinical trial of a glucose lowering agent, funded by AstraZeneca. No other authors have competing interests.
AUTHORS’ CONTRIBUTION
SAM wrote the manuscript, helped with data collection, developed fNIRS analysis pipeline, and provided results in manuscript. LAS helped with data collection, validated echocardiography protocol, and wrote supplementary data sections describing cIMT procedure and echocardiography imaging protocol. SJ contributed in data collection and development of fNIRS, exercise, and echo protocols. GB contributed in instrumentation, data collection, and analysis associated with fNIRS. SNJ helped with INSIGHT 46 design and analysis. HMS contributed in INSIGHT 46 design, execution, and participant recruitment. AR involved in INSIGHT 46 design and execution and also helped design and write protocols for cIMT brachial blood pressure, ECG, PWA and PWV. SW contributed in INSIGHT 46 data collection, including echo, ECG, PWA, PWV, and cIMT. BW contributed in design the fNIRS protocol and helped collect fNIRS data. MR contributed to the conception of the study and developed psychometric testing protocols used. NCF contributed to the conception the study, particularly on aspects relating to cognitive decline and dementia. RH contributed to the conception the study, specifically on aspects related to MRC NSHD. JMS contributed to the conception of the study, particularly in aspects relating to dementia and brain structure/function. NC contributed to the conception of the study, particularly in aspects relating to the MRC NSHD and also involved in data collection protocols. ADH contributed to the conception of the paper and the study, particularly on aspects related to cardiovascular phenotyping and also involved in data collection protocols, data analysis, and writing of the manuscript. LAS, SJ, GB, SNJ, HMS, AR, SW, MR, NCF, RH, JMS and NC contributed in revising the manuscript.
FUNDING
Insight 46 is funded by grants from
ACKNOWLEDGMENTS
We would like to thank the study members from the MRC National Survey of Health and Development (NSHD) for their lifelong commitment to the study and the Insight 46 and NSHD study teams for their work, help and guidance.
SUPPLEMENTARY MATERIALS
Supplementary data related to this article can be found at
Footnotes
Peer review under responsibility of the Association for Research into Arterial Structure and Physiology
Data availability statement: Data used in this publication are available to bona fide researchers upon request to the NSHD Data Sharing Committee via a standard application procedure. Further details can be found at http://www.nshd.mrc.ac.uk/data. Doi numbers: 10.5522/NSHD/Q101; 10.5522/NSHD/Q102; and 10.5522/NSHD/Q103.
REFERENCES
Cite this article
TY  - JOUR
AU  - Sarah Ann Mason
AU  - Lamia Al Saikhan
AU  - Siana Jones
AU  - Gemma Bale
AU  - Sarah-Naomi James
AU  - Heidi Murray-Smith
AU  - Alicja Rapala
AU  - Suzanne Williams
AU  - Brian Wong
AU  - Marcus Richards
AU  - Nick C. Fox
AU  - Rebecca Hardy
AU  - Jonathan M. Schott
AU  - Nish Chaturvedi
AU  - Alun D. Hughes
PY  - 2020
DA  - 2020/04/24
TI  - Study Protocol – Insight 46 Cardiovascular: A Sub-study of the MRC National Survey of Health and Development
JO  - Artery Research
SP  - 170
EP  - 179
VL  - 26
IS  - 3
SN  - 1876-4401
UR  - https://doi.org/10.2991/artres.k.200417.001
DO  - 10.2991/artres.k.200417.001
ID  - Mason2020
ER  -