
Data Fusion Approach Improves the Prediction of Single Phenolic Compounds in Honey: A Study of NIR and Raman Spectroscopies
- DOI
- 10.2991/efood.k.191018.001How to use a DOI?
- Keywords
- Honey; phenolic compounds; data fusion; spectroscopy; partial least square (PLS)
- Abstract
The combination of Near-Infrared Spectroscopy (NIR) and Raman Spectroscopy (RS) of 100 honey samples collected from different countries were used to develop the calibration model for determination of single phenolic compound. In high-performance liquid chromatography with diode-array detection analysis, 16 phenolic compounds were identified with p-hydroxybenzoic acid being the major compound detected in all honey samples. Thus, p-hydroxybenzoic acid was used for developing prediction models. Spectral data were modeled individually and using data fusion methodologies. The performance of the model based on RS spectra [
- Copyright
- © 2019 International Association of Dietetic Nutrition and Safety. Publishing services by Atlantis Press International B.V.
- Open Access
- This is an open access article distributed under the CC BY-NC 4.0 license (http://creativecommons.org/licenses/by-nc/4.0/).
1. INTRODUCTION
The growing market and consumer demand for quality foods with health benefits have generated the need for rapid and accurate analytical tools for the determination of bioactive compounds in honey and honey products. For the past years, several studies have reported on the determination of antioxidants in various food commodities. The conventional methods for analysis of phenolic compounds in honey are High-Performance Liquid Chromatography (HPLC) with Diode-Array Detection (DAD) or UV–Vis detector [1,2], whereas in some cases gas chromatography–mass spectrometry [3] and capillary electrophoresis have been used. Regardless of their precision, chemical assays are time-consuming, expensive, and require a large number of solvents [4]. Therefore, simple, rapid, and inexpensive instruments are needed. Spectroscopic technologies are widespread in the analysis of antioxidant in foods [5]. They have also become well-known in the investigation of honey quality because of their benefits (including speediness, directness, and cost-effectiveness). The existence of novel multivariate tools to deal with several variables simultaneously is additional motivation for fast changes within the domain of measurement technology and the sensors. The current trend of using multiple spectra simultaneously is more promising than a single spectrum method because of a better representation of multivariate analysis. The combined use of nondestructive methodologies and data fusion techniques to predict the phenolic compounds in honey has been briefly described in this study. It is not aimed to provide complete detail of the conventional chemical methods, spectral interpretations, and spectroscopic analysis conditions, but rather to discuss all the main issues related to data fusion as well as the potential implementation of measuring of single phenolic compounds in honey. Data obtained from different kind of instruments usually depend on diverse physical phenomena, thus elucidations of findings are complicated. Some of the spectroscopies may be more accurate than others because these are more sensitive in certain circumstances [6]. Data fusion has been used in various areas: for instance, the combination of headspace–mass spectrometry, Fourier transform mid-infrared spectroscopy and UV–Visible spectrophotometry to predict virgin olive oil sensory descriptors [7], Near-Infrared (NIR), fluorescence, and nuclear magnetic resonance spectroscopy to assess oil quality [8], electronic noses and spectroscopic instruments to identify the geographical olive oil [9], and electronic tongue and NIR for a rapid umami taste assessment [10]. Other promising methods, spectroscopic data, and chemometric modeling have been proposed for the quantification of antioxidant compounds in wine [11,12], honey [13,14], coffee [15], dark soy sauce [16], roselle tea [17], olive oil [18], chocolate [19], apples [20], raw propolis [21], and Populus spp. leaves [22]. In most of these studies, a single technique has been used for prediction of antioxidants.
The aim of the current experiment was to investigate the correlation between spectroscopy data and HPLC measurement. To improve the information quality and to assess the synergistic effect, low- and mid-level data fusion approaches were implemented to combine the data of NIR and Raman spectroscopy, and the outcome was compared and discussed. Up to now, there are no cases of the above-mentioned combined spectroscopy techniques for the prediction of single phenolic compounds in honey.
2. MATERIALS AND METHODS
2.1. Chemicals Reagents
All reagents, phenolic acids, and flavonoid used for HPLC analysis were of HPLC grade and the other chemicals were of analytical grade. Kaempferol, myricetin, rutin, caffeic acid, ferulic acid, p-hydroxybenzoic acid, catechol, chlorogenic acid, syringic acid, vanillic acid, and quercetin were from China Sigma-Aldrich (Shanghai, China). Catechin, chrysin, p-coumaric acid, gallic acid, and hydroxycinnamic acid were purchased from Altar Ink Quality Inspection Technology Co., Ltd. (Beijing, China). Milli-Q water purification system (Millipore Corp., Billerica, MA, USA) was used for water purification. Methanol was supplied by Sinopharm Chemical Reagent Co., Ltd Shanghai, China. Solid phase extraction (SPE) with C18 cartridges was supplied by Waters Corporation, Ireland.
2.2. Honey Samples
One hundred samples of honey of different botanical origins were obtained from different countries. The common names and botanical and geographical sources of honey samples are presented in Table 1.
| No. | Codes | Botanical origin | Common name | Geographical origin |
|---|---|---|---|---|
| 1 | H1 | Leptospermum scoparium | Manuka honey | Australian (n = 7) |
| 2 | H2 | Polyfloral | - | Australian (n = 5) |
| 3 | H3 | Polyfloral | - | Germany (n = 4) |
| 4 | H4 | Citrus spp. | Orange blossom | Spain (n = 8) |
| 5 | H5 | Eucalyptus spp. | Eucalyptus honey | Spain (n = 7) |
| 6 | H6 | Rosmarinus ojicinalis L. | Rosemary blossom | Spain (n = 7) |
| 7 | H7 | Acacia seyal | Talih | Sudan (n = 8) |
| 8 | H8 | Ziziphus spina-christi | Sider | Sudan (n = 7) |
| 9 | H9 | Polyfloral | - | Sudan (n = 8) |
| 10 | H10 | Ziziphus spina-christi | Sider | Pakistan (n = 7) |
| 11 | H11 | Vitex negundo L. | Chaste honey | China (n = 7) |
| 12 | H12 | Litchi chinensis Sonn. | Lychee honey | China (n = 9) |
| 13 | H13 | Polyfloral | Wild flower | China (n = 8) |
| 14 | H14 | Polyfloral | - | France (n = 4) |
| 15 | H15 | Polyfloral | - | Cameroon (n = 3) |
-, multispecies.
Honey samples
2.3. Spectroscopic Analysis
For spectroscopic analysis, honey samples were warmed at 40°C and then mixed to dissolve the crystals to form homogenous samples before spectroscopic testing. Two nondestructive sensing techniques including NIR and Raman spectroscopies were obtained from our previous work [2,14].
2.3.1. NIR spectroscopy
An Antaris II near-infrared spectrophotometer (Thermo Electron Co., USA) with a reflectance module was used to obtain the honey spectra. Each spectrum was the average of 32 scanning spectra. The range of spectra was from 10,000 to 4000/cm and each spectrum was measured according to 3.856/cm data intervals, thus, each spectrum resulted in 1557 variables.
2.3.2. Raman spectroscopy
The DXR Laser Raman Spectrometer (Thermo Fisher Scientific, USA) coupled with excitation laser of 532 nm, the spectrograph allows a resolution of 5/cm using 900 lines/mm, was used to obtain the honey spectra. Each honey was screened using a laser power at the sample of 10 mW. A spectrum from each sample was collected for 5 min using the continuous extended scan from 50 to 3500/cm.
2.4. Reference Analysis by HPLC-DAD
Honey samples (10 g) were diluted with 40 mL of purified water, adjusted to pH 2 with HCL (0.1%), and sonicated for 15 min at 25°C. Furthermore, honey solutions were filtered through cotton wool to remove any solid particles. An SPE with C18 cartridges (Waters Corporation, Ireland) was conditioned by passing 10 mL of methanol and 10 mL of purified water. The filtered honey solutions were loaded on the SEP cartridges and washed with 30 mL of acidified purified water (pH 2) to eliminate all sugars and other polar components of honey. The absorbed phenolic compounds were eluted with methanol (2 mL), and then the extracts were filtered through a 0.22-μm membrane filter before being quantified by HPLC-DAD. Separation of phenolic compounds was performed on Zorbax SB-C18 column (250 mm, 149 × 4.6 mm, 5 μm particle size, Agilent Technologies, USA). The detailed analysis, condition, and validation parameters of HPLC-DAD investigation can be found in our previously published work [2].
2.5. Multivariate Data Analysis
The spectral preprocessing and partial least square regression (PLSR) model were computed using Matlab Version 7.1 (Mathworks Inc., Natick, MA, USA). The obtained spectra of NIR and Raman include noises as well as the honey information. Hence, the pretreatment is important to reduce the interferences and undesirable information, and enhance the contribution of chemical components. On the basis of our previous work [2], the optimum pretreatments for Raman were Savitzky–Golay algorithm (15 data points and a second-order polynomial function) and Multiplicative Scatter Correction (MSC). Whereas for NIR, it was found that standard normal variate performed better as compared with another noted method.
Figure 1 shows the raw spectra of analyzed honey samples. In this work, the whole spectrum regions were (400–10,000/cm) for NIR and (1500–400/cm) for Raman.
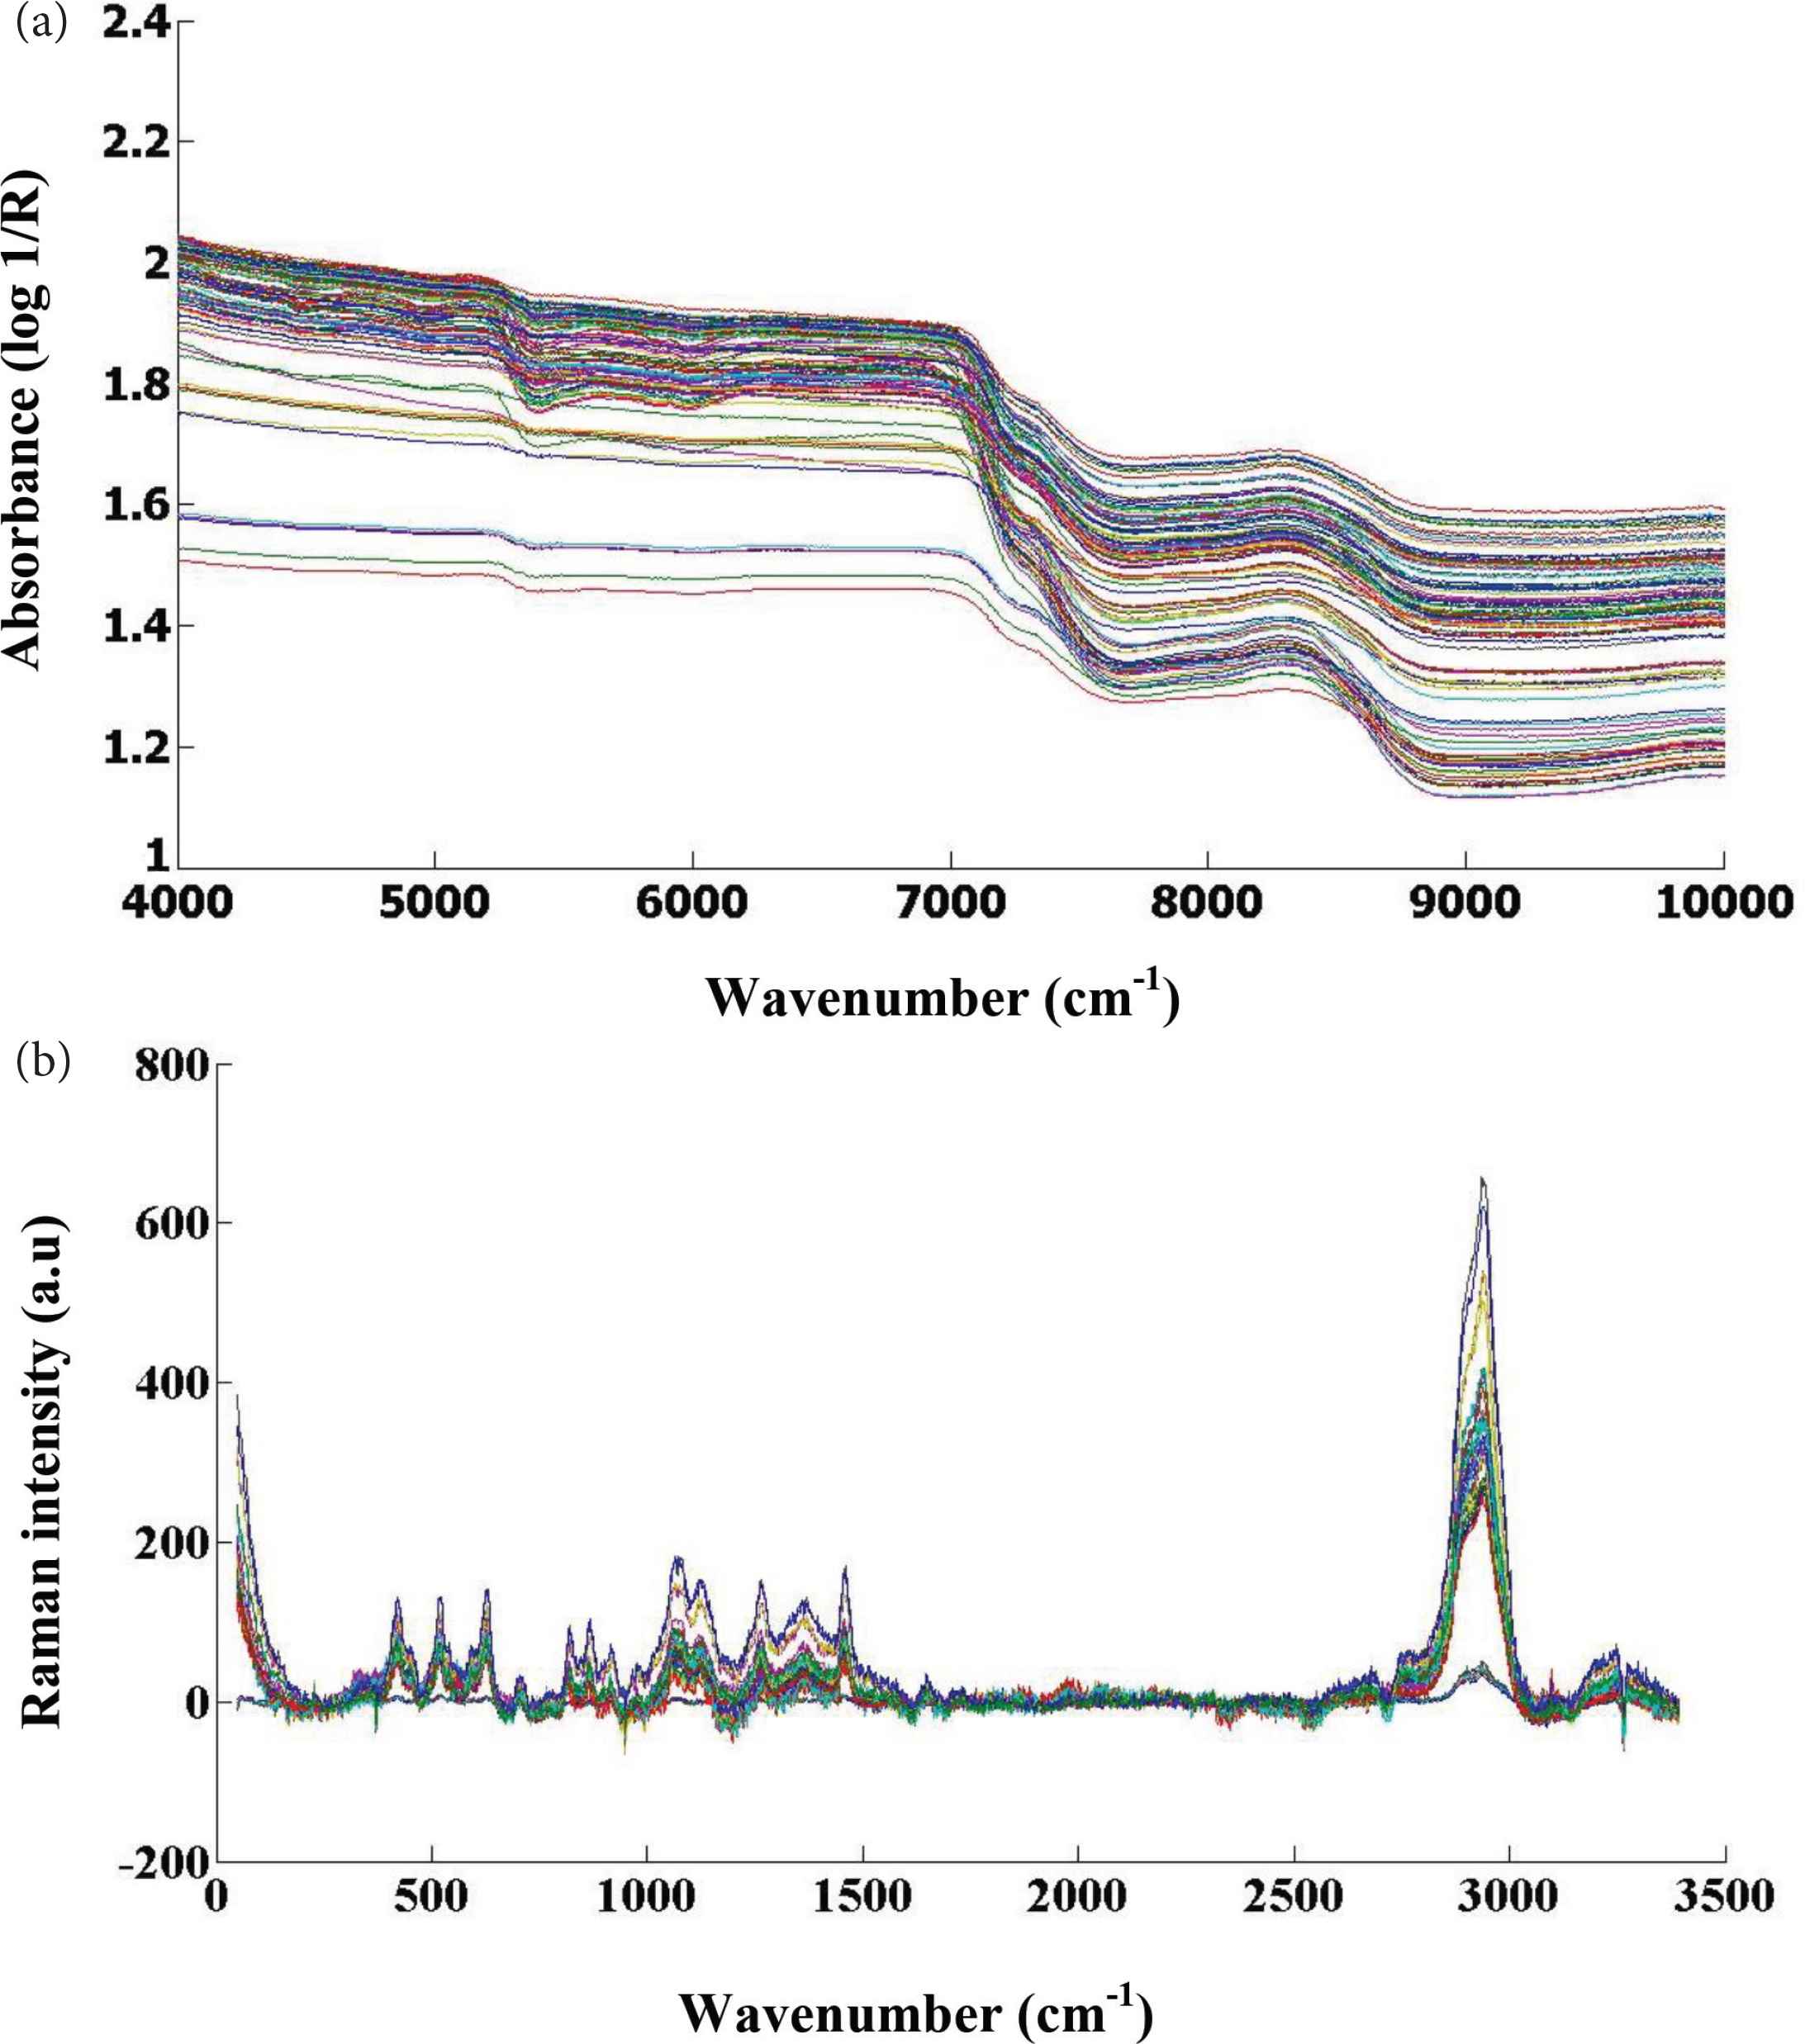
Raw spectra of different honey varieties. (a) NIR spectra with a reflectance module (4000–10,000/cm) and (b) Raman spectra with Raman shift value (3500–50/cm).
From Figure 1, it is clear that honey samples presented characteristic bands and they have the potential to be used for detecting phenolic compound using chemometrics. The detailed interpretations of bands from the two spectroscopic techniques can be found in the literature [2,23–25].
For developing chemometrics model, the spectral data were classified into calibration and prediction sets as described in our previous study [14]. Briefly, all 100 samples were classified randomly based on their corresponding y-value (viz. the phenolic compound data). With respect to the classification of the calibration/prediction sets, 17 spectra of each 50 types of honey were located for the prediction set. Therefore, the calibration and prediction sets have 64 and 36 spectra, respectively. PLSR is generally used as statistical tool for constructing linear regression models based on the variable matrix X (spectroscopic data) and variable matrix Y (p-hydroxybenzoic acid data) by guaranteeing that all latent variables were set on the basis of their relevance for predicting Y [26]. The Latent Variables (LVs) of the PLSR models were determined by leave-one-out cross-validation by mapping the number of factors against the Root Mean Squared Error Cross Validation (RMSECV). The optimum number of LVs was determined by the lowest value of RMSECV. The performance of the PLSR models was evaluated using Rc, Rp, Root Mean Standard Error of Prediction (RMSEP), RMSECV, and the Ratio of Prediction to Deviation (RDP) values. In general, an excellent model must have high correlation coefficients and RDP value with low RMSECV and RMSEP [17,27,28].
2.6. Data Fusion
Data fusion can be performed at three levels: low, medium, and high. For low-level data fusion, the original data are simply merged after applying appropriate preprocessing methods. It is also predisposed to huge data computation, tedious and worse real-time; high-level data fusion (i.e., decision-making level) requires skills and immense data pretreatments [29]. Mid-level fusion includes extraction of features from each spectral source separately before data fusion then merge them into a single block, which will be processed by a calibration method. Generally, the highest scores from the Principal Component Analysis (PCA) or Partial Least Squares (PLS) regression were combined. In the present study, data compression using PCA were implemented. Briefly, PCA was performed on each data set individually and two approaches were attempted to select the number of PCs to be combined from the two data sets. In the first method (approach 1), a constant number of PCs – 10 were taken for each data set and merged in the fused matrices of the size 100 × 20 (for the two data sets). In the second method (approach 2), a different number of PCs, corresponding to the highest total variance was selected for each data set and merged. Approach 1 (i.e., a fixed number of PCs) improved the prediction results, hence, it was adopted in this experiment.
3. RESULTS AND DISCUSSION
3.1. Phenolic Compound Profiles
In this study, 16 phenolic compounds have been identified in honey samples from various countries (Table S1). About 11 phenolic compounds have been identified in Australian Manuka honey with p-coumaric acid (64.08 mg/100 g) and catechin (60.71 mg/100 g) being the major compounds, whereas chrysin was at a lower level (0.81 mg/100 g). The concentrations of phenolic compounds in Manuka honey are higher than previously reported [30]. The higher concentration of phenolic compounds that were detected could be due to variations in the seasons and the effective approach (e.g., weight and extraction condition) adopted in this study. Similar differences in concentrations were reported in the literature [30–32]. All detected compounds have been previously reported in honey [2,30,33]. Polyfloral honey obtained from Australia showed a fewer number of phenolic compounds (syringic acid, p-hydroxybenzoic acid, and vanillic acid).
The honey richest in p-hydroxybenzoic acid was polyfloral samples collected from Germany, whereas Australian polyfloral and Rosemary blossom showed lower values. The highest concentrations of syringic acid were present in Cameroonian polyfloral honey (110.06 mg/100 g) and German honey (85.01 mg/100 g), whereas the lowest value was detected in Chinese chaste honey (1.28 mg/100 g). Among the analyzed honey samples, orange blossom showed the highest catechin content (161.81 mg/100 g) followed by Spanish eucalyptus honey (119.58 mg/100 g) and French polyfloral honey (118.74 mg/100 g). Vanillic acid was the major compound in Spanish eucalyptus honey and Pakistani Sider honey and Lychee honey showed the lowest value. Low concentration of gallic acid were detected in polyfloral honeys obtained from France and Germany but was not present in any other sample. The profile of phenolics of Sider honey obtained from Sudan and Pakistan were significantly different (Table S1). Caffeic acid and rutin were only detected in Sudanese Sider honey, whereas catechin and chrysin were only present in Pakistani Sider honey. The concentrations of phenolic compounds in both Sider honey samples varied from those reported in the literature [2,34,35].
The total amount of phenolic compounds measured in the analyzed honeys followed the order: H10 > H8 > H7 > H1 > H3 > H12 > H4 > H14 > H5 > H9 > H15 > H11 > H13 > H2 > H6. Interestingly, significant differences in phenolic compounds were observed among honey samples of the same botanical origin but of different geographical origins and different seasons [1,2]. Among the phenolic compounds analyzed, only p-hydroxybenzoic acid was identified in all honey samples examined; thus, this compound was selected for developing a prediction model. Table 2 shows the p-hydroxybenzoic acid in honey samples from different geographical origins. This variation could be attributed to the differences in geographical and botanical origins of honey (Table 1).
| Countries | Minimum | Maximum | Mean | SD | CV |
|---|---|---|---|---|---|
| China | 23.14 | 98.15 | 50.67 | 33.04 | 65.25 |
| Pakistan | 47.98 | 49.45 | 48.68 | 0.43 | 0.88 |
| Spain | 8.35 | 45.20 | 22.11 | 13.04 | 58.98 |
| Australian | 2.99 | 25.46 | 15.50 | 11.17 | 72.11 |
| Germany | 120.21 | 120.51 | 120.32 | 0.11 | 0.09 |
| France | 28.18 | 29.60 | 29.07 | 0.49 | 1.68 |
| Sudan | 40.98 | 88.98 | 65.18 | 20.29 | 31.14 |
| Cameroon | 22.15 | 23.25 | 22.63 | 0.40 | 1.77 |
SD, standard deviation; CV, Coefficient of variation; CV = [{SD/Mean} × 100].
p-Hydroxybenzoic acid (mg/100 g) in honey samples from different geographical origins
The descriptive data presented in Table 3 indicate that the categories of honey studied significantly vary in p-hydroxybenzoic acid content in the calibration and prediction sets. From Table 3, it is clear that the range of reference chemical data in the calibration set cover the range of prediction sets and there are no significant differences between their standard deviations. Thus, the distribution of the samples is convenient both in the calibration and in the prediction sets.
| Calibration set (N = 64) | Prediction set (N = 36) | |||||
|---|---|---|---|---|---|---|
| Range | Mean | SD | Range | Mean | SD | |
| p-Hydroxybenzoic acid (mg/100 g) | 2.99–120.51 | 41.92 | 33.06 | 9.10–120.32 | 40.12 | 30.15 |
SD, standard deviation.
Descriptive statistics for p-hydroxybenzoic acid content used for developing PLSR model
3.2. NIR, Raman and Data Fusion Approaches
The prediction of p-hydroxybenzoic acid content was performed using a PLS model in which p-hydroxybenzoic acid was predicted from full NIR spectra (1557 spectra) and selected region of Raman (1142 spectra). Table 3 indicates the parameters used to assess the performance of the established PLS model for prediction of p-hydroxybenzoic acid in the analyzed honey samples. Scatter plots of experimental against predicted values for NIR and Raman have been indicated in Figure 2. Although both techniques showed good prediction results, the PLS model using the Raman data as X outperformed NIR, as the first technique obtained higher R2 and RDP values than when NIR spectra were used as X. However, the use of R2 and RDP to validate whether the fit model is satisfactory may not be the most suitable method. There are other parameters that could be evaluated. RMSECV, RMSEP, and LVs can provide information about the robustness and the global error of the calibration and prediction models. Raman spectroscopy obtained lower RMSECV and RMSEP and a smaller number of LVs. This was expected as NIR provided a large number of spectra (1557), however, not all of them contained useful information. To improve the results obtained by the NIR technique and to combine the benefit of the synergistic effect of different sources of information, two data fusion strategies were adopted.
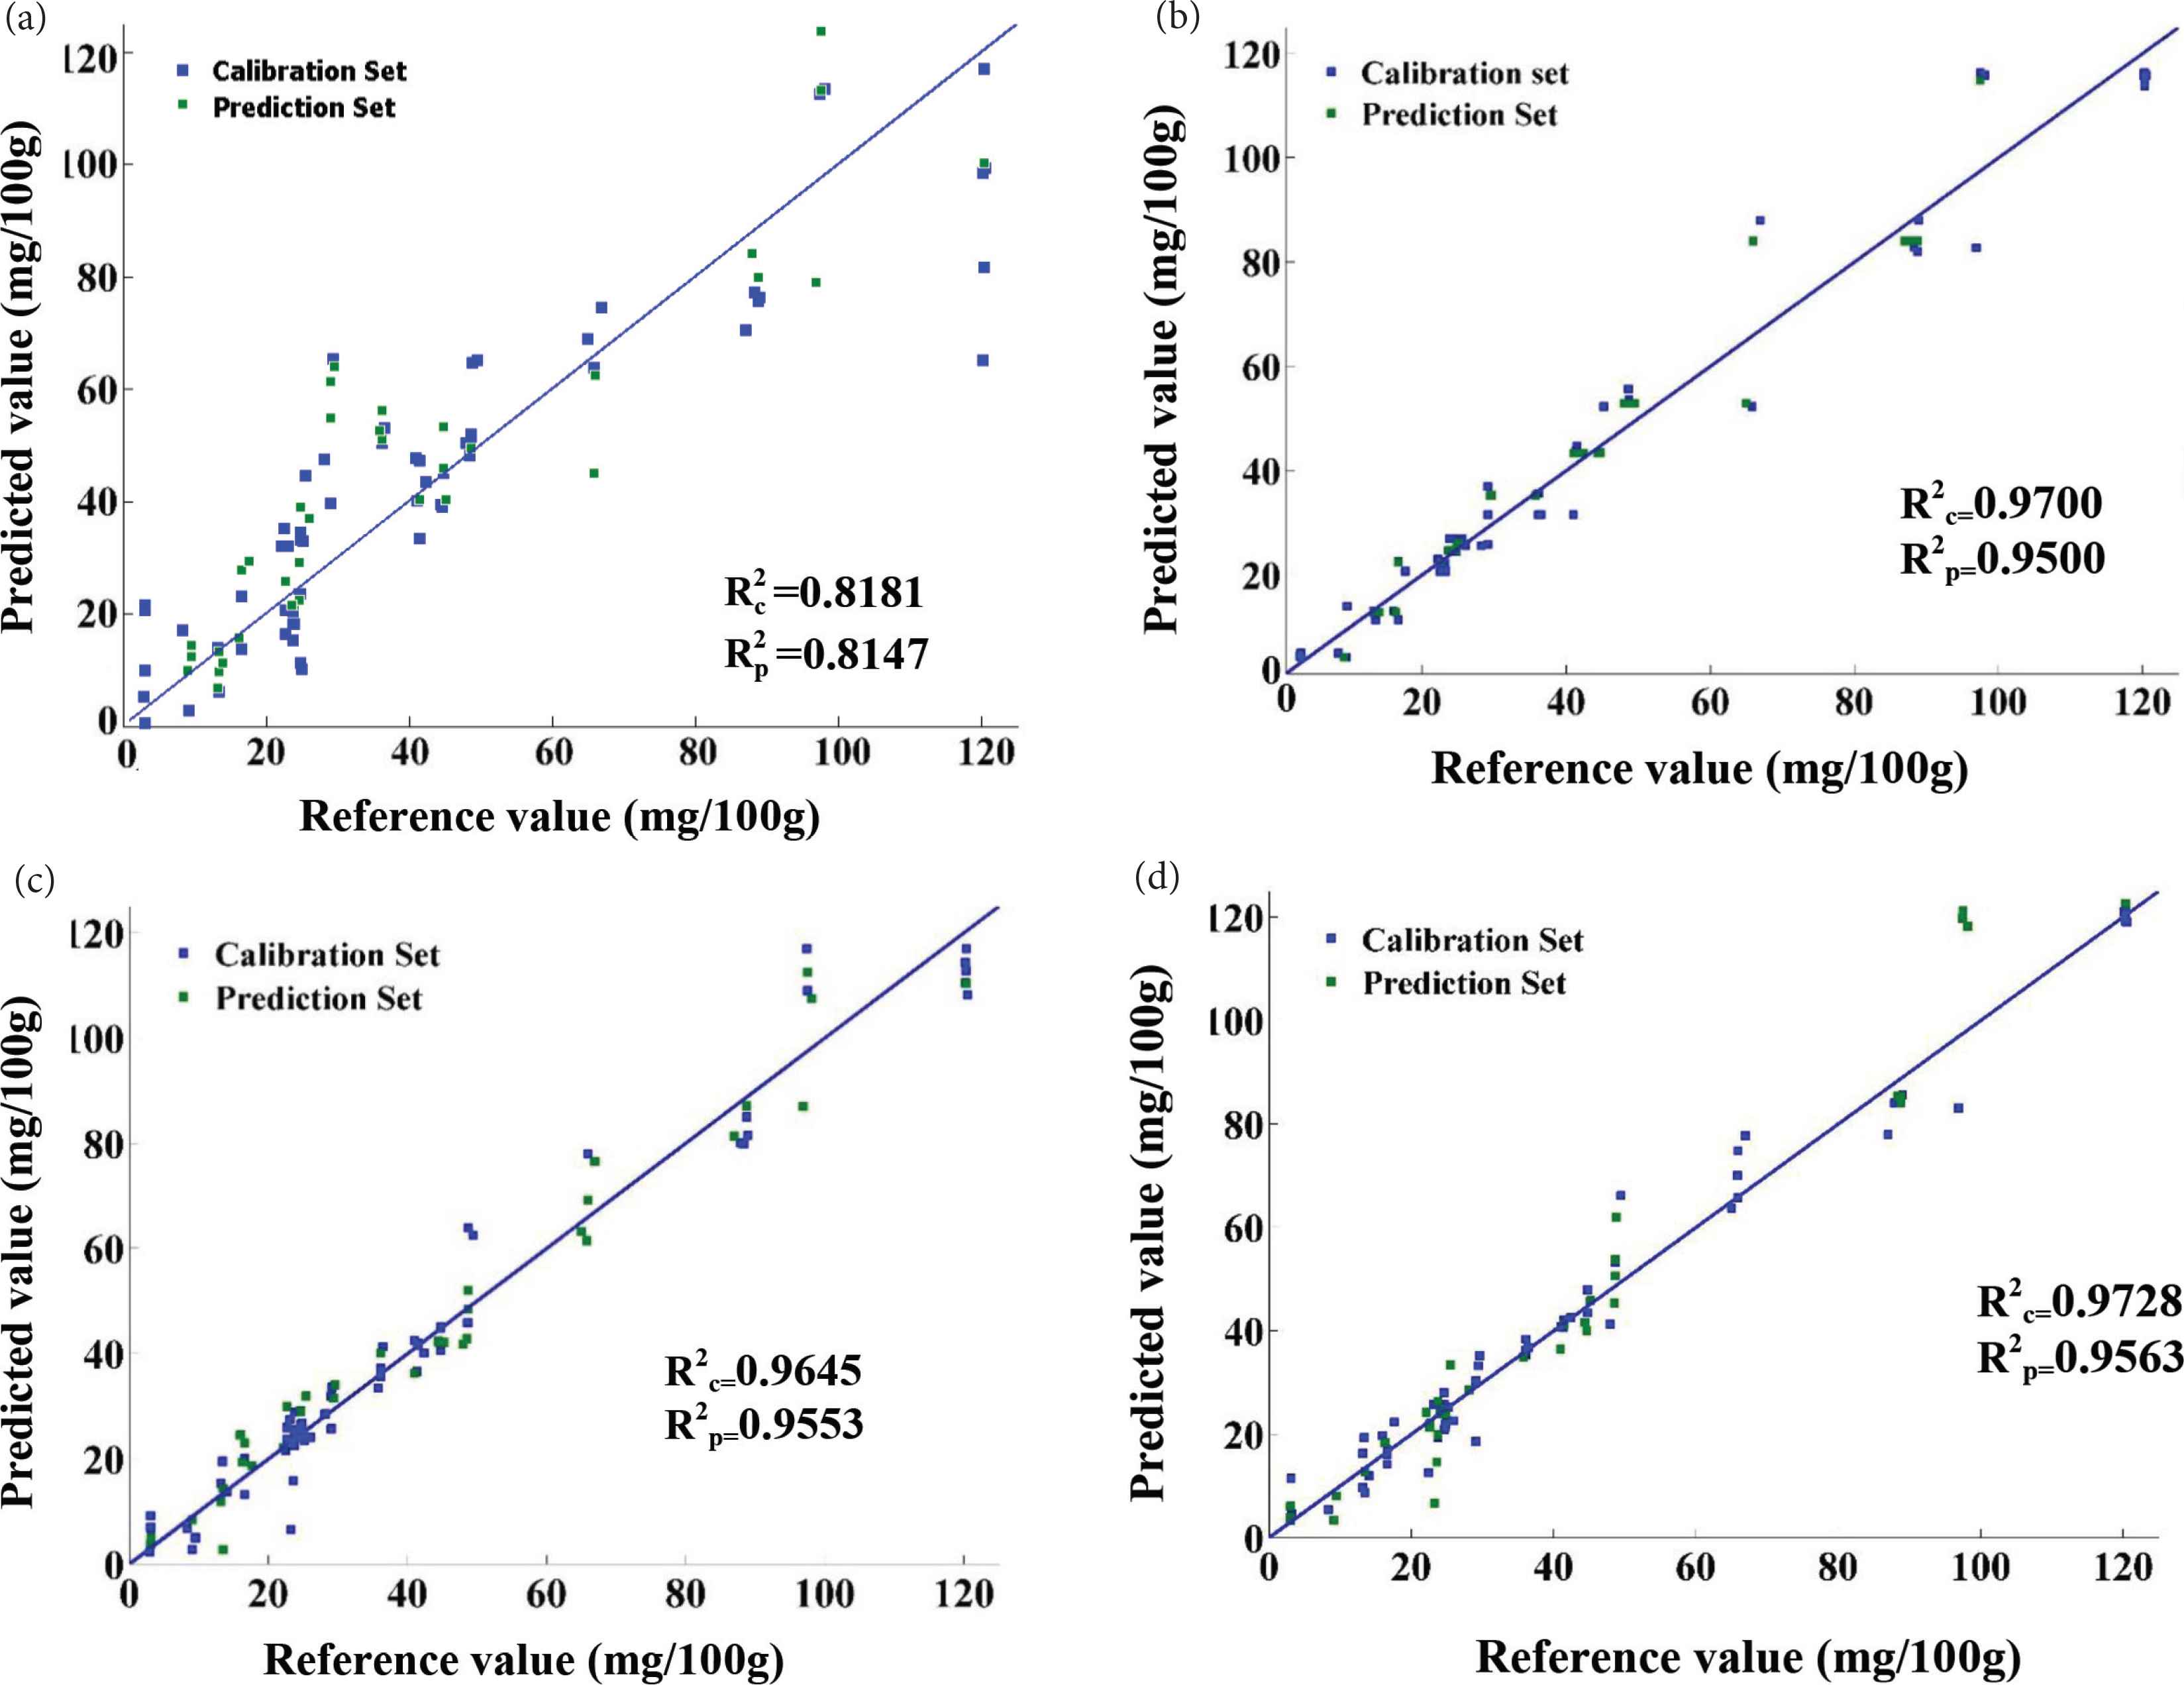
Correlation plots for the prediction of p-hydroxybenzoic acid using PLS based on the (a) NIR and (b) Raman combined with (c) low-level data fusion and (d) mid-level data fusion.
Data fusion approaches are now widely used for prediction of phenolic compounds in foods [2,12,36–38]. In this experiment, the PLS model based on data fusion was established. For combining NIR and Raman, the spectra were scaled using simple mean centering and variance scaling before integrating spectra to give alike weights to the data obtained from techniques of different features. Subsequently, the entire preprocessed NIR spectra and the selected Raman region merged in a single matrix had the number of columns equal to the number of honey samples and the number of rows equal to the total number of data (selected regions). The low-level data fusion substantiates the fact that it is beneficial to integrate NIR and Raman spectra, as the combined data model performed significantly better than PLS model based exclusively on NIR data (Figure 2). This could be due to the integration of the information from two technologies that could potentially provide comprehensive information and this can improve the results. In fact, it only makes sense to compare the result of low-level data fusion with the PLS models based on NIR spectra as Raman proved to be more adequate than low-level data fusion model and NIR based ones. Therefore, one is interested in investigating the effect of mid-level data fusion on the performance of the PLS model.
Table 4 presents the calibration and prediction results acquired using the two data sets. As already stated, the PLS model was developed using the most significant PC scores. Therefore, the original number of variables for NIR and Raman (2699) matrix was reduced to 20 PCs. As could be seen in Table 4, after applying data extraction and combination, in comparison with PLS model based on NIR, the model constructed for prediction of p-hydroxybenzoic acid based on mid-level data fusion delivered better results. Although low- and mid-level data fusion improves the PLS model based on NIR spectra, it does not improve PLS model based on Raman; indicating that PLS model based on the integrated information cannot effectively improve the prediction performance of PLS model based on the Raman spectra, not even after PC extraction, which was in agreement with the literature [39]. Table 4 shows that the result of mid-level data fusion is closely related to the low-level data fusion in terms of correlation coefficient values. However, a greater scattering of data for the mid-level data fusion was observed. This greater dispersion is in relation to RMSEP value as indicated in Table 4. The determination of coefficient R2 obtained for the NIR, Raman, and the two data fusion approaches together with the PLS model could be used as alternative quantitative method for determination of p-hydroxybenzoic acid in honey samples.
| Spectroscopic techniques | LVs | Calibration set (N = 64) | Prediction set (N = 36) | RDP | ||
|---|---|---|---|---|---|---|
|
|
RMSECV |
|
RMSEP | |||
| NIR | 10 | 0.8181 | 14.00 | 0.8147 | 13.80 | 2.18 |
| Raman | 3 | 0.9700 | 6.11 | 0.9500 | 6.83 | 4.41 |
| Low-level data fusion | 10 | 0.9645 | 6.08 | 0.9553 | 6.59 | 4.58 |
| Mid-level data fusion | 10 | 0.9728 | 5.31 | 0.9563 | 7.95 | 3.79 |
LVs, latent variables; RDP, the ratio of prediction to deviation [SD/RMSEP]; RMSECV, root mean squared error cross validation; RMSEP, root mean squared error of prediction.
Summary of PLS prediction results for p-hydroxybenzoic acid in honey using NIR and Raman spectroscopies
Finally, this present article is the continuation of our previous feasibility study on honey collected from Sudan [2]. We have tried to investigate the feasibility of generalization of similar studies in honey samples collected from different countries. Both studies have demonstrated the feasibility of detecting the single phenolic compound in honey; however, it was also a challenge to find predominant single compounds in honey from the different countries.
4. CONCLUSION
This study compared NIR, Raman, and the two data fusion approaches in the quantification determination of p-hydroxybenzoic acid in honey and all methodologies could be used for the prediction of single phenolic acid in honey. The RMSEP of low-level data fusion (6.59) was lower than that of mid-level data fusion (7.95) and
CONFLICTS OF INTEREST
The authors declare they have no conflicts of interest.
AUTHORS’ CONTRIBUTION
HET and MA performed some experiments. HET wrote the manuscript and obtained funding for the study. GKM helped in experiment design and discussion. JS contributed to discussion of the results. XZ designed and supervised the experiments. MAAG contributed in writing-revision. AAM contributed in data analysis.
ACKNOWLEDGMENTS
The authors gratefully acknowledge the financial support provided by the
SUPPLEMENTARY TABLE
| Codes | Phenolic compounds quantified (mg/100 g) | Total phenol | |||||||||||||||
|---|---|---|---|---|---|---|---|---|---|---|---|---|---|---|---|---|---|
| CAT | Catec | HydroxA | p-HydroxA | Rut | p-COUA | FA | Myr | Chry | QE | Kae | SA | VA | ChloA | GA | CA | ||
| H1 | 60.71 | 38.21 | 15.59 | 24.85 | 18.96 | 64.08 | 25.35 | 25.17 | 0.81 | 27.46 | 5.86 | n.d | n.d | n.d | n.d | n.d | 307.04d |
| H2 | n.d | n.d | n.d | 3.05 | n.d | n.d | n.d | n.d | n.d | n.d | n.d | 52.99 | 11.57 | n.d | n.d | n.d | 67.61n |
| H3 | n.d | 37.92 | n.d | 120.31 | 20.04 | 29.48 | n.d | n.d | n.d | n.d | 2.71 | 85.01 | n.d | n.d | 0.54 | n.d | 296.02e |
| H4 | 161.81 | n.d | n.d | 15.03 | 38.57 | n.d | n.d | n.d | n.d | n.d | n.d | n.d | 31.52 | 12.61 | n.d | 2.7018 | 262.23g |
| H5 | 119.58 | n.d | n.d | 44.76 | n.d | 8.43 | 0.78 | n.d | n.d | n.d | n.d | n.d | 44.22 | n.d | n.d | n.d | 217.78i |
| H6 | 4.25 | n.d | n.d | 9.10 | n.d | n.d | 0.81 | n.d | n.d | n.d | n.d | n.d | 23.57 | n.d | n.d | n.d | 37.72o |
| H7 | 98.13 | n.d | n.d | 65.91 | 37.51 | 2.69 | 172.96 | n.d | n.d | n.d | n.d | n.d | n.d | 22.82 | n.d | n.d | 400.02c |
| H8 | n.d | 78.79 | n.d | 88.33 | 41.10 | 45.37 | 75.32 | n.d | n.d | n.d | n.d | 24.75 | 9.88 | 57.30 | n.d | 10.97 | 431.79b |
| H9 | n.d | n.d | n.d | 41.45 | 39.86 | 29.24 | 2.75 | n.d | n.d | n.d | n.d | n.d | 2.94 | 61.55 | n.d | n.d | 177.78j |
| H10 | 25.24 | 78.29 | n.d | 48.67 | n.d | 4.15 | 75.67 | n.d | 68.33 | n.d | n.d | 66.51 | 70.19 | 17.56 | n.d | n.d | 454.62a |
| H11 | 7.41 | 76.42 | 11.60 | 23.76 | n.d | n.d | n.d | n.d | n.d | n.d | n.d | 1.28 | n.d | n.d | n.d | n.d | 120.46l |
| H12 | n.d | 76.66 | n.d | 36.13 | n.d | n.d | 154.33 | n.d | n.d | n.d | n.d | n.d | 0.29 | n.d | n.d | n.d | 267.41f |
| H13 | n.d | n.d | n.d | 97.46 | n.d | n.d | n.d | n.d | n.d | n.d | n.d | n.d | n.d | 11.46 | n.d | n.d | 108.92m |
| H14 | 118.74 | 38.39 | n.d | 29.08 | 19.40 | n.d | n.d | n.d | n.d | 15.20 | 0.49 | n.d | n.d | n.d | 0.59 | n.d | 221.90h |
| H15 | n.d | n.d | n.d | 22.64 | n.d | 24.43 | n.d | n.d | n.d | n.d | n.d | 110.06 | n.d | n.d | n.d | n.d | 157.12k |
n.d, not detected; CAT, catechin; Catec, catechol; HydroxA, hydroxycinnamic acid; p-HydroxA, p-hydroxybenzoic acid; Rut, rutin; p-COUA, p-coumaric acid; FA, ferulic acid; Myr, myricetin; Chry, chrysin; QE, quercetin; Kae, kaempferol; SA, syringic acid; VA, vanillic acid; ChloA, chlorogenic acid; GA, gallic acid; CA, caffeic acid.
The average of phenolic compounds identified in various honey samples
Footnotes
REFERENCES
Cite this article
TY  - JOUR
AU  - Haroon Elrasheid Tahir
AU  - Muhammad Arslan
AU  - Gustav Komla Mahunu
AU  - Jiyong Shi
AU  - Xiaobo Zou
AU  - Mohammed Abdalbasit Ahmed Gasmalla
AU  - Abdalbasit Adam Mariod
PY  - 2019
DA  - 2019/11/02
TI  - Data Fusion Approach Improves the Prediction of Single Phenolic Compounds in Honey: A Study of NIR and Raman Spectroscopies
JO  - eFood
SP  - 173
EP  - 180
VL  - 1
IS  - 2
SN  - 2666-3066
UR  - https://doi.org/10.2991/efood.k.191018.001
DO  - 10.2991/efood.k.191018.001
ID  - Tahir2019
ER  -