
Comprehensive Polyphenolic Profile of Plantago depressa using High-Speed Countercurrent Chromatography Off-line with High-Performance Liquid Chromatography–Diode Array Detector–Quadrupole Time-of-flight Tandem Mass Spectrometry
- DOI
- 10.2991/efood.k.191101.001How to use a DOI?
- Keywords
- Plantago depressa; polyphenol; high-speed countercurrent chromatography; high-performance liquid chromatography; tandem mass spectrometry
- Abstract
The whole plant of Plantago depressa is commonly used as traditional Chinese medicine and functional food ingredient. Total phenolic content and total flavonoid content evaluation indicated that its ethyl acetate and n-butanol fractions were rich in polyphenols. However, to date, the polyphenolic profile is limited because of the complex matrix. Here, polyphenols in ethyl acetate and n-butanol fractions of P. depressa were first separated and enriched by High-Speed Countercurrent Chromatography (HSCCC). Then, their structures were characterized or tentatively identified by High-Performance Liquid Chromatography (HPLC)–Diode Array Detector (DAD)–Quadrupole Time-of-Flight Tandem Mass Spectrometry (QTOF-MS/MS) (HSCCC × HPLC–DAD–QTOF-MS/MS). Because of the orthogonality of HSCCC and HPLC, 37 polyphenols were identified. Notably, 29 polyphenols were discovered from P. depressa for the first time. Finally, contents of two potential new compounds, 2-ethoxy plantamajoside isomers (17 and 29), were determined as 0.27 ± 0.03 and 0.04 ± 0.01 mg/g, respectively. Results indicated that P. depressa could be used as a promising source of polyphenols for health promotion, and the developed method (HSCCC × HPLC) was efficient to explore polyphenolic profile for complex natural products.
- Copyright
- © 2019 International Association of Dietetic Nutrition and Safety. Publishing services by Atlantis Press International B.V.
- Open Access
- This is an open access article distributed under the CC BY-NC 4.0 license (http://creativecommons.org/licenses/by-nc/4.0/).
1. INTRODUCTION
Polyphenols are a group of important and abundant phytochemicals in plants, fruits, and vegetables. To date, more than 8000 polyphenols have been separated and identified, the main class of which are flavonoids, stilbenes, lignans, curcuminoids, tannins, phenolic acids, and simple phenols [1]. Polyphenols contribute not only to color, aroma, and taste but also to many health-promoting properties, such as antioxidant [2], antitumor [3], antiangiogenic [4], antimicrobial [5], and anti-inflammatory [6] agents. Hence, considerable attentions have been recently focused on exploiting plants, fruits, or vegetables rich in polyphenols for the development of functional foods, nutraceuticals, or medicines.
Plantaginis (Plantago genus, Plantaginaceae family) is folk medicines and foods commonly used in most Asian countries for centuries with the properties of antipyretic, diuretic, and expectorant [7]. In China, commercially and officially available plantaginis consists of the whole plants (known as Cheqian Cao) and seeds (known as Cheqian Zi) of Plantago asiatica and Plantago depressa [8]. Fresh leaves of Cheqian Cao are used in fresh salads and soups. Modern pharmaceutical studies reveal that plantaginis has antioxidant, anti-inflammatory, antidiabetes, and anti-hyperuricemic properties [9–11]. And phytochemical investigations report the existence of polyphenols in plantaginis, such as flavonoids, phenylethanoid glycosides, and organic acids [12]. However, to date, only few reports have reported the isolation and identification of polyphenols in P. depressa, resulting in the identification of nine flavonoids, 17 phenylethanoid glycosides, and 14 organic acids [7,10,12,13]. Most of them were investigated by repeated column fractionation and purification procedures. High-Performance Liquid Chromatography–Diode Array Detector–Tandem Mass Spectrometry (HPLC–DAD–MS/MS) is now a frequently used technology for rapid identification of biochemicals in complex natural products [14,15]. And to our best knowledge, only two reports developed HPLC–DAD–MS/MS to analyze biochemicals in the seeds of P. depressa [7,10]. Zhou et al. [10] found the existence of three flavonoids and three phenylethanoid glycosides. Wang et al. [7] identified six flavonoids and seven phenylethanoid glycosides. However, no related work focused on the development of HPLC–DAD–MS/MS to systematically analyze polyphenols in the whole plant of P. depressa.
Natural products always contain major and minor polyphenols with different structures and polarities. Actually, it is difficult to comprehensively identify compounds only by HPLC–DAD–MS/MS from complex natural products due to the limitations of separation resolution and detection sensitivity [16]. Therefore, two-dimensional technologies, such as HPLC × HPLC [16], preparative HPLC × HPLC [17], and High-Speed Countercurrent Chromatography (HSCCC) × HPLC [18], with orthogonality were developed. HSCCC, a support-free liquid–liquid partition chromatography, exhibits large load capacity and high recovery and eliminates irreversible adsorption and denaturation of sample by comparison with the solid supports. It has been considered as a powerful preparative method to separate and enrich polyphenols [19]. Therefore, HSCCC × HPLC has outstanding advantages for comprehensive profiling of polyphenols, especially for minors. Leitão et al. [18] developed HSCCC × HPLC to identify 12 minor flavonoids in Lippia origanoides. Gao et al. [19] established HSCCC × HPLC to find 15 flavonoids, including four minors coeluting with majors in HPLC analysis, from ethyl acetate fraction of vine tea. Rodríguez-Rivera et al. [20] designed HSCCC to separate major polyphenols and enrich minor polyphenols in the peels of Citrus limetta, and then, the structure of 85 polyphenols were identified by HPLC–MS/MS.
Thus, in this work, HSCCC × HPLC method was developed to comprehensively identify polyphenols in the whole plant of P. depressa for the first time. Making full use of the orthogonality of HSCCC and HPLC and the preparative characteristic of HSCCC, polyphenols, especially for minors being coeluted with major ones, can be efficiently identified. The developed method is significant for comprehensive analysis of bioactive components in complex natural products matrix. Moreover, the chemical profiling results are beneficial for pharmacological activities elucidation and related functional products development.
2. MATERIALS AND METHODS
2.1. Chemicals and Reagents
Ethanol (98%), petroleum ether, ethyl acetate, n-butanol, Na2CO3, NaNO2, Al(NO3)3, and NaOH, used for extraction, separation, Total Phenolic Content (TPC), and Total Flavonoid Content (TFC) determination, were of analytical grade and purchased from Chemical Reagent Factory of Hunan Normal University (Hunan, China). Methanol and acetic acid used for HPLC and MS were of chromatographic grade (Sinopharm Chemical Reagent Co., Ltd., Shanghai, China). Folin–Ciocalteu Reagent (FCR) was obtained from Sigma Chemical Co. (St. Louis, MO, USA). Ultrapure water (18.2 MΩ) was prepared by a Milli-Q water purification system (Millipore, Bedford, MA, USA). Standards, 3-O-caffeoylquinic acid, caffeic acid, ferulic acid, 3,4-dihydroxybenzoic acid, salicylic acid, p-hydroxybenzoic acid, vanillic acid, gallic acid, syringic acid, luteolin, quercetin, apigenin, 6-hydroxyapigenin-7-O-glucoside, luteolin-7-O-glucoside, apigenin-7-O-glucoside, acteoside, isoacteoside, plantamajoside, forsythiaside, calceolarioside A, calceolarioside B, martynoside, and 2,3,5,4′-tetrahydroxystilbene-2-O-glucoside with purities more than 98% were brought from the National Institute for the Control of Pharmaceutical and Biological Products (Beijing, China).
2.2. Sample Preparation
The whole plant of P. depressa was collected in June 2016 from Yongzhou (111°36′25.17″E, 26°25′26.25″N), Hunan, China. After collection, the whole plant of P. depressa was immediately dried at 40°C in an oven with air circulation (moisture content, 70%). The dried plant was transferred to the laboratory and stored at −20°C for further experiments. Plant material was authenticated according to the China Pharmacopoeia Committee [8] by Prof. Zhaoming Xie, Research Institute of Chinese Medicine, Hunan Academy of Chinese Medicine, Changsha, China.
About 200 g of dried and powdered P. depressa was decocted by 60% (v/v) ethanol (1.0 L) at 60°C three times (each for 1.5 h). The filtrates were combined and concentrated to dryness under vacuum by rotary evaporation at 50°C to obtain 14.69 g of crude extract. Then, 12.00 g of crude extract was dissolved in water and transferred to liquid–liquid fraction using petroleum ether, ethyl acetate, and n-butanol with increasing polarities. Finally, petroleum ether (0.51 g), ethyl acetate (0.90 g), and n-butanol (1.49 g) fractions were obtained, respectively. The dried extracts and fractions were stored at 4°C for further experiments [21].
2.3. Determination of TPC and TFC
A modified Folin–Ciocalteu method was used to estimate TPC [22]. Sample (1.0 mL, 200 μg/mL) was added to FCR (10 mL/100 mL, 1.0 mL) and then Na2CO3 solution (10.0%, m/m, 1.0 mL) was added for neutralization after the mixtures have reacted at room temperature for 6 min. The absorbance was measured at 765 nm using an UV-2600 spectrometer (Shimadzu, Tokyo, Japan) after incubation at 37°C for 2 h. Different concentrations (5.0–25.0 μg/mL) of gallic acid solutions were selected to made calibration curve under the same procedures, and TPC was calculated and expressed as milligram of gallic acid equivalents per gram of dry weight sample (mg GAE/g DW).
Total flavonoid content was determined by NaNO2–Al(NO3)3 colorimetric method [19]. First, sample (1.0 mg/mL, 0.4 mL), ethanol (30.0%, v/v, 0.4 mL), and NaNO2 (4.0%, m/m, 0.4 mL) solution were mixed at room temperature for 5 min. Then, Al(NO3)3 solution (9.0%, m/m, 0.4 mL) and NaOH solution (1.6 moL/L, 2.0 mL) were added, respectively. After incubation for 10 min at 37°C, the absorbance of reaction mixture was measured at 510 nm. Different concentrations (0.2–1.0 mg/mL) of quercetin solutions were selected to made calibration curve under the same procedures, and TFC was expressed as milligram of quercetin equivalents per gram of dry weight sample (mg QE/g DW).
2.4. HPLC–DAD–QTOF-MS/MS Analysis
Agilent 1260 series HPLC system (Agilent Technologies, Santa Clara, CA, USA), equipped with an online vacuum degasser, a QuatPump, an automated injection valve, a thermostated column compartment, a DAD, and an Agilent ChemStation software, was applied for HPLC analysis. Sample was filtered through a 0.22-μm membrane before HPLC analysis. A SunFire™ C18 (250 × 4.6 mm i.d., 5 μm; Waters, MA, USA) column in tandem with a Phenomenex C18 guard cartridge (4.0 × 3.0 mm; Phenomenex, Torrance, CA, USA) was used for separation. The mobile phase was composed of A [0.4% (v/v) acetic acid in water] and B (methanol) with a gradient elution: 0–5 min, 35% B; 5–40 min, 35–75% B. The flow rate of mobile phase was set at 0.8 mL/min while the column temperature was maintained at 25°C. Sample injection volume was 20 μL and ultraviolet (UV) spectra were recorded from 190 to 400 nm (peak width 0.2 min and data rate 1.25/s). The chromatogram was acquired at 254 nm.
An Agilent 6530 Accurate–Mass QTOF LC/MS system was coupled with HPLC through an Agilent Jet Stream electrospray interface. MS data were collected by positive and negative ion modes and recorded with the range m/z 100–1000 with acquisition rate of 1.03 spectra/s. The optimized parameters were set as follows: nitrogen as dry gas with temperature at 320°C and flow rate at 10.0 L/min, and sheath gas with temperature at 320°C and flow rate at 11 L/min; pressure of nebulizer, 35 psi; capillary voltage, 3500 V; skimmer, 60 V; OCT 1 RF Vpp, 750 V; fragmentor voltage, 175 V. The mass axis was calibrated using mixtures provided by manufacturer.
2.5. HSCCC Separation
A model TBE-300B HSCCC (Shanghai Tauto Biotechnique Co. Ltd., Shanghai, China) was used for preparative HSCCC. The apparatus was equipped with three multilayered coils connected in series (diameter of tube 1.6 mm, total capacity 260 mL) and a 20-mL manual sample loop. Moreover, HSCCC system was composed of a TBP-1002 pump, a TBD-2000 UV detector to monitor effluents at 254 nm, and an HX-1050 constant temperature regulator (Beijing Boyikang Laboratory Implement Co. Ltd., Beijing, China). A WH V4.0 workstation was used to record chromatogram (Shanghai Wuhao Information Technology Co. Ltd., Shanghai, China). When operation, HSCCC column was first filled with the upper stationary phase with a flow rate of 20 mL/min; subsequently, lower mobile phase was pumped into the inlet of the column at the flow rate of 1.5 mL/min with the apparatus running at an optimal speed of 845 rpm. After hydrodynamic equilibrium, sample solution was injected for preparation separation.
A series of solvent systems composed of petroleum ether–ethyl acetate–methanol–water or ethyl acetate–n-butanol–water were prepared. Ethyl acetate/n-butanol fraction (0.5 mg) was added into corresponding pre-equilibrated two-phase solvent system (1.0 mL). After vigorously shaking and thorough equilibrium, 20 μL of upper phase and lower phase were analyzed by HPLC. K-values of compounds in ethyl acetate/n-butanol fraction could be defined as K = Aupper/Alower, where Aupper and Alower were the HPLC peak area of target compound in the upper and lower phases.
Two solvent systems composed of petroleum ether–ethyl acetate–methanol–water (1:10:1:10, v/v/v/v) (0–380 min) and (1:10:4:7, v/v/v/v) (380–670 min) were selected for HSCCC separation of ethyl acetate fraction of P. depressa (198.0 mg) in gradient mode. Solvent system composed of ethyl acetate–n-butanol–water (4:1:5, v/v/v) was optimized for HSCCC separation of n-butanol fraction of P. depressa (187.0 mg) in isometric mode. HSCCC peaks were collected and analyzed by HPLC–DAD–QTOF-MS/MS.
3. RESULTS AND DISCUSSION
3.1. Determination of TPC and TFC
Plantago depressa is a traditional folk medicine and food, widely distributed in Yongzhou, Hunan, China. Phenolic compounds of natural products are regarded as the most important bioactive compounds. TPC and TFC have high positive correlation to their bioactive activities [22,23]. Results shown in Table 1 indicated that n-butanol fraction (TPC, 16.5 mg GAE/g DW; TFC 2.0 mg QE/g DW) and ethyl acetate fraction (TPC, 5.0 mg GAE/g DW; TFC, 0.7 mg QE/g DW) contained higher values of TPC and TFC than crude extract (TPC, 1.7 mg GAE/g DW; TFC 0.3 mg QE/g DW) and petroleum ether fraction (TPC, 0.04 mg GAE/g DW; TFC, 0.02 QE/g DW). The results indicated that ethyl acetate and n-butanol fractions of P. depressa were rich of polyphenols and needed for further investigation.
| Sample | TFC (mg QE/g DW) | TPC (mg GAE/g DW) |
|---|---|---|
| Crude extract | 0.3 ± 0.03 | 1.7 ± 0.02 |
| Petroleum ether fraction | 0.02 ± 0.01 | 0.04 ± 0.01 |
| Ethyl acetate fraction | 0.7 ± 0.04 | 5.0 ± 0.2 |
| n-Butanol fraction | 2.0 ± 0.2 | 16.5 ± 0.6 |
TPC and TFC of crude extract and different fractions of Plantago deprassa (n = 3)
3.2. HPLC–DAD–QTOF-MS/MS Analysis
Both positive and negative ion modes were applied to obtain appropriate ionization of polyphenols in electrospray ionization-MS/MS (ESI-MS/MS) analysis. Compared with positive ion mode, negative ion mode had cleaner parent/fragment ion signals, high sensitivity, better resolution, and lower background noise. Figure 1A showed the chromatogram of ethyl acetate fraction and n-butanol fraction of P. depressa. The kind of polyphenols in ethyl acetate fraction and n-butanol fraction were greatly different. However, because of the coelution and matrix interference, some HPLC peaks contained more than one compound. Therefore, it was difficult to accurately achieved UV and MS data of minors only by HPLC–DAD–QTOF-MS/MS analysis. As shown in Figure 1B, only eight compounds (11, 15, 18, 20, 22, 23, 27, and 31) could present clear MS and MS/MS spectra and be identified directly by HPLC–DAD–QTOF-MS/MS. Therefore, it was inevitable to separate and enrich minors and coeluted compounds.
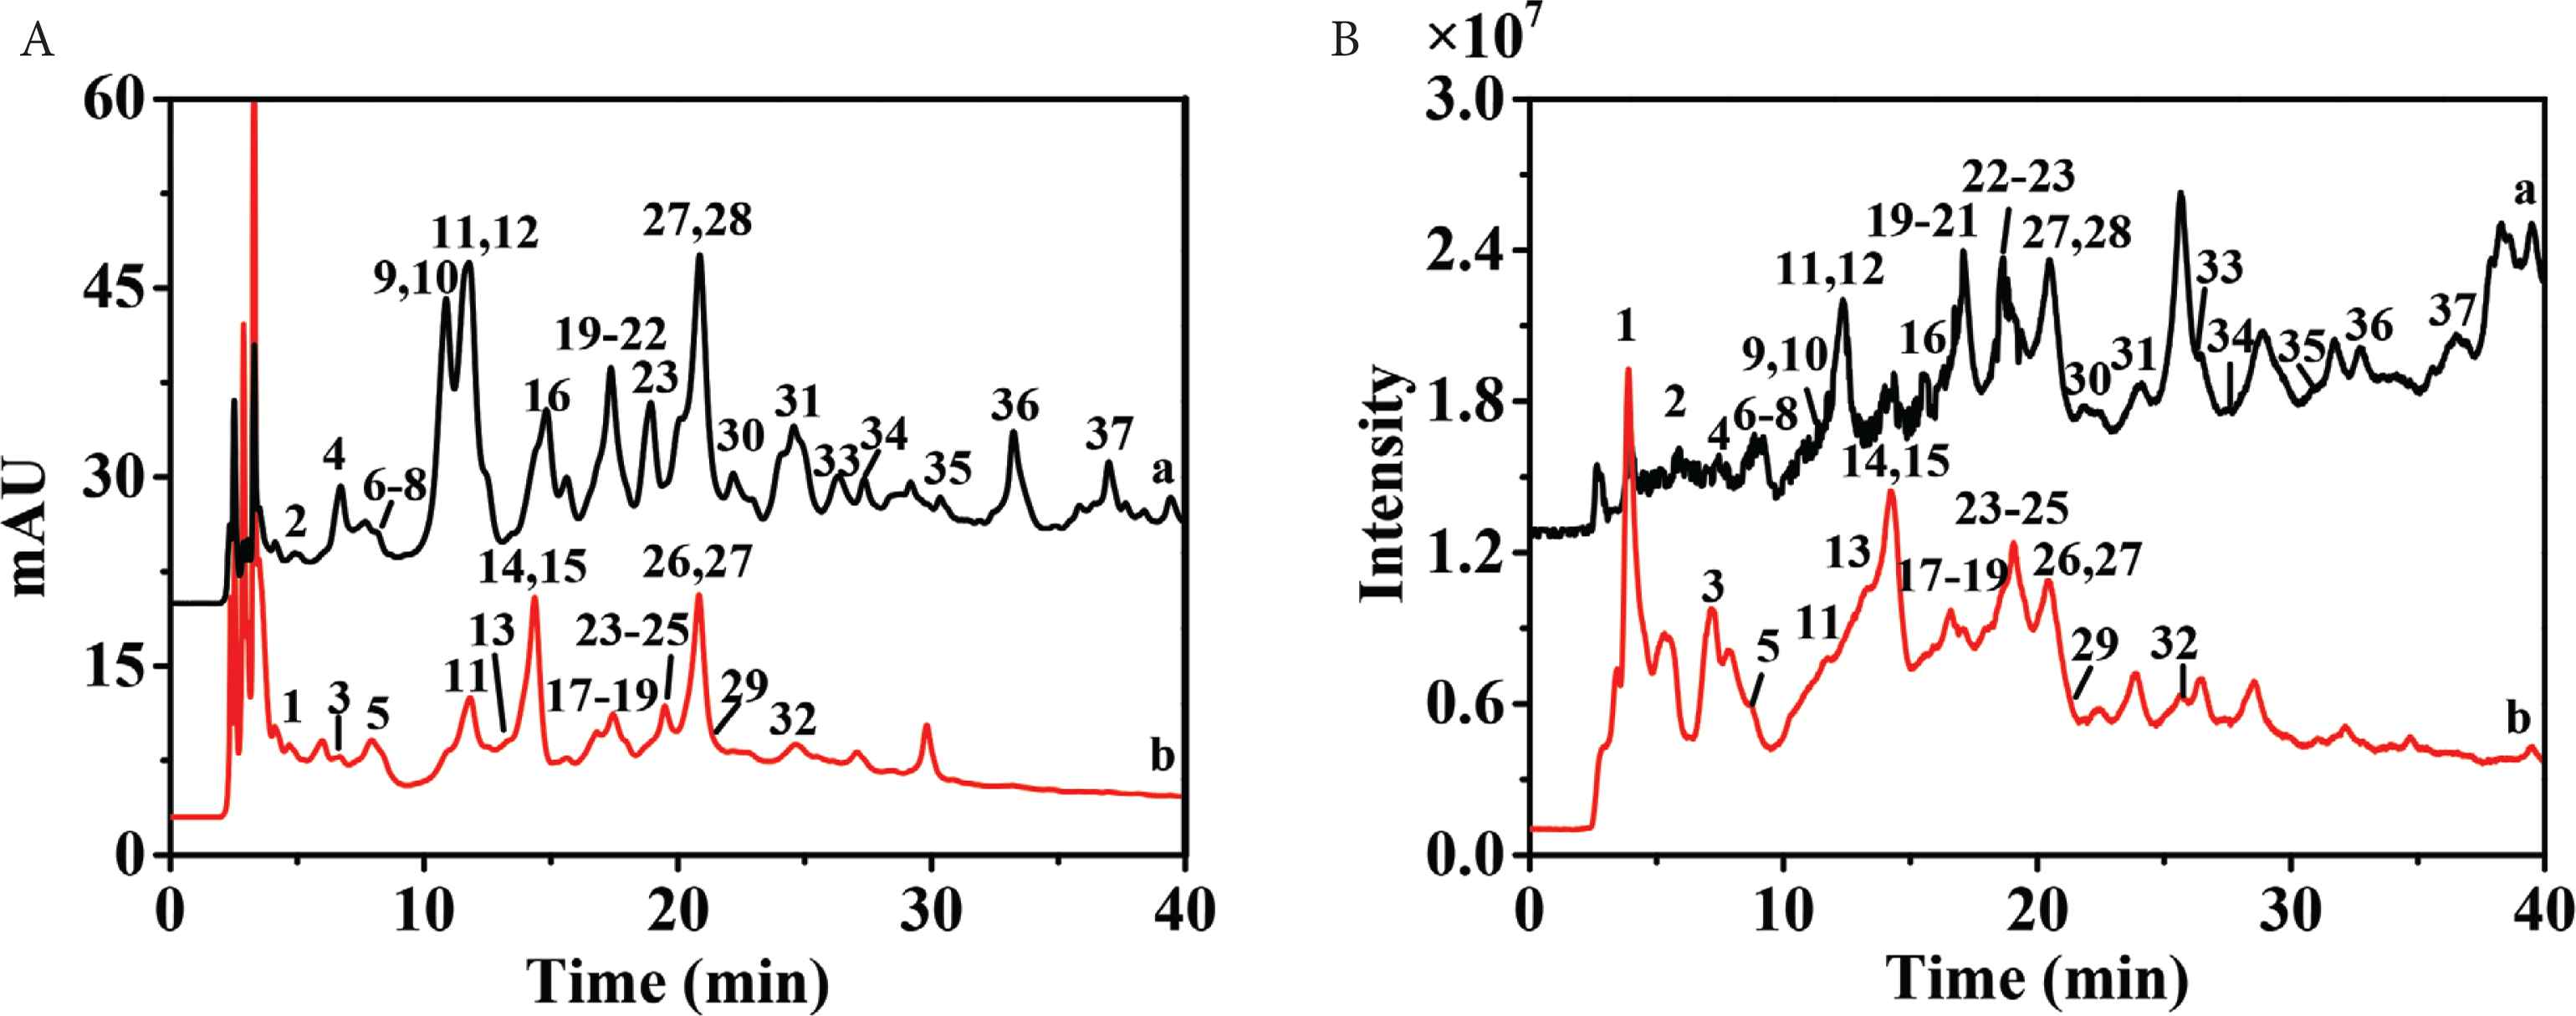
High-performance liquid chromatography (HPLC) chromatograms (A) and mass spectrometry (MS) chromatograms in negative ion mode (B) of ethyl acetate fraction (a) and n-butanol fraction (b). Peaks 1–37 corresponded to polyphenols 1–37, respectively.
3.3. Comprehensive HSCCC × HPLC Isolation
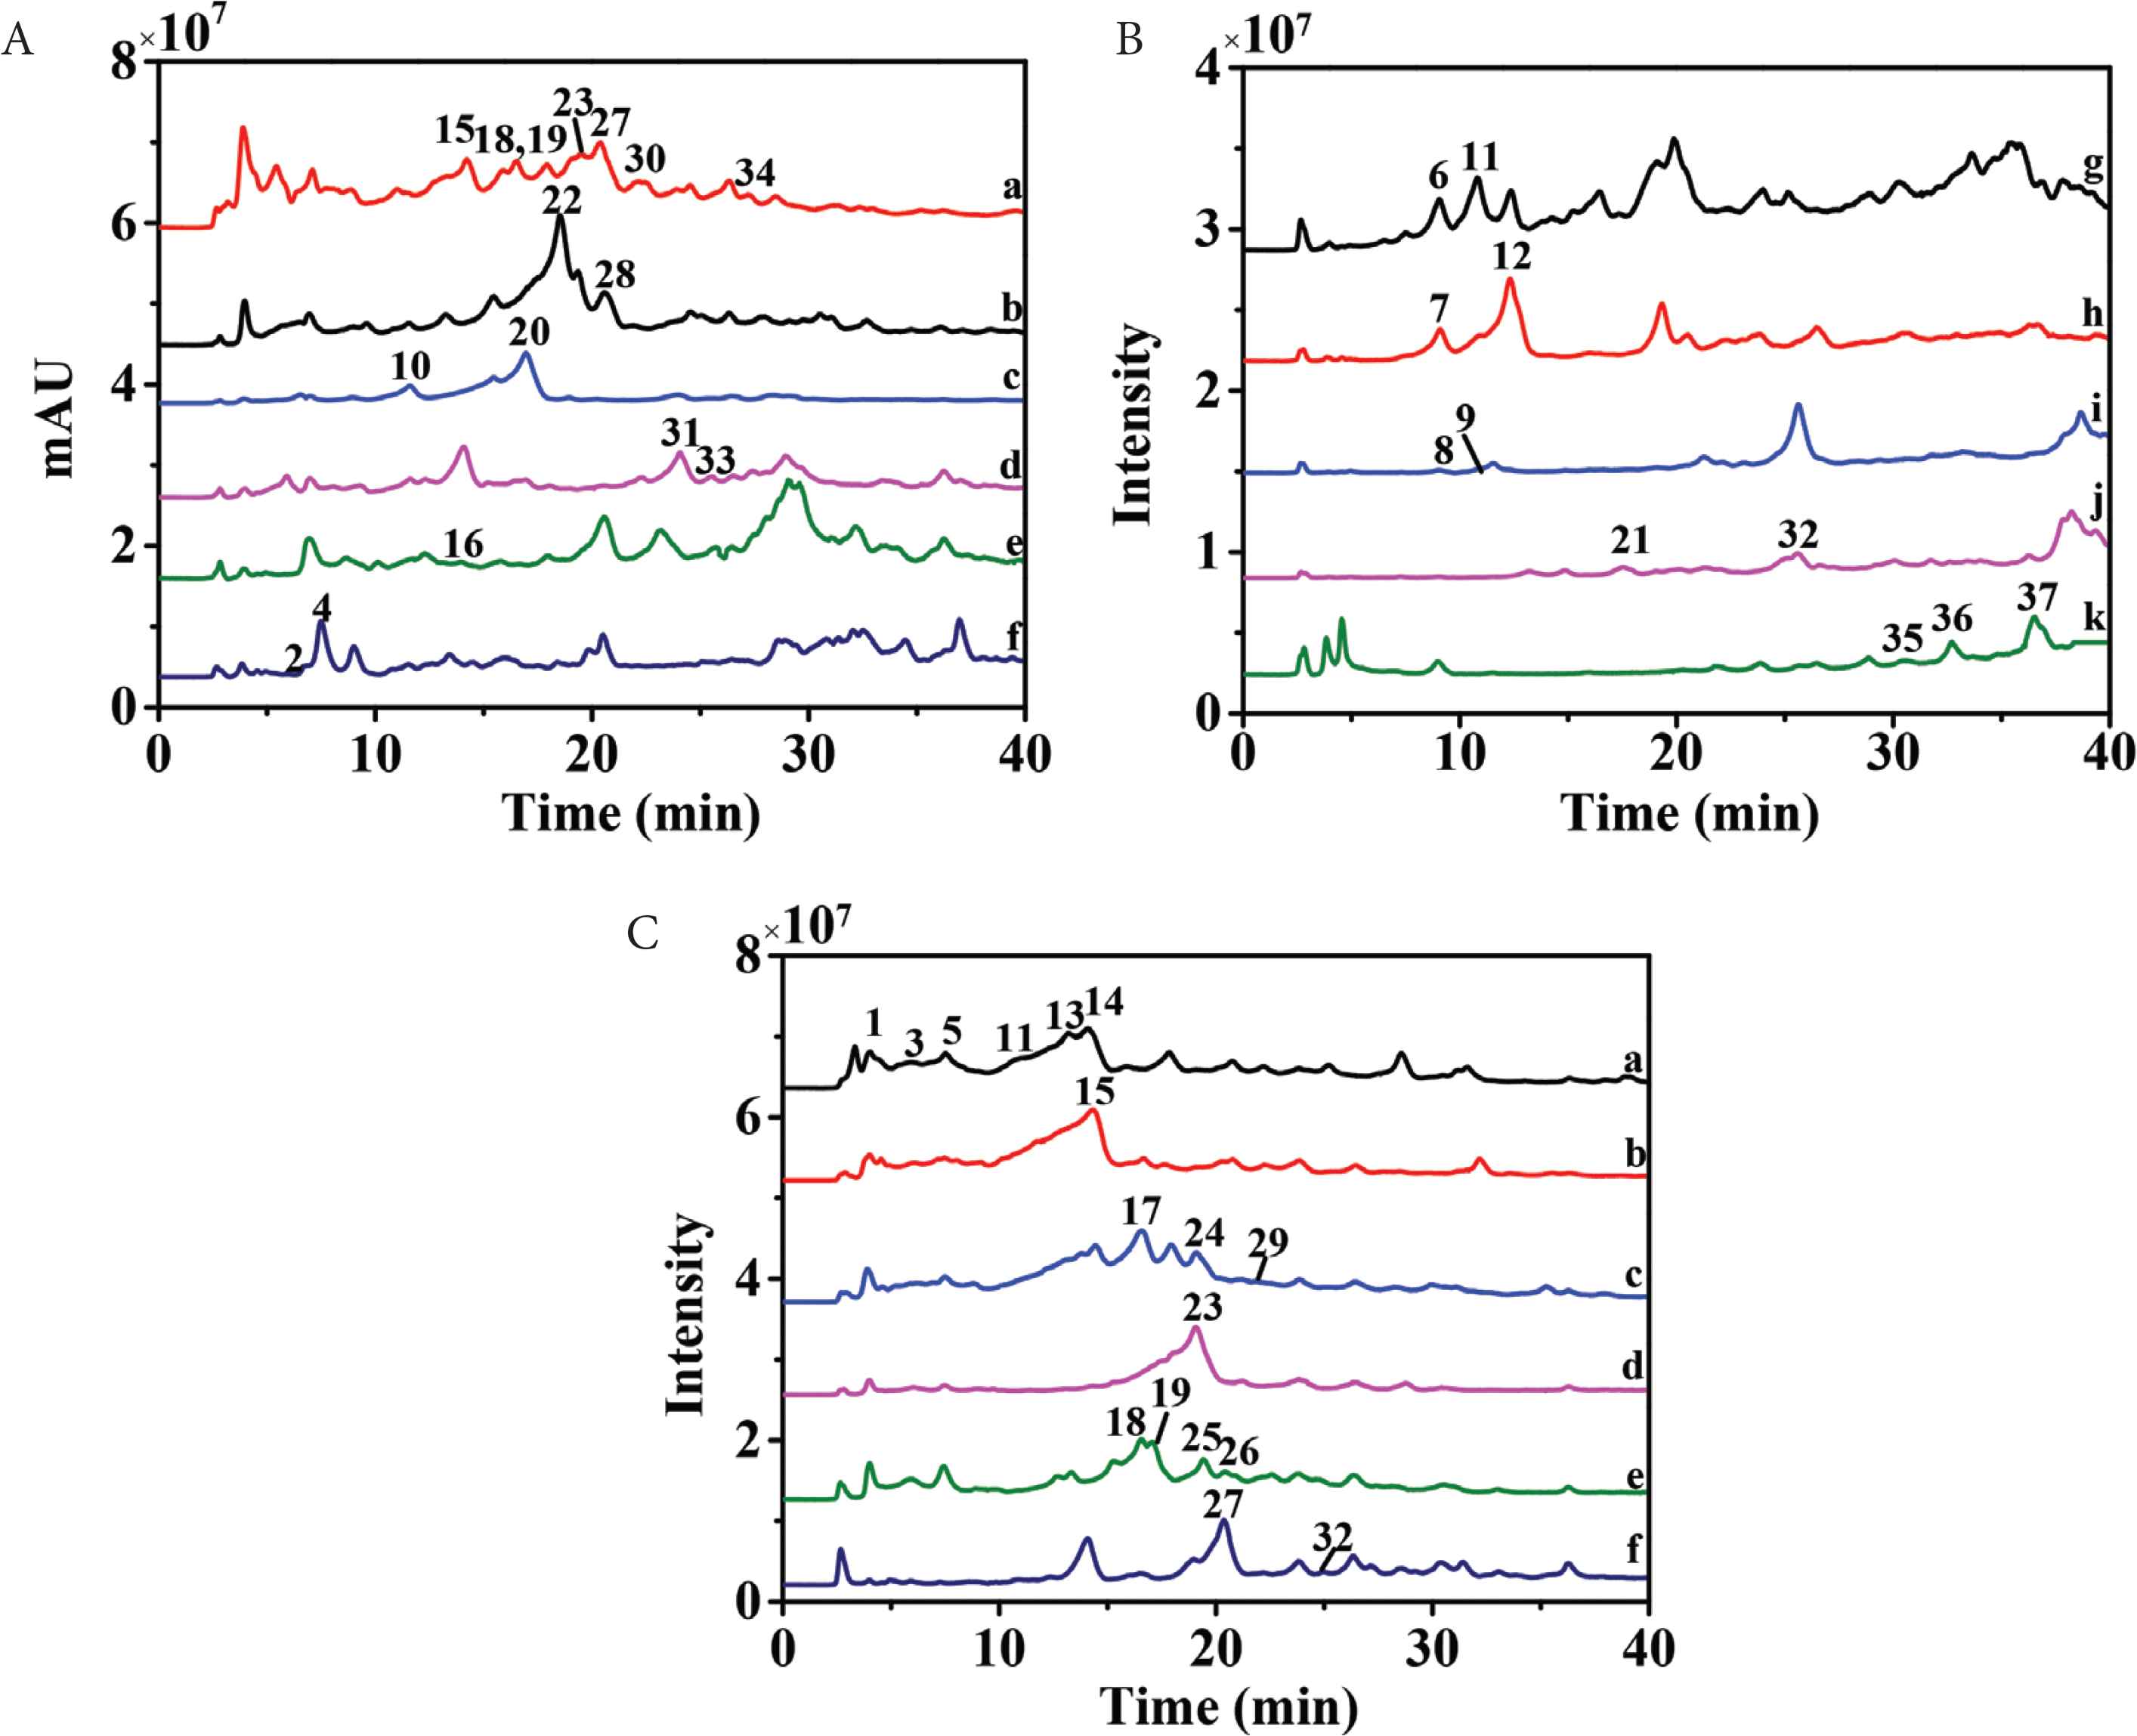
High-speed countercurrent chromatography, a liquid–liquid partition chromatography, could avoid extensive tailing and irreversible adsorption for polyphenols by comparison with traditional solid supports. Therefore, HSCCC was selected as the most important separation technique for polyphenols [24,25]. Petroleum ether–ethyl acetate–methanol–water solvent system with broad range of polarities was widely used in purification of components in ethyl acetate fraction. Since n-butanol fraction contained components with higher polarities, ethyl acetate–n-butanol–water solvent system was more suitable. As the ethyl acetate fraction and n-butanol fraction were very complex (Figure 1), only several compounds with higher HPLC peaks and wider polarities (i.e., 9, 11, 14, 16, 18, 24, 27, and 34) were selected to calculate K values. So, 1 ≤ K ≤ 4.0 in “test tube” experiments resulted in higher peak resolution [26]. As shown in Tables S1 and S2, stepwise solvent systems consisting of petroleum ether–ethyl acetate–methanol–water (1:10:1:10, v/v/v/v) and (1:10:4:7, v/v/v/v) could be selected for separation of ethyl acetate fraction, while ethyl acetate–n-butanol–water (4:1:5, v/v/v) was chosen for separation of n-butanol fraction. As a result, 11 HSCCC fractions of ethyl acetate fraction (fr. a–j and solid-phase fraction) (Figure 2A) and six HSCCC fractions of n-butanol fractions (fr. a–f) (Figure 3A) were obtained at high resolution. Each fraction was then analyzed by HPLC–DAD–QTOF-MS/MS (Figures 2B, 2C, 3B, S1). Because of the orthogonality between HSCCC and HPLC, coeluted compounds and minors were separated and enriched for identification.
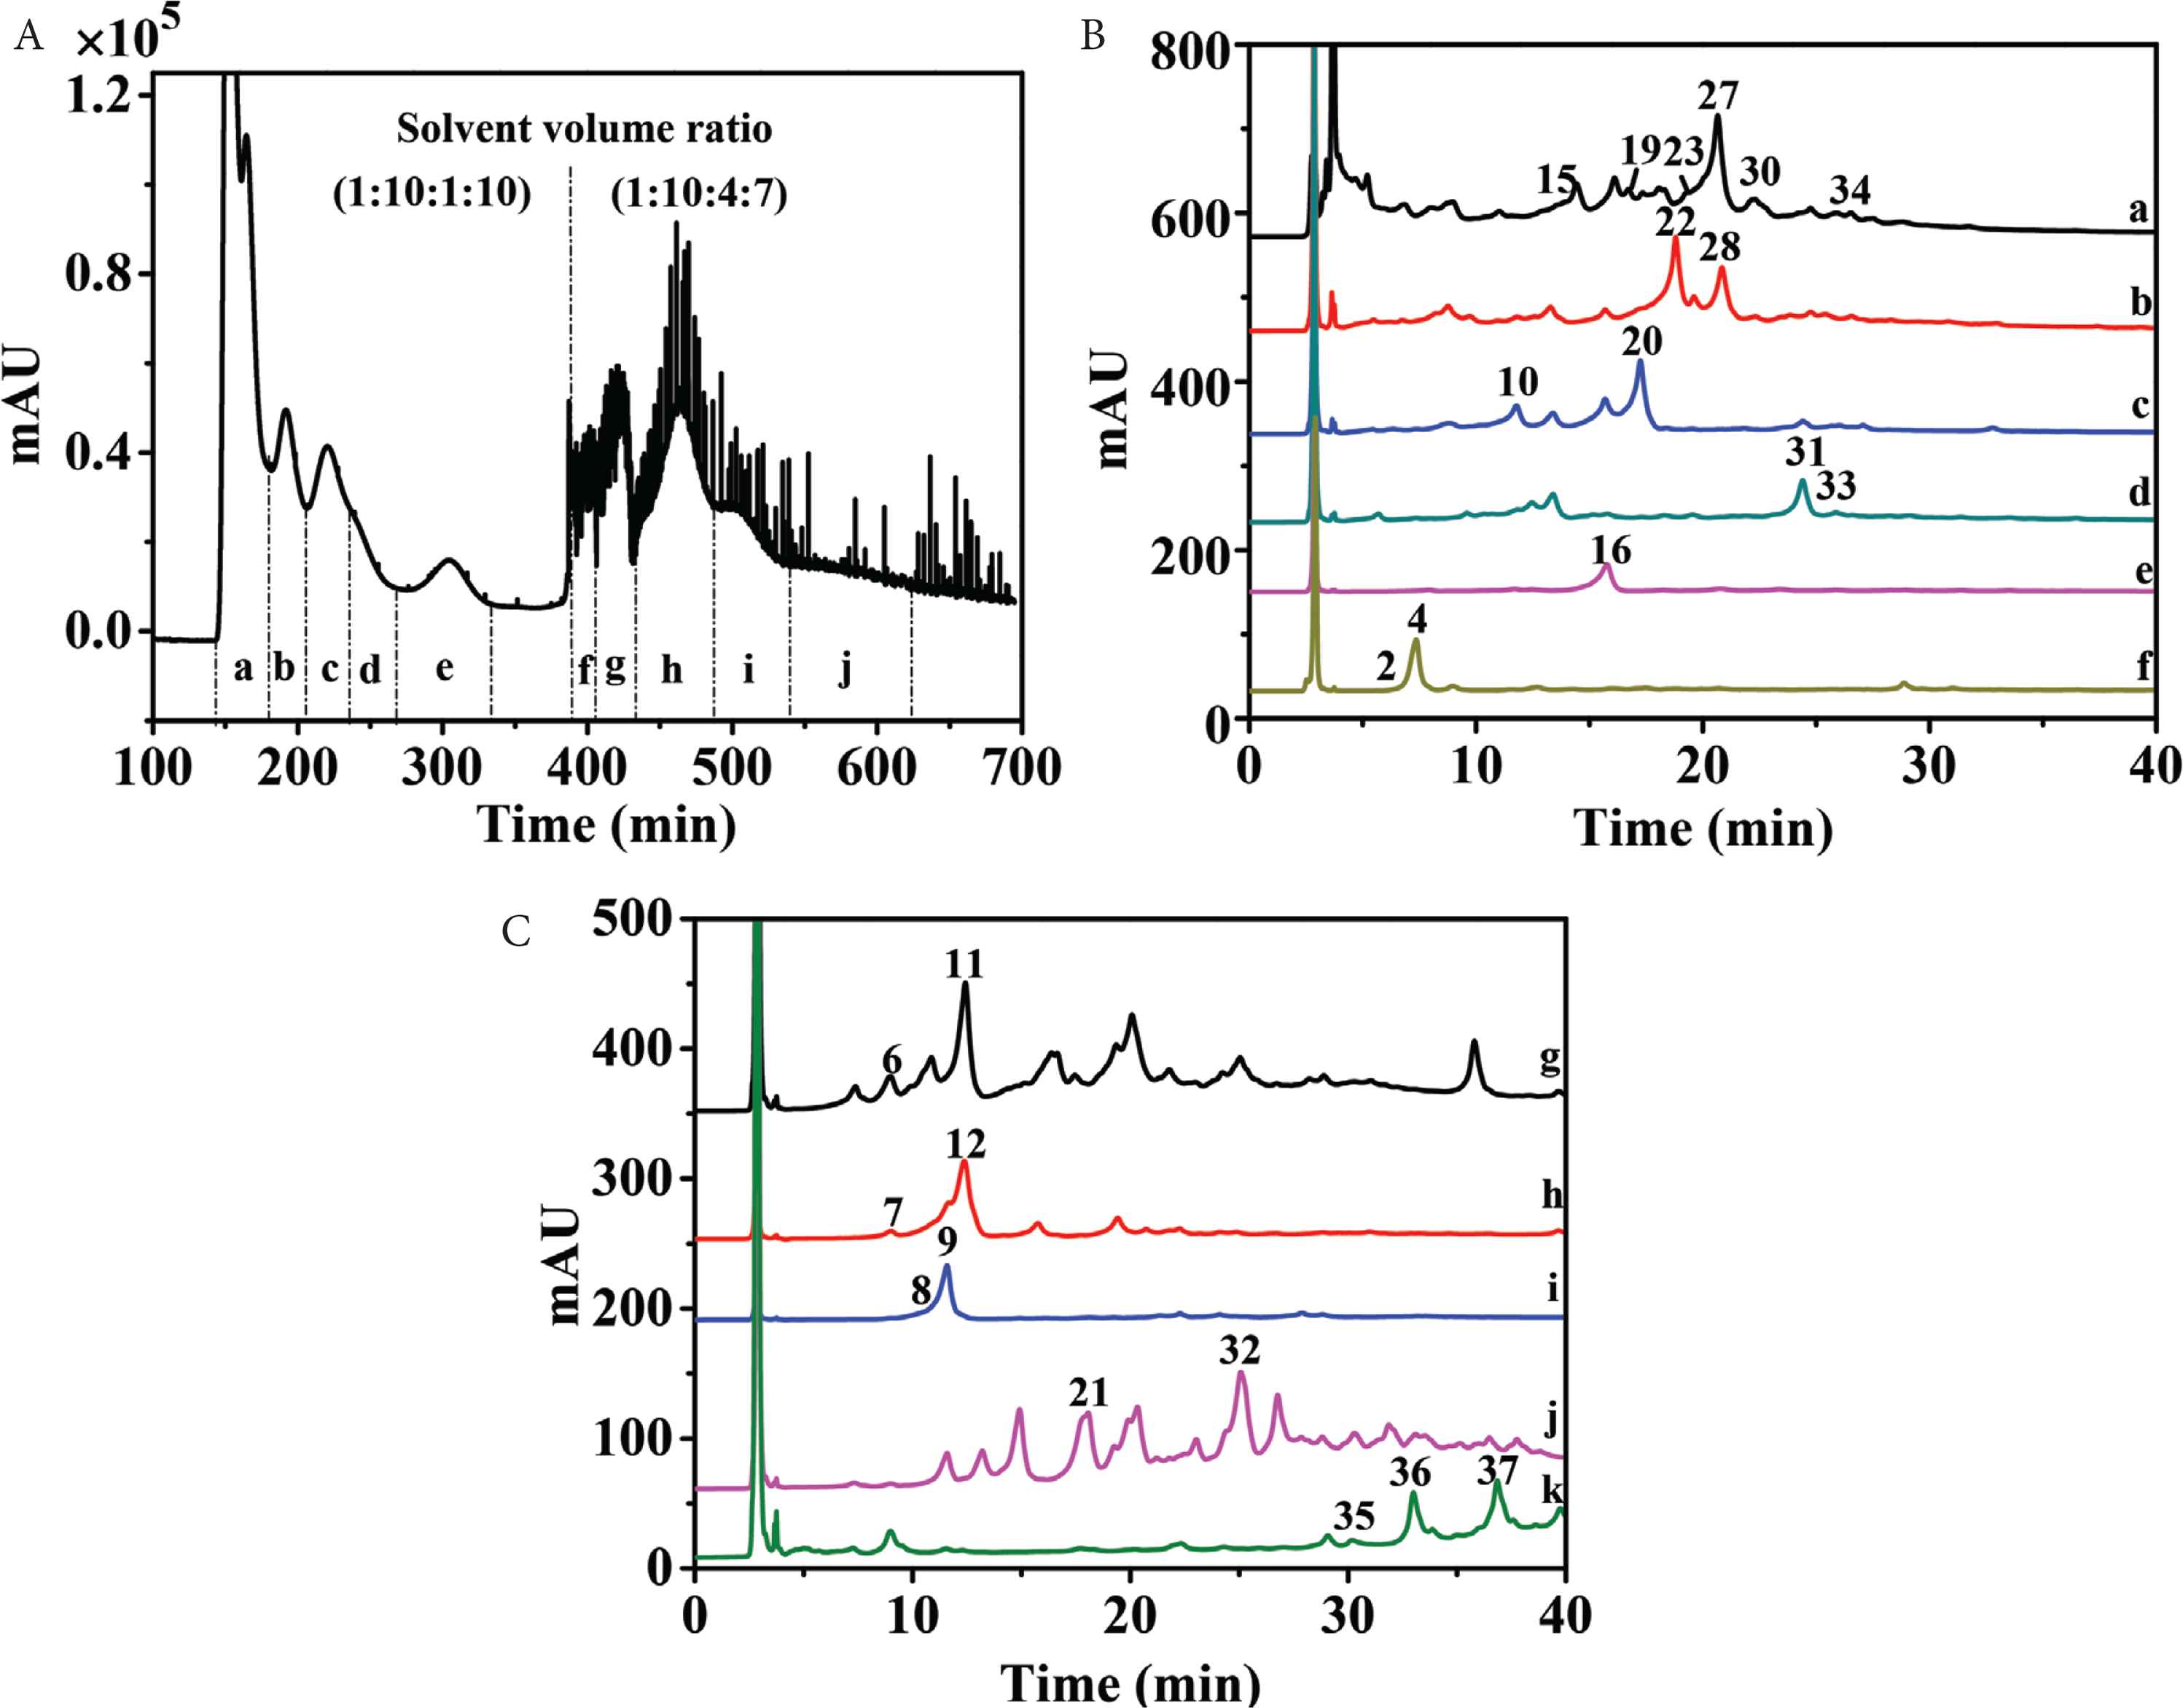
High-speed countercurrent chromatography (HSCCC) chromatogram of ethyl acetate fraction of Plantago depressa (Fr. a–j) (A) and HPLC chromatograms of Frs. a–f (B) Frs. g–j and stationary phase Fr. k (C).
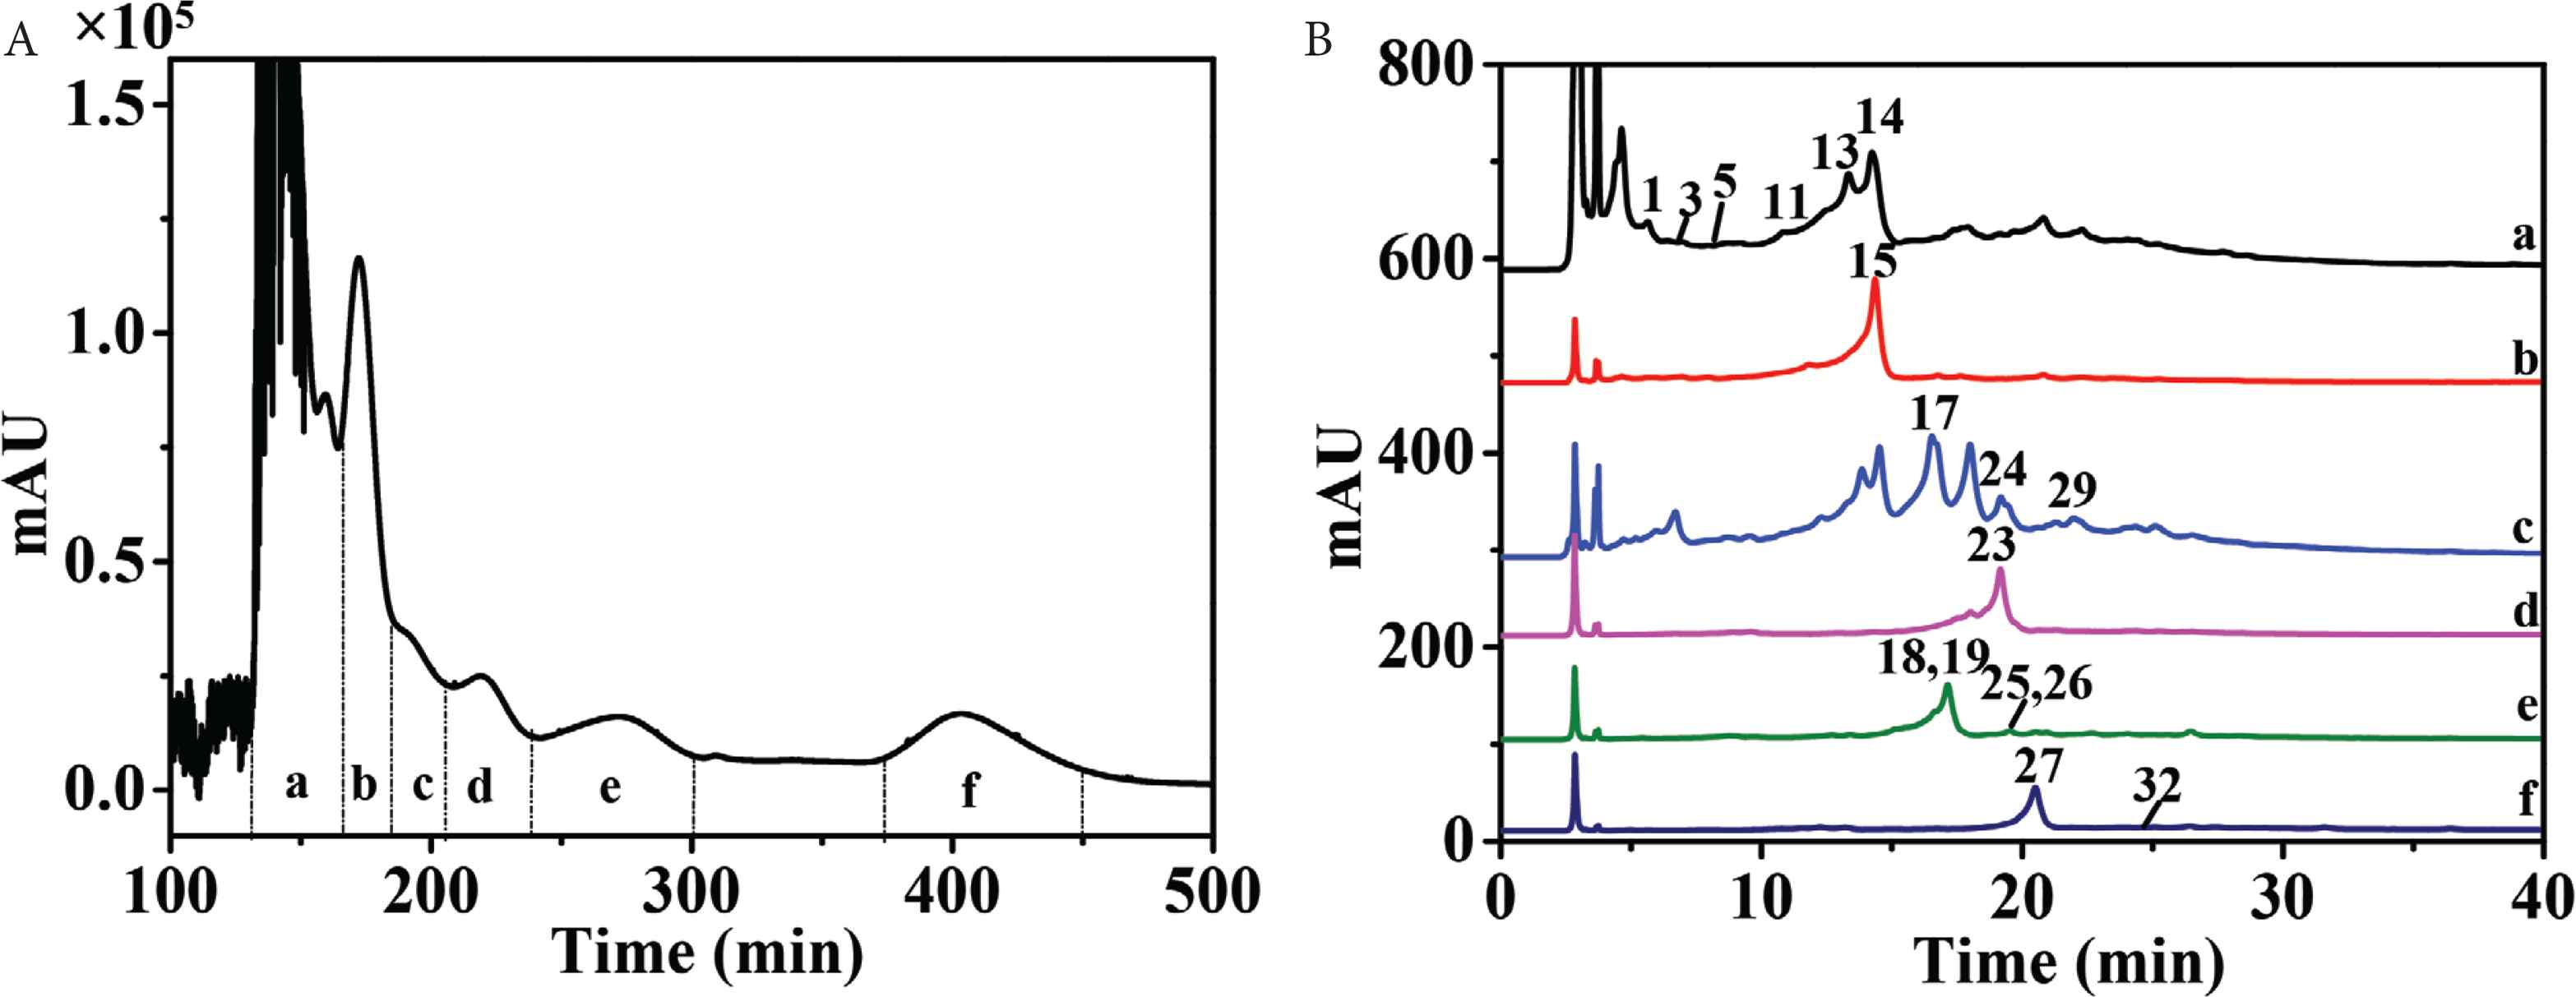
HSCCC chromatogram of n-butanol fraction of P. deprassa (Fr. a–f) (A) and HPLC chromatograms of Frs. a–f (B).
3.4. Characterization of Polyphenols by HPLC–DAD–QTOF-MS/MS
By a preliminary UV screening of Figures 2B, 2C, and 3B, 22 compounds (1, 3, 5, 6, 8, 11, 13–18, 21–26, 29–30, 32, and 34) showed maximum UV absorbance at about 250 and 320–330 nm with a shoulder peak at 285–290 nm and might be phenylethanoid glycosides or polyphenols that contain a trans-caffeoyl group [23]. Moreover, eight flavonoids (19, 27–28, 31, 33, and 35–37) had two characteristic maximum absorption bands at 260–285 and 330–350 nm. Compounds 2, 4, 7, 9, and 12 with a maximum absorbance at about 260–285 nm were probably the phenolic acid derivatives. Compound 20 exhibited maximum absorbance at 320 nm and might be stilbenes [27]. Finally, their structures were identified or tentatively characterized by comparing their retention time, UV spectra, MS/MS data with standards, or previously published data (Table 2), and their structures were presented in Figure 4.
| No. | tR (min) | λmax (nm) | [M−H]− (m/z) (Δppm) | Formula (neutral form) | Fragmentation | Identification | References |
|---|---|---|---|---|---|---|---|
| 1 | 4.748 | 330 | 655.1925 (−4.3) | C29H36O17 | 637.1791 [M–H2O–H]− 475.1456 [M–H2O–Glc–H]− 179.0374 [Coffeoyl–H]− 161.0258 [Coffeoyl–H–H2O]− 151.0408 [Dehydrophenylethanol–H]− |
Hellicoside isomera | Qi et al. [28] |
| 2 | 5.887 | 296 | 167.0418 (−6.0) | C8H8O4 | 123.0438 [M–H–CO2]− 108.0200 [M–CO2–CH3·–H]− |
Vanillic acida | Zhang et al. [12] |
| 3 | 6.579 | 330 | 655.1929 (−3.7) | C29H36O17 | 637.1793 [M–H2O–H]− 475.1481 [M–H2O–Glc–H]− 179.0374 [Coffeoyl–H]− 161.0258 [Coffeoyl–H–H2O]− 151.0409 [Dehydrophenylethanol–H]− |
Hellicosidea | Qi et al. [28] |
| 4 | 6.818 | 260 | 153.0271 (3.2) | C7H6O4 | 109.0358 [M–H–CO2]− | 3,4-Dihydroxybenzoic acida | Zhang et al. [12] |
| 5 | 7.894 | 330 | 655.1935 (−2.7) | C29H36O17 | 637.1780 [M–H2O–H]− 475.1496 [M–H2O–Glc–H]− 179.0374 [Coffeoyl–H]− 161.0258 [Coffeoyl–H–H2O]− 151.0409 [Dehydrophenylethanol–H]− |
Hellicoside isomera | Qi et al. [28] |
| 6 | 8.472 | 245, 315 | 353.0954 (0.85) | C16H18O9 | 191.0642 [M–coffeoyl–H]− 161.0368 [Coffeoyl–H2O–H]− |
cis-3-O-Caffeoylquinic acidb | Hu et al. [23] |
| 7 | 8.511 | 280 | 137.0310 (−5.1) | C7H6O3 | 93.0304 [M–H–CO2]− | Salicylic acida | Zhang et al. [12] |
| 8 | 8.600 | 243, 330 | 353.0953 (0.65) | C16H18O9 | 191.0651 [M–coffeoyl–H]− 161.0368 [Coffeoyl–H]− |
3-O-Caffeoylquinic acid | Zhang et al. [12] |
| 9 | 11.050 | 255 | 137.0306 (−8.0) | C7H6O3 | 93.0305 [M–H–CO2]− | p-Hydroxybenzoic acida | Zhang et al. [12] |
| 10 | 11.291 | 285 | 405.1233 (−7.6) | C22H20O9 | 243.0782 [M–H–Glc]− 149.0273 [M–H–Glc–C6H6O]− 119.0510 [M–H–Glc–C6H4O3]− 93.0340 [M–H–Glc–C8H6O3]− |
cis-2,3,5,4′-Tetrahydroxystilbene-2-O-glucosideb | Wang et al. [29] |
| 11 | 11.321 | 325 | 179.0419 (6.1) | C9H8O4 | 135.0515 [M–H–CO2]− | Caffeic acid | Zhang et al. [12] |
| 12 | 11.800 | 277 | 197.0540 (−2.2) | C9H10O5 | 153.0934 [M–H–CO2]− | Syringic acida | Zhang et al. [12] |
| 13 | 13.257 | 330 | 655.1943 (−1.5) | C29H36O17 | 637.1851 [M–H2O–H]− 475.1496 [M–H2O–Glc]− 179.0374 [Coffeoyl–H]− 161.0254 [Coffeoyl–H2O–H]− 151.0421 [Dehydrophenylethanol–H]− |
Hellicoside isomera | Qi et al. [28] |
| 14 | 13.581 | 330 | 655.1955 (0.3) | C29H36O17 | 637.1705 [M–H2O–H]− 475.1496 [M–H2O–Glc]− 179.0374 [Coffeoyl–H]− 161.0258 [Coffeoyl–H2O–H]– 151.0421 [Dehydrophenylethanol–H]− |
Hellicoside isomera | Qi et al. [28] |
| 15 | 14.360 | 330 | 639.2008 (0.8) | C29H36O16 | 477.1737 [M–H–coffeoyl]− 315.1128 [M–H–coffeoyl–Glc]– 179.0367 [Coffeoyl–H]− 161.0271 [Coffeoyl–H2O–H]− 153.0576 [Phenylethanol–H]− |
Plantamajoside | Wang et al. [7] |
| 16 | 14.153 | 330 | 477.1458 (−3.6) | C23H26O11 | 315.1218 [M–H–coffeoyl]− 179.0365 [Coffeoyl–H]− 161.0255 [Coffeoyl–H2O–H]− 153.0575 [Phenylethanol–H]− |
Calceolarioside Aa | Zhang et al. [12] |
| 17 | 16.137 | 330 | 683.2216 (−7.1) | C31H40O17 | 637.1785 [M–H–CH3CH2OH]− 475.1484 [M–H–CH3CH2OH–coffeoyl]− 313.0953 [M–H–CH3CH2OH–coffeoyl–Glc]− 179.0368 [Coffeoyl–H]− 161.0253 [Coffeoyl–H2O–H]− 151.0407 [Dehydrophenylethanol–H]− |
2-Ethoxy plantamajoside isomersb | Shi et al. [30] |
| 18 | 16.464 | 330 | 623.2059 (0.8) | C29H36O15 | 461.1731 [M–H–coffeoyl]− 315.1123 [M–H–coffeoyl–Rha]− 179.0370 [Coffeoyl–H]− 161.0272 [Coffeoyl–H2O–H]− 153.0581 [Phenylethanol–H]− |
Acteoside | Zhang et al. [12] |
| 19 | 16.693 | 285, 344 | 463.0938 (−3.7) | C21H20O12 | 301.0375 [M–H–Glc]− | 6-Hydroxyluteolin-7-O-glucosidea | Friščić et al. [31] |
| 20 | 16.746 | 320 | 405.1236 (−6.9) | C22H20O9 | 243.0789 [M–H–Glc]− 149.0273 [M–H–Glc–C6H6O]− 119.0510 [M–H–Glc–C6H4O3]− 93.0340 [M–H–Glc–C8H6O3]− |
2,3,5,4′-Tetrahydroxystilbene-2-O-glucosideb | Wang et al. [29] |
| 21 | 17.589 | 325 | 193.0585 (3.1) | C10H10O4 | 134.0433 [M–H–CO2–CH3·]− | Ferulic acid | Zhang et al. [12] |
| 22 | 18.29 | 330 | 477.1468 (−1.5) | C23H26O11 | 315.1222 [M–H–coffeoyl]− 179.0363 [Coffeoyl–H]− 161.0257 [Coffeoyl–H2O–H]− 153.0612 [Phenylethanol–H]− |
Calceolarioside Ba | Zhang et al. [12] |
| 23 | 18.921 | 330 | 639.2014 (1.7) | C29H36O16 | 477.1676 [M–H–coffeoyl]− 315.1906 [M–H–coffeoyl–Glc]− 179.0363 [Coffeoyl–H]− 161.0273 [Coffeoyl–H2O–H]− 153.0600 [Phenylethanol–H]− |
Isoplantamajoside | Wang et al. [7] |
| 24 | 19.462 | 330 | 653.2176 (2.4) | C30H38O16 | 621.1971 [M–H–CH3OH]− 491.1615 [M–H–coffeoyl]− 345.1657 [M–H–coffeoyl–Rha]− 313.1251 [M–H–CH3OH–coffeoyl–Rha]− 179.0380 [Coffeoyl–H]− 161.0266 [Coffeoyl–H2O–H]− 151.0414 [Dehydrophenylethanol–H]− |
Campneoside I | Zhang et al. [12] |
| 25 | 19.568 | 330 | 623.2066 (1.9) | C29H36O15 | 461.1731 [M–H–coffeoyl]− 315.1148 [M–H–coffeoyl–Rha]− 179.0375 [coffeoyl–H]− 161.0252 [coffeoyl–H2O–H]− 153.0583 [Phenylethanol–H]− |
Isoacteoside | Zhang et al. [12] |
| 26 | 20.532 | 330 | 623.2069 (2.4) | C29H36O15 | 461.1744 [M–H–coffeoyl]− 315.1165 [M–H–coffeoyl–Rha]− 179.0370 [coffeoyl–H]− 161.0253 [coffeoyl–H2O–H]− 153.0583 [Phenylethanol–H]− |
Forsythiaside | Wang et al. [7] |
| 27 | 20.655 | 282, 336 | 447.0999 (−1.6) | C21H20O11 | 285.0523 [M–H–Glc]− | 6-Hydroxyapigenin-7-O-glucosidea | Zhang et al. [12] |
| 28 | 20.854 | 254, 345 | 447.0990 (−3.6) | C21H20O11 | 895.2193 [2M–H]− 285.0523 [M–H–Glc]− |
Luteolin-7-O-glucosidea | Zhang et al. [12] |
| 29 | 21.731 | 330 | 683.2220 (−6.5) | C31H40O17 | 637.1862 [M–H–CH3CH2OH]− 475.1487 [M–H–CH3CH2OH–coffeoyl]− 313.0972 [M–H–CH3CH2OH–coffeoyl–Glc]− 179.0365 [Coffeoyl–H]− 161.0254 [Coffeoyl–H2O–H]− 151.0407 [Dehydrophenylethanol–H]− |
2-Ethoxy plantamajoside isomersb | Shi et al. [30] |
| 30 | 22.496 | 330 | 667.2330 (2.1) | C31H40O16 | 505.1819 [M–H–Glc]− 491.1755 [M–H–feruloyl]− 329.1377 [M–H–feruloyl–Glc]− 193.0537 [Feruloyl–H]− 175.0422 [Feruloyl–H2O–H]− |
Scroside Ba | Cao et al. [32] |
| 31 | 24.445 | 268, 336 | 431.1067 (2.5) | C21H20O10 | 269.0555 [M–H–Glc]− | Apigenin-7-O-glucoside | Zhang et al. [12] |
| 32 | 24.669 | 330 | 651.2365 (−0.3) | C31H40O15 | 475.1630 [M–H–feruloyl]− 329.1311 [M–H–feruloyl–Rha]− 193.0539 [Feruloyl–H]− 175.0431 [Feruloyl–H2O–H]− |
Martynoside | Wang et al. [7] |
| 33 | 26.294 | 285, 332 | 447.0999 (−1.6) | C21H20O11 | 285.0523 [M–H–Glc]− | 6-Hydroxyapigenin-4′-O-glucosideb | Bomfim- Patrício et al. [33] |
| 34 | 27.171 | 330 | 667.2325 (1.3) | C31H40O16 | 505.1868 [M–H–Glc]− 491.1787 [M–H–feruloyl]− 329.1480 [M–H–feruloyl–Glc]− 193.0520 [Feruloyl–H]− 175.0424 [Feruloyl–H2O–H]− |
Hemiphroside Aa | Cao et al. [32] |
| 35 | 30.394 | 255, 373 | 301.0466 (−3.6) | C15H10O7 | 179.0539 [1,2A]− 151.0069 [1,2A–CO]− 121.0358 [1,2B]− |
Quercetina | Zhang et al. [12] |
| 36 | 33.334 | 255, 345 | 285.0458 (−6.6) | C15H10O6 | 151.0048 [1,2A–CO]− 133.0351 [1,3B]− |
Luteolina | Zhang et al. [12] |
| 37 | 36.966 | 258, 335 | 269.0526 (−0.7) | C16H9O5 | 197.1249 [M–H–CO2–CO]− 151.0041 [1,2A–CO]− 121.0304 [1,2B]− |
Apigenina | Zhang et al. [12] |
Compounds reported in P. deprassa for the first time.
Compounds reported in Plantago family for the first time.
Identification of polyphenols in P. deprassa by HPLC–DAD–ESI–QTOF-MS/MS
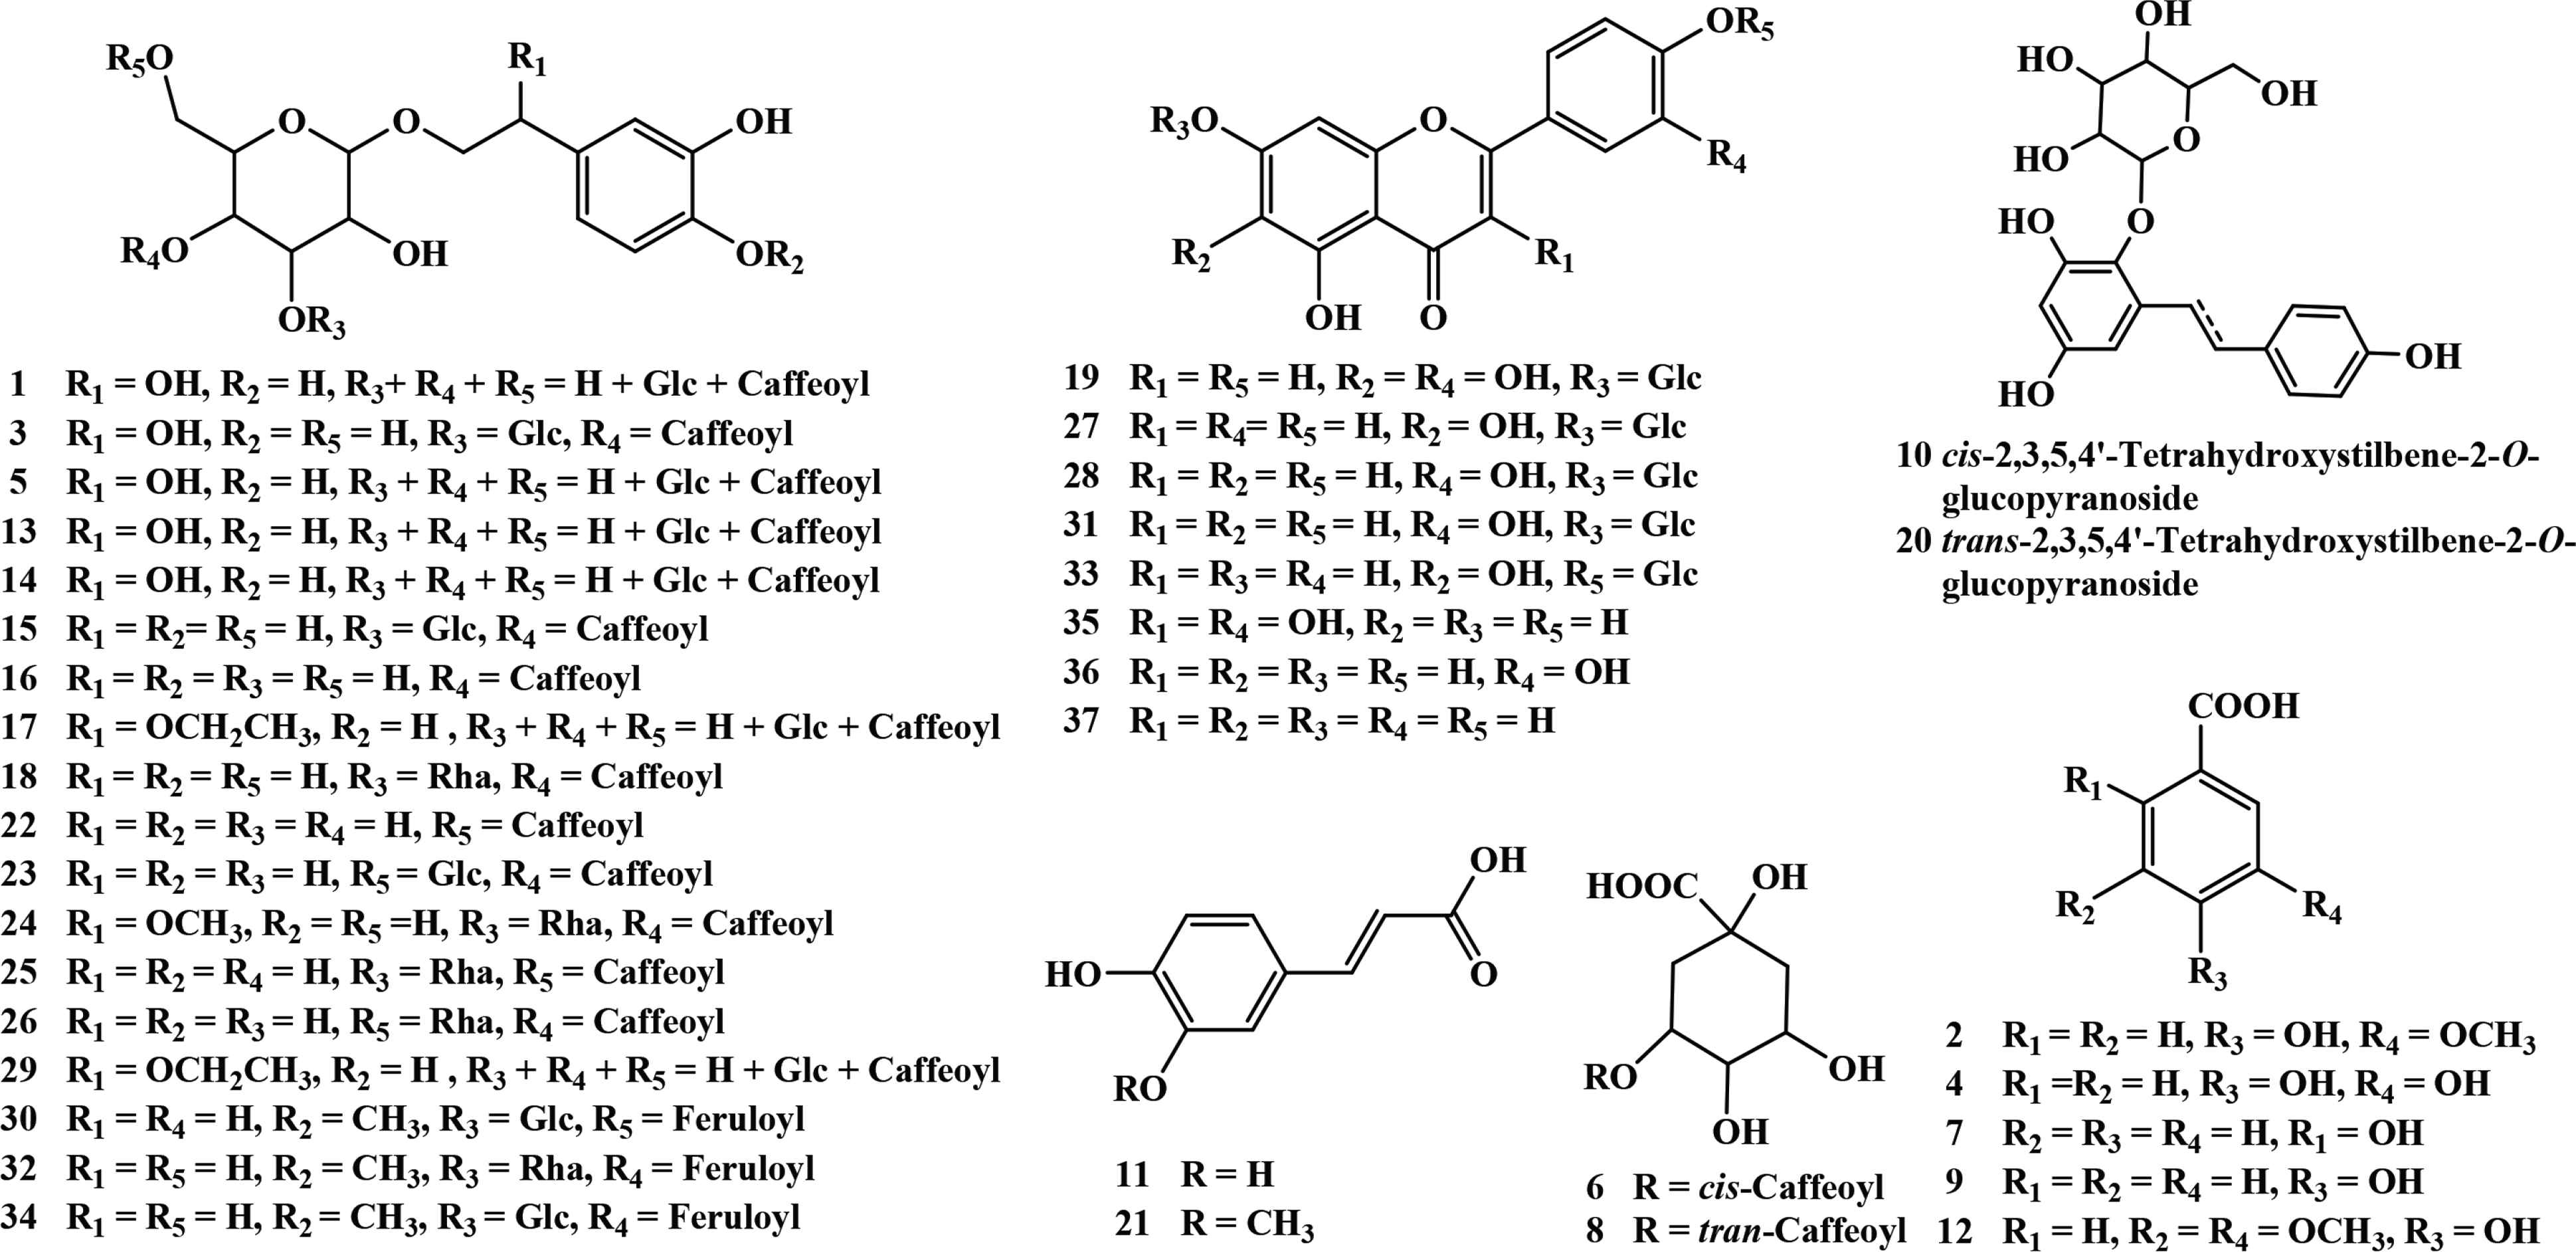
Identified polyphenols in P. depressa.
3.4.1. Identification of phenylethanoid glycosides
Phenylethanoid glycosides are one of the main metabolites in Plantago species. For phenylethanoid glycosides, the C3, C4, or C6 position of glucose is usually attached with glycosyl and coffeoyl/feruloyl group [7]. The significant fragment ions at m/z 179.0369 [caffeic acid–H]−, m/z 161.0258 [caffeic acid–H–H2O]−, and [M–H–162]− indicate the presence of coffeoyl group. Similarly, the observation of fragment ions at m/z 193.0520 [ferulic acid–H]−, m/z 175.0432 [ferulic acid–H–H2O]−, and [M–H–176]− indicates the presence of feruloyl group. What is more, the elimination of a glucosyl (Glc) unit (162 Da) or a rhamnosyl (Rha) unit (146 Da), is also the typical fragmentation of phenylethanoid glycosides [34]. Side chain of phenylethanol group may be substituted by hydroxyl, methoxyl, or ethoxyl group, which responds to the existence of fragment ions of [M–H–18]−, [M–H–32]−, or [M–H–46]− [30,35,36]. Compounds 17 and 29 presented the same UV and MS/MS spectra (Figure 5A and 5B). The UV spectra indicated the presence of a coffeoyl group. The fragment ion at m/z 637.1853 [M–H–46]− indicated the presence of an ethoxy substitution on the side chain of phenylethanol group. The fragment ions at m/z 475.1484 [M–H–46–162]−, m/z 313.0953 [M–H–46–162–162]−, m/z 179.0368 [coffeoyl–H]−, and m/z 161.0253 [coffeoyl–H2O–H]− indicated the presence of a caffeoyl unit and a glucosyl unit. The fragmentation pathways of compounds 17 and 29 were shown in Figure 5C, and they were tentatively identified as a pair of 2-ethoxy plantamajoside isomers [10]. Notably, they were not found in SciFinder database. 2-Hydroxy plantamajoside isomers and 2-methoxy plantamajoside isomers have been isolated from natural products [12]. Here, the methanol extract of P. depressa also found the existence of 2-ethoxy plantamajoside isomers (17 and 29), which were not found perhaps because of their very low abundance.
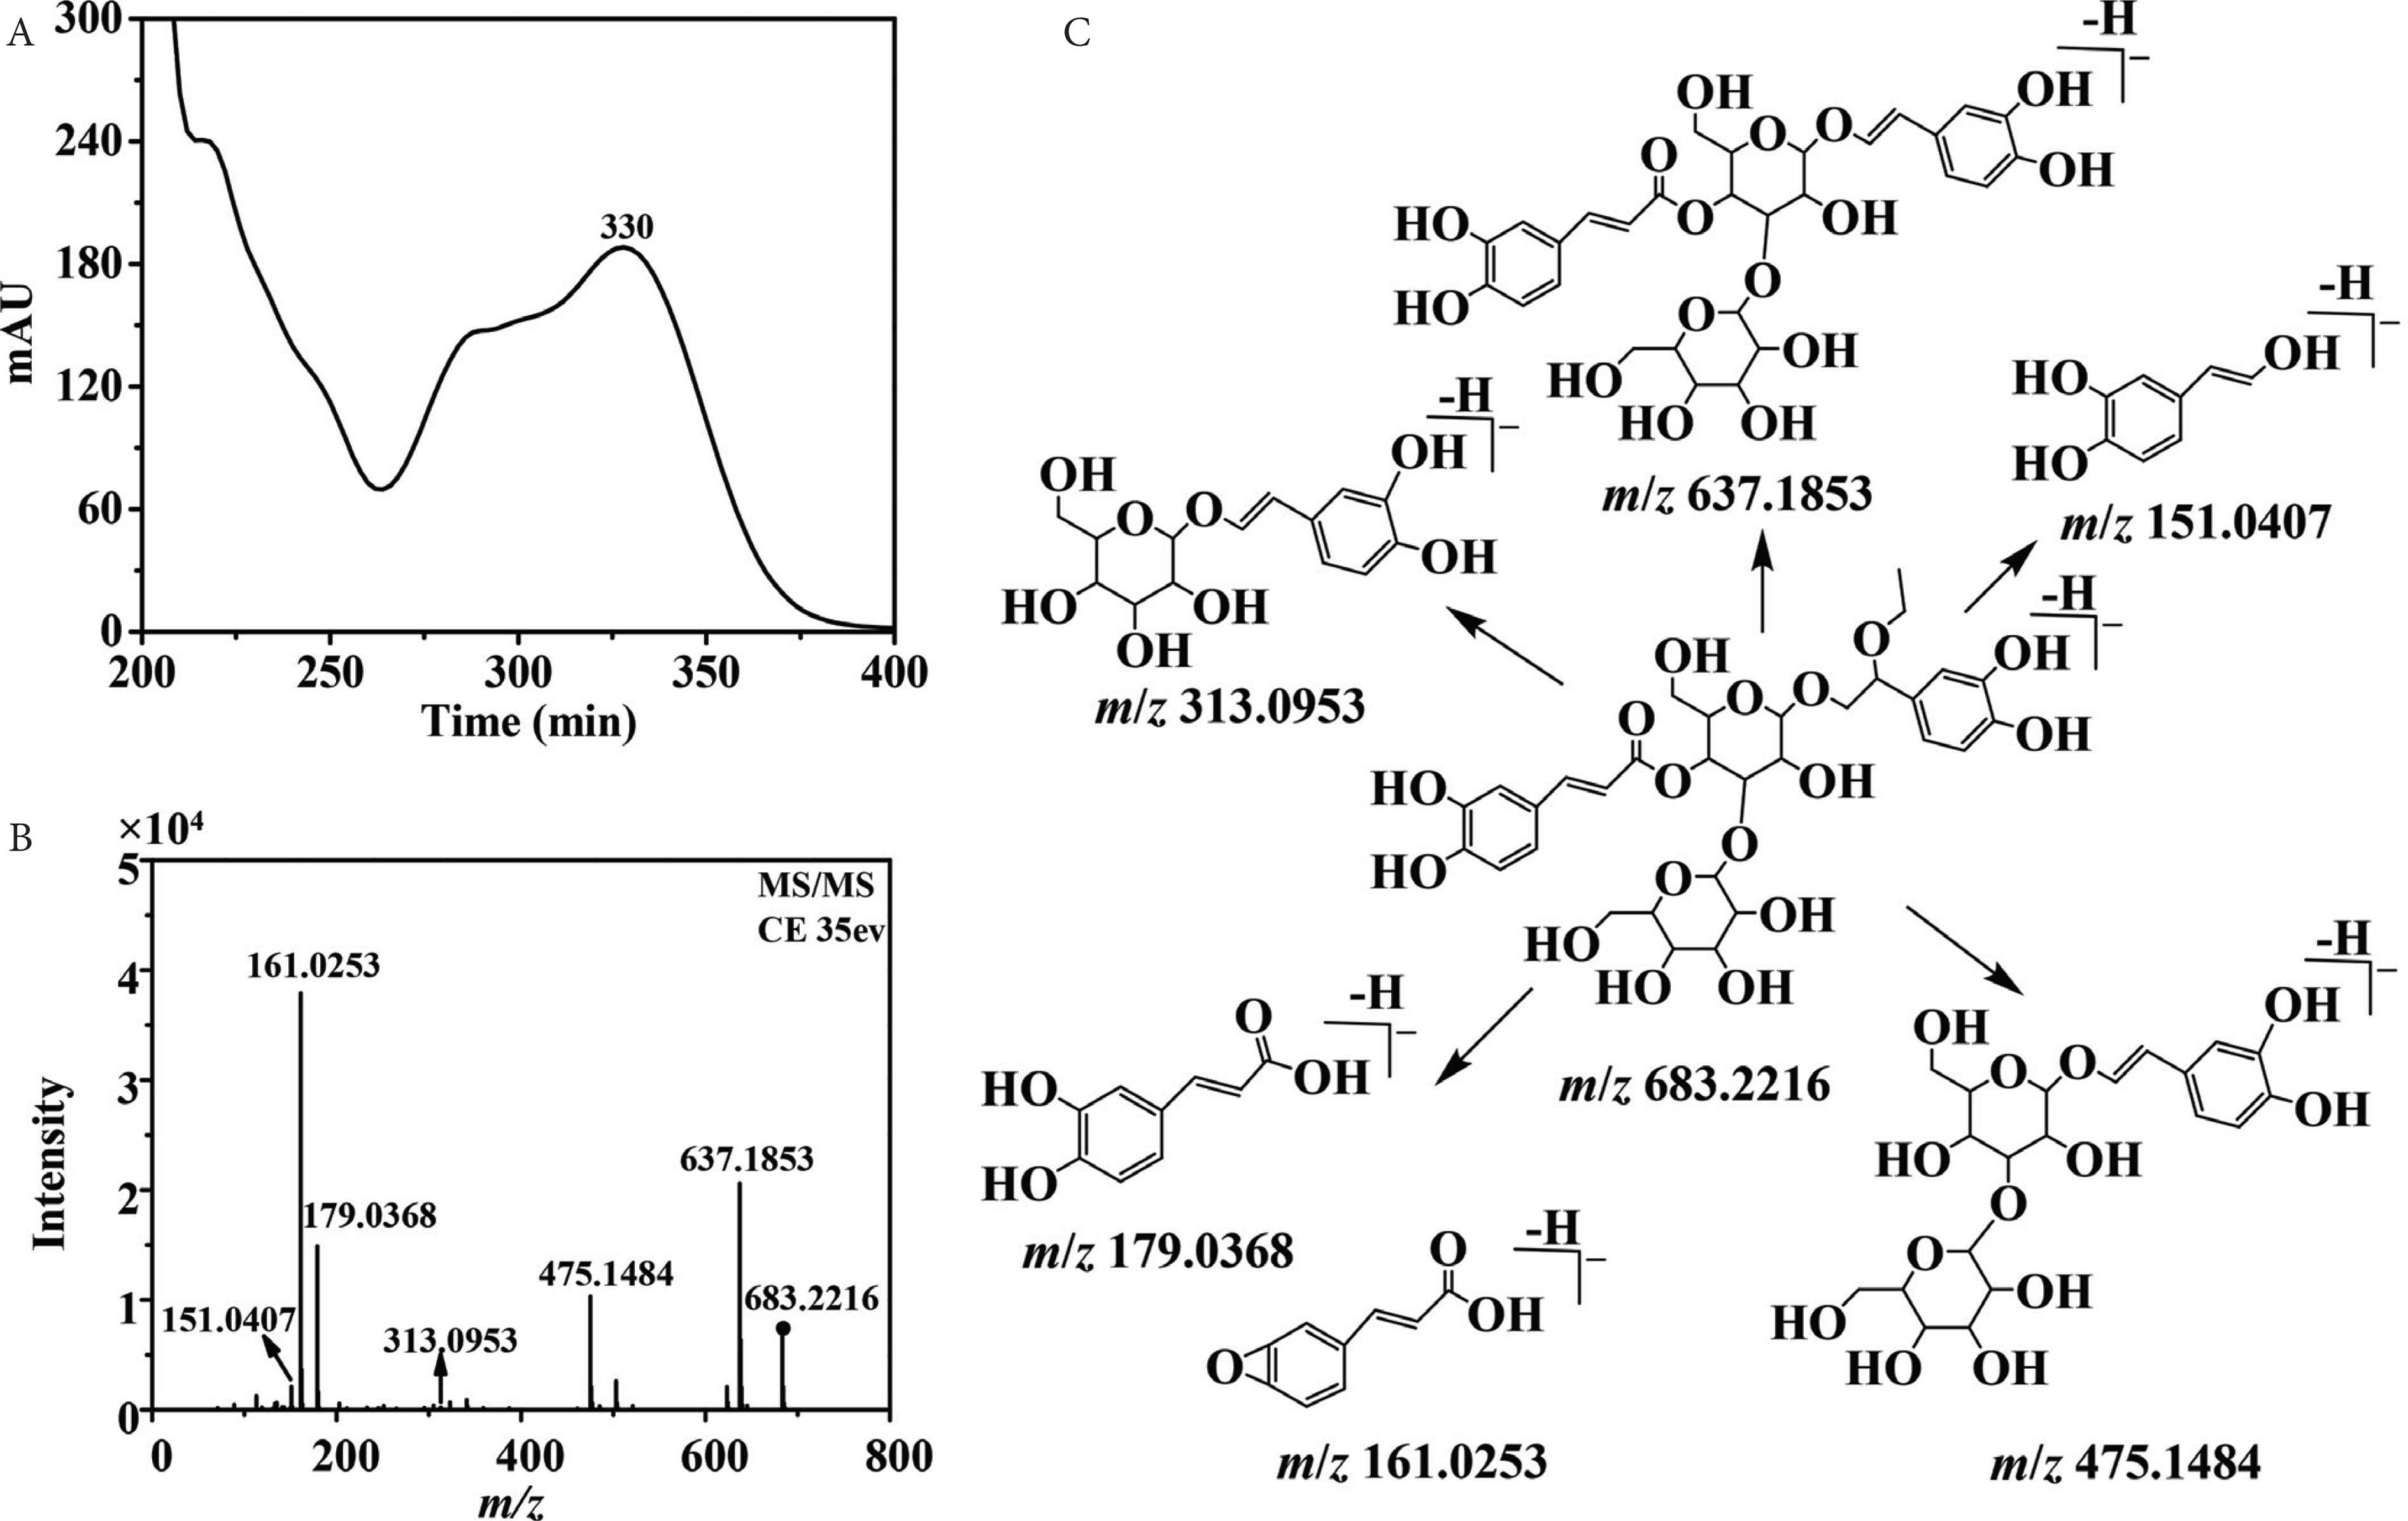
Ultraviolet spectra (A), MS/MS spectra (B), and fragmentation pathway (C) of compound 17 with its collision energy at 35 eV.
Compounds 1, 3, 5, 13, and 14 were pairs of isomers with molecular weight at m/z at 655.1925 (C29H35O17), 28 Da less than that of compound 2-ethoxy plantamajoside isomer. All of them presented the characteristic fragment ion at m/z 637.1791 [M–H2O–H]−, and the other fragment ions were the same with those of 2-ethoxy plantamajoside isomer (17). Therefore, compounds 1, 3, 5, 13, and 14 could be considered as the isomers of 2-hydroxy plantamajoside (hellicoside) with different substituent positions of caffeoyl and glycosyl groups. By comparison, the HPLC retention time with those reported [12,28] compound 3 might be hellicoside. Compounds 15 and 23 showed the same molecular ions at m/z 639.2008 (C29H35O16), 16 Da less than that of hellicoside (3), and the same fragment ions. By analysis of the retention time and fragment pathways, compound 15 was the same with those of plantamajoside. Then, compound 23 might be isoplatamajoside according to reported data [7,12]). Isomeric 18, 25, and 26 had the same molecular weight at m/z 623.2059 [C29H35O15, 16 Da less than that of plantamajoside (15)]. Characteristic fragment ions at m/z 461.1731 [M–H–162]− and 315.1123 [M–H–162–146]− indicated the existence of a caffeoyl unit and a rhamnosyl unit. Comparing their retention time and MS/MS spectra with standards, compounds 18, 25, and 26 could be unambiguously characterized as acteoside, isoacteoside, and forsythiaside. Compound 24 yielded [M−H]− ion at m/z 653.2176 [C30H37O16, 30 Da greater than that of acteoside (18)]. Fragment ions at m/z 621.1971 [M–H–CH3OH]− suggested the presence of methoxyl group on the side chain of phenylethanol group; hence, compound 24 might be campneoside I [12,36]. Compounds 16 and 22 both gave [M−H]− ion at m/z 477.1458 (C23H25O11), fragment ions at m/z 315.1218 [M–H–162]−, and 179.0365 [caffeic acid–H]−, which corresponded to those of standards, calceolarioside A, and calceolarioside B. The quasi-molecular ion [M−H]− at m/z 651.2365 (C31H39O15) was found for compound 32, which was named as martynoside according to analysis of its fragment ions at m/z 475.1630 [M–H–feruloyl]−, 329.1311 [M–H–feruloyl–Rha]−, 193.0539 [feruloyl–H]−, and the HPLC behavior with those of standard. Compounds 30 and 34 were a pair of isomers with the same [M−H]− ion at m/z 677.2330 [C31H39O16, 16 Da more than that of martynoside (32)], fragment ions at 505.1819 [M–H–Glc]−, 491.1755 [M–H–feruloyl]−, and 329.1377 [M–H–feruloyl–Glc]−, which were then tentatively assigned as scroside B and hemiphroside A [12,32,37].
It was noted that among the identified 18 phenylethanoid glycosides, only plantamajoside (15), acteoside (18), campneoside I (24), and isoacteoside (25) were previously reported in the whole plant of P. depressa [12,38]. Isoplatamajoside (23), forsythiaside (26), and martynoside (32) were previously reported in the seed of P. depressa [7], while hellicoside isomers (1, 3, 5, 13, and 14), calceolarioside A (16), calceolarioside B (22), scroside B (30), and hemiphroside A (34) were found in the other species in Plantago genus (e.g., Plantago major, P. asiatica) [12].
3.4.2. Identification of flavonoids
The glycosidic bond (O-glycosides) in flavonoids was easily to break in the collision cell and generate a fragment ion of [M–H–162]− by the loss of a hexose sugar or a [M–H–146]− ion corresponding to the loss of a pentose sugar. A total of eight flavonoids were screened and identified in P. depressa, and six of them were unambiguously identified as 6-hydroxyapigenin-7-O-glucoside (27), luteolin-7-O-glucoside (28), apigenin-7-O-glucoside (31), quercetin (35), luteolin (36), and apigenin (37) by comparison with standards. Compound 33 showed the same molecular ions and fragment ions with those of 6-hydroxyapigenin-7-O-glucoside (27); therefore, it could be identified as 6-hydroxyapigenin-4′-O-glucoside [33]. Compound 19 showed [M−H]− ion at m/z 463.0938 [(C21H19O12), 16 Da greater than that of 6-hydroxyapigenin-7-O-glucoside (27)] and [M–H–162]− ion at m/z 301.0375 (C15H9O7) in MS/MS spectrum. By comparison with 6-hydroxyapigenin-7-O-glucoside (27), the maximum UV adsorption of band I in 19 was red shifted; therefore, an additional hydroxyl group should be positioned on the B-ring of flavonoid. As a result, compound 19 could be tentatively assigned as 6-hydroxyluteolin-7-O-glucopyranoside [31]. Among the identified flavonoids, only apigenin-7-O-glucoside (31) was found in the whole plant of P. depressa [12]. 6-Hydroxyluteolin-7-O-glucopyranoside (19), 6-hydroxyapigenin-7-O-glucoside (27), luteolin-7-O-glucoside (28), quercetin (35), luteolin (36), and apigenin (37) were identified in other species in Plantago genus (e.g., P. major, P. asiatica, and P. lanceolate) [12]. 6-Hydroxyapigenin-4′-O-glucoside (33) was found in Plantago family for the first time.
3.4.3. Identification of other polyphenols
Phenolic acids were widely distributed in natural products. Compounds 2, 4, 7, 9, 11, 12, and 21 all gave [M–CO2–H]− fragment ions, and they were unequivocally identified as vanillic acid (2), 3,4-dihydroxybenzoic acid (4), salicylic acid (7), p-hydroxybenzoic acid (9), caffeic acid (11), syringic acid (12), and ferulic acid (21) by comparing their HPLC–DAD–QTOF-MS/MS data with those of standards. Compounds 6 and 8 were isomers with molecular weight at m/z 353.0954 (C16H17O9), which produced characteristic fragment ion at m/z 191.0642 [M–coffeoyl–H]−. However, they presented different maximum UV adsorption: 245 and 315 nm for 6, 243 and 330 nm for 8. Compound 8 was identified as 3-O-caffeoylquinic acid by comparison with the standard. Compound 6 could be assigned as cis-3-O-caffeoylquinic acid, an interesting phenomenon about trans–cis isomerization of caffeoylquinic acid [23]. To our best knowledge, 3-O-caffeoylquinic acid (8) and caffeic acid (11) have been reported in P. depressa. Vanillic acid (2), 3,4-dihydroxybenzoic acid (4), salicylic acid (7), p-hydroxybenzoic acid (9), caffeic acid (11), syringic acid (12), and ferulic acid (21) have been found in the other species of Plantago genus (e.g., P. major, P. asiatica) [12], and cis-3-O-caffeoylquinic acid (6) was reported in Plantago family for the first time.
Isomeric 10 and 20 produced [M−H]− ion at m/z 405.1233 (C20H21O9) and fragment ion at m/z 243.0782 [M–H–Glc]−. In addition, the fragment ions at m/z 149.0273 [M–H–Glc–C6H6O]−, 119.0510 [M–H–Glc–C6H4O3]−, and 93.0340 [M–H–Glc–C8H6O3]− arose from the existence of structure of 2,3,5,4′-tetrahydroxystilben [29]. The differences between them were the maximum UV absorption, 285 nm for 10 and 320 nm for 20. Based on these, 10 and 20 could be speculated as trans–cis isomerization of stilbenes [27]. The retention time and MS/MS spectrum of 20 were consistent with those of 2,3,5,4′-tetrahydroxystilbene-2-O-glucoside, and then compound 10 could be deduced as cis-2,3,5,4′-tetrahydroxystilbene-2-O-glucoside [29]. Both of them were reported from Plantago family for the first time.
3.5. Quantification of new compounds in P. depressa
High-performance liquid chromatography method was used to quantify the new compounds in P. depressa. Because of the absence of commercial standards, 2-ethoxy plantamajoside isomers (17 and 29) were quantified as acteoside equivalent. Using the standard curve based method, the ratios of the HPLC peak areas (A) with respect to the corresponding concentrations of acteoside (c, mg/mL) were found to be all linear from 4.0 × 10⁻³ to 0.7 mg/mL. The regression equations was A = 15553.0 c−25.8, with R2 value at 0.9965. The limit of detection was 0.5 μg/mL and the limit of quantification was 1.8 μg/mL. Furthermore, acceptable recovery values, ranging from 86% to 127%, were obtained [39]. The contents of 2-ethoxy plantamajoside isomers (17 and 29) were calculated as 0.27 ± 0.03 and 0.04 ± 0.01 mg/g, respectively.
4. CONCLUSION
In this study, TPC and TFC in P. depressa extracts with different polarities were studied, and ethyl acetate and n-butanol fractions, rich of polyphenols, showed higher values of TPC and TFC. After that, an HSCCC × HPLC–DAD–QTOF-MS/MS method was used to systematic identification of polyphenols in P. depressa for the first time. The coeluted and minor polyphenols in ethyl acetate and n-butanol fractions could be successfully separated, enriched, and identified by making full use of the orthogonality of HSCCC and HPLC. Totally, 37 polyphenols were screened and identified from ethyl acetate and n-butanol fractions, and 29 of them were discovered in the whole plant of P. depressa for the first time. What is more, the potential new compounds (2-ethoxy plantamajoside isomers) were quantified with content of 0.27 ± 0.03 and 0.04 ± 0.01 mg/g, respectively. Results provided a comprehensive knowledge for the polyphenols in P. depressa. Moreover, the developed method presented overwhelming advantages for chemical profiling of complex natural products.
CONFLICTS OF INTEREST
The authors declare they have no conflict of interest.
AUTHOR CONTRIBUTIONS
JX, CT and KG contributed in data curation; JX and QF contributed in formal analysis; SS contributed in funding acquisition; JX and QF contributed in investigation; CT and YX contributed in Methodology; SS contributed in project administration; CT and SS contributed in supervision; JX and KG contributed in validation; JX contributed in writing original draft; CT and SS contributed in writing review & editing.
ACKNOWLEDGMENTS
The work was partially supported by a grant from the
SUPPLEMENTARY TABLES AND FIGURE
| Compounds | Petroleum ether–ethyl acetate–methanol–water (v/v/v/v) | ||
|---|---|---|---|
| 1:10:1:10 | 1:10:3:8 | 1:10:4:7 | |
| 9 | 10.0 | 6.0 | 3.4 |
| 11 | 4.8 | 2.5 | 1.4 |
| 16 | 3.0 | 1.5 | 0.8 |
| 27 | 0.9 | 0.4 | 0.2 |
| 34 | 1.0 | 0.5 | 0.3 |
K-values of compounds (9, 11, 16, 27 and 34) in ethyl acetate fraction in petroleum ether–ethyl acetate–methanol–water solvent system
| Compounds | Ethyl acetate–n-butanol–water (v/v/v) | ||
|---|---|---|---|
| 9:1:10 | 4:1:5 | 3:2:5 | |
| 14 | 0.3 | 0.8 | 1.5 |
| 18 | 0.9 | 2.4 | 4.0 |
| 24 | 0.5 | 1.2 | 2.1 |
| 27 | 2.3 | 4.0 | 6.5 |
K-values of compounds (14, 18, 24 and 27) in n-butanol fraction in ethyl acetate–n-butanol–water solvent system
High performance liquid chromatography–mass spectrometry chromatograms of HSCCC fractions, Frs. a–f (A), Frs. g–j and stationary phase Fr. k (B) for ethyl acetate fraction of Plantago deprassa, and Frs. a–f (C) of n-butanol fraction for P. deprassa.
Footnotes
REFERENCES
Cite this article
TY  - JOUR
AU  - Jinju Xu
AU  - Chaoying Tong
AU  - Qiachi Fu
AU  - Keke Guo
AU  - Shuyun Shi
AU  - Yecheng Xiao
PY  - 2019
DA  - 2019/11/14
TI  - Comprehensive Polyphenolic Profile of Plantago depressa using High-Speed Countercurrent Chromatography Off-line with High-Performance Liquid Chromatography–Diode Array Detector–Quadrupole Time-of-flight Tandem Mass Spectrometry
JO  - eFood
SP  - 94
EP  - 105
VL  - 1
IS  - 1
SN  - 2666-3066
UR  - https://doi.org/10.2991/efood.k.191101.001
DO  - 10.2991/efood.k.191101.001
ID  - Xu2019
ER  -