
VGG16-T: A Novel Deep Convolutional Neural Network with Boosting to Identify Pathological Type of Lung Cancer in Early Stage by CT Images
 , Tao Song1, 3, 4, *, Xingguang Wang5, *, Xiaochun Cheng6, *
- DOI
- 10.2991/ijcis.d.200608.001How to use a DOI?
- Keywords
- Pathological type identification; Lung cancer; Data enhancement; Boosting
- Abstract
Lung cancer is known as the highest mortality rate cancer, which needs biopsy to determine its subtype for further treatment. Recently, deep learning has provided powerful tools in lung cancer diagnose and therapeutic regimen making. However, it is still a challenge to identify the pathological type of lung cancer in early stage by CT images due to the lack of public training data set and powerful artificial intelligent models. In this work, we firstly build up a data set of CT images from 125 patients of lung cancer in early stage. The data set is enhanced by revolving, shifting and reproducing operations to avoid its inherent imbalance. After that, a deep convolutional neural network namely VGG16-T is proposed and multiple VGG16-T worked as weak classifiers are trained with a boosting strategy. Such method achieves significant performance in identifying pathological type of lung cancer with CT images by joint voting. Experiments conducted on the enhanced data set of CT images show that 3 weak classifiers VGG16-T are sufficient to achieve accuracy 86.58
- Copyright
- © 2020 The Authors. Published by Atlantis Press SARL.
- Open Access
- This is an open access article distributed under the CC BY-NC 4.0 license (http://creativecommons.org/licenses/by-nc/4.0/).
1. INTRODUCTION
Lung cancer is one of the most serious malignant tumors with the highest mortality rate [1]. There are about 1.8 million new lung cancer cases per year (13% of all tumors), 1.6 million deaths (19.4% of all tumors) in the world [2]. The 5-year survival rate is about 18% [3]. It is reported in [4] that if the type of lung cancer can be diagnosed and determined at an early stage, the 5-year survival rate of lung cancer patients can be increased to 70%.
Lung cancer can be mainly divided into small cell lung cancer (SCLC) or nonsmall cell lung cancer (NSCLC) by the degree of differentiation and morphological characteristics [5]. And there are three subtypes in NSCLC: squamous cell carcinoma [6], lung adenocarcinoma [7] and large cell carcinoma [8]. Lung adenocarcinoma has two different types of adenocarcinoma in situ and invasive lung adenocarcinoma. There are four pathological types of lung cancer in early stage. (1) Invasive adenocarcinoma is mainly wall-like growth, acinar, papillary and solid; (2) Adenocarcinoma in situ is a localized small adenocarcinoma with a lesion diameter of 3 cm or less; (3) Squamous cell carcinoma is with common feature lobulation; (4) SCLC is a lung mass growing along the long axis of the bronchus. CT images of the four pathological type of lung cancer are shown in Figure 1. Doctors mainly use handcrafted methods to classify lung cancer pathology by CT images and pathology. Accurate pathological type diagnosis of lung cancer in early stage is vital to assist doctors to make therapeutic regimen.
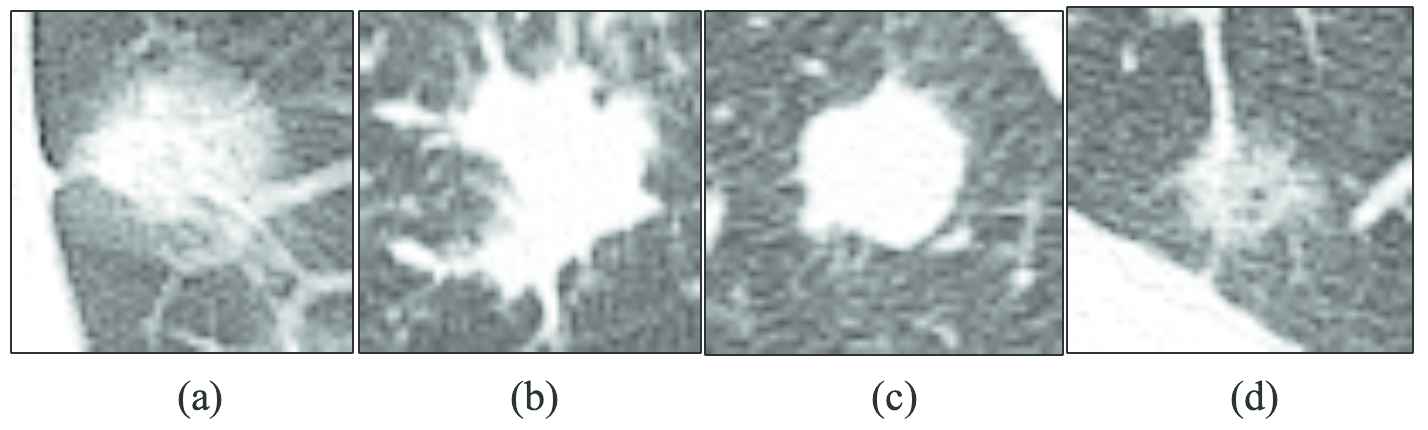
CT images of lung tumors: (a) invasive lung adenocarcinoma; (b) squamous cell carcinoma; (c) small cell lung cancer; (d) adenocarcinoma in situ.
In recent years, emerging imaging technology has provided a noninvasive solution to clinical problems, such as pathological classification [9], clinical staging and treatment effect evaluation of malignant tumors [10,11]. Artificial intelligence [12–14] for imaging omics can comprehensively analyze the heterogeneity of malignant tumors and avoid invasive trauma in biopsy [15]. It is proposed in [16] a neural network model achieves classification accuracy 78.7% to distinguish innocent and malignancy lung tumors. The accuracy is improved to 93.3% by texture features and artificial neural network (ANN) [17–19], and to 95% by using both texture and shape features [20,21]. Deep belief network is used for classification of malignancy of lung tumors with sensitivity 73.40% and specificity 82.20% [22]. In Kumar et al. [23], a stacked auto encoder, is proposed to distinguish innocent lung nodule from malignancy tumors with accuracy 75.01%. The accuracy achieves 86.84% to diagnose lung cancer on Lung Image Database Consortium (LIDC) database by multi scale two-layer Convolutional Neural Networks (CNN) [24].
However, it is still a challenge to identify the pathological type of lung cancer in early stage by CT images, due to the lack of public training data set and powerful artificial intelligent models [25–28]. In order to solve the above problems, this paper proposed a CT image classification method for early lung cancer based on convolutional neural network VGG16. The method mainly includes the following contents:
We firstly build up a data set of lung cancer by collecting CT images of 125 patients from Shandong Provincial Hospital. It contains 2219 CT images of lung cancer with pathological types determined clinically. We used rotation, translation and transformation methods to expand and balance our training data and classify malignant tumor into four categories: invasive lung adenocarcinoma, squamous cell carcinoma, SCLC and in situ lung adenocarcinoma.
A novel deep convolutional network, namely VGG16-T is proposed based on the main structure of VGG16 network in VGG-VD [29]. In view of the characteristics of the imbalance of each type of data in lung cancer CT images, the VGG16-T works as weak classifier and multiple VGG16-T networks are trained with boosting strategy. By joint voting, these weak classifier VGG16-T networks can obtain significant accuracy in identifying pathological type by CT images only. This provides an efficient, noninvasive detection tool for pathological diagnosis to lung cancer type.
Due to the large size difference between different types of images, it is necessary to obtain image features at different scales. Therefore, we designed the atrous convolution block and used it to replace the last three layers of the
2. MATERIALS AND METHODS
The overall architecture of identifying pathological type of lung cancer in early stage by CT images is shown in Figure 2. It starts by extracting the lesion information in various types of lung CT images from data set collected from Shandong Provincial Hospital, a grade 3A hospital in China. Training set is enhanced to balance the proportion of each type of CT images, and in some sense to avoid the overfitting problem. After that, VGG16-T neural network is proposed, and boosting strategy is applied to aggregate multiple classification results to improve the performance of classification method.
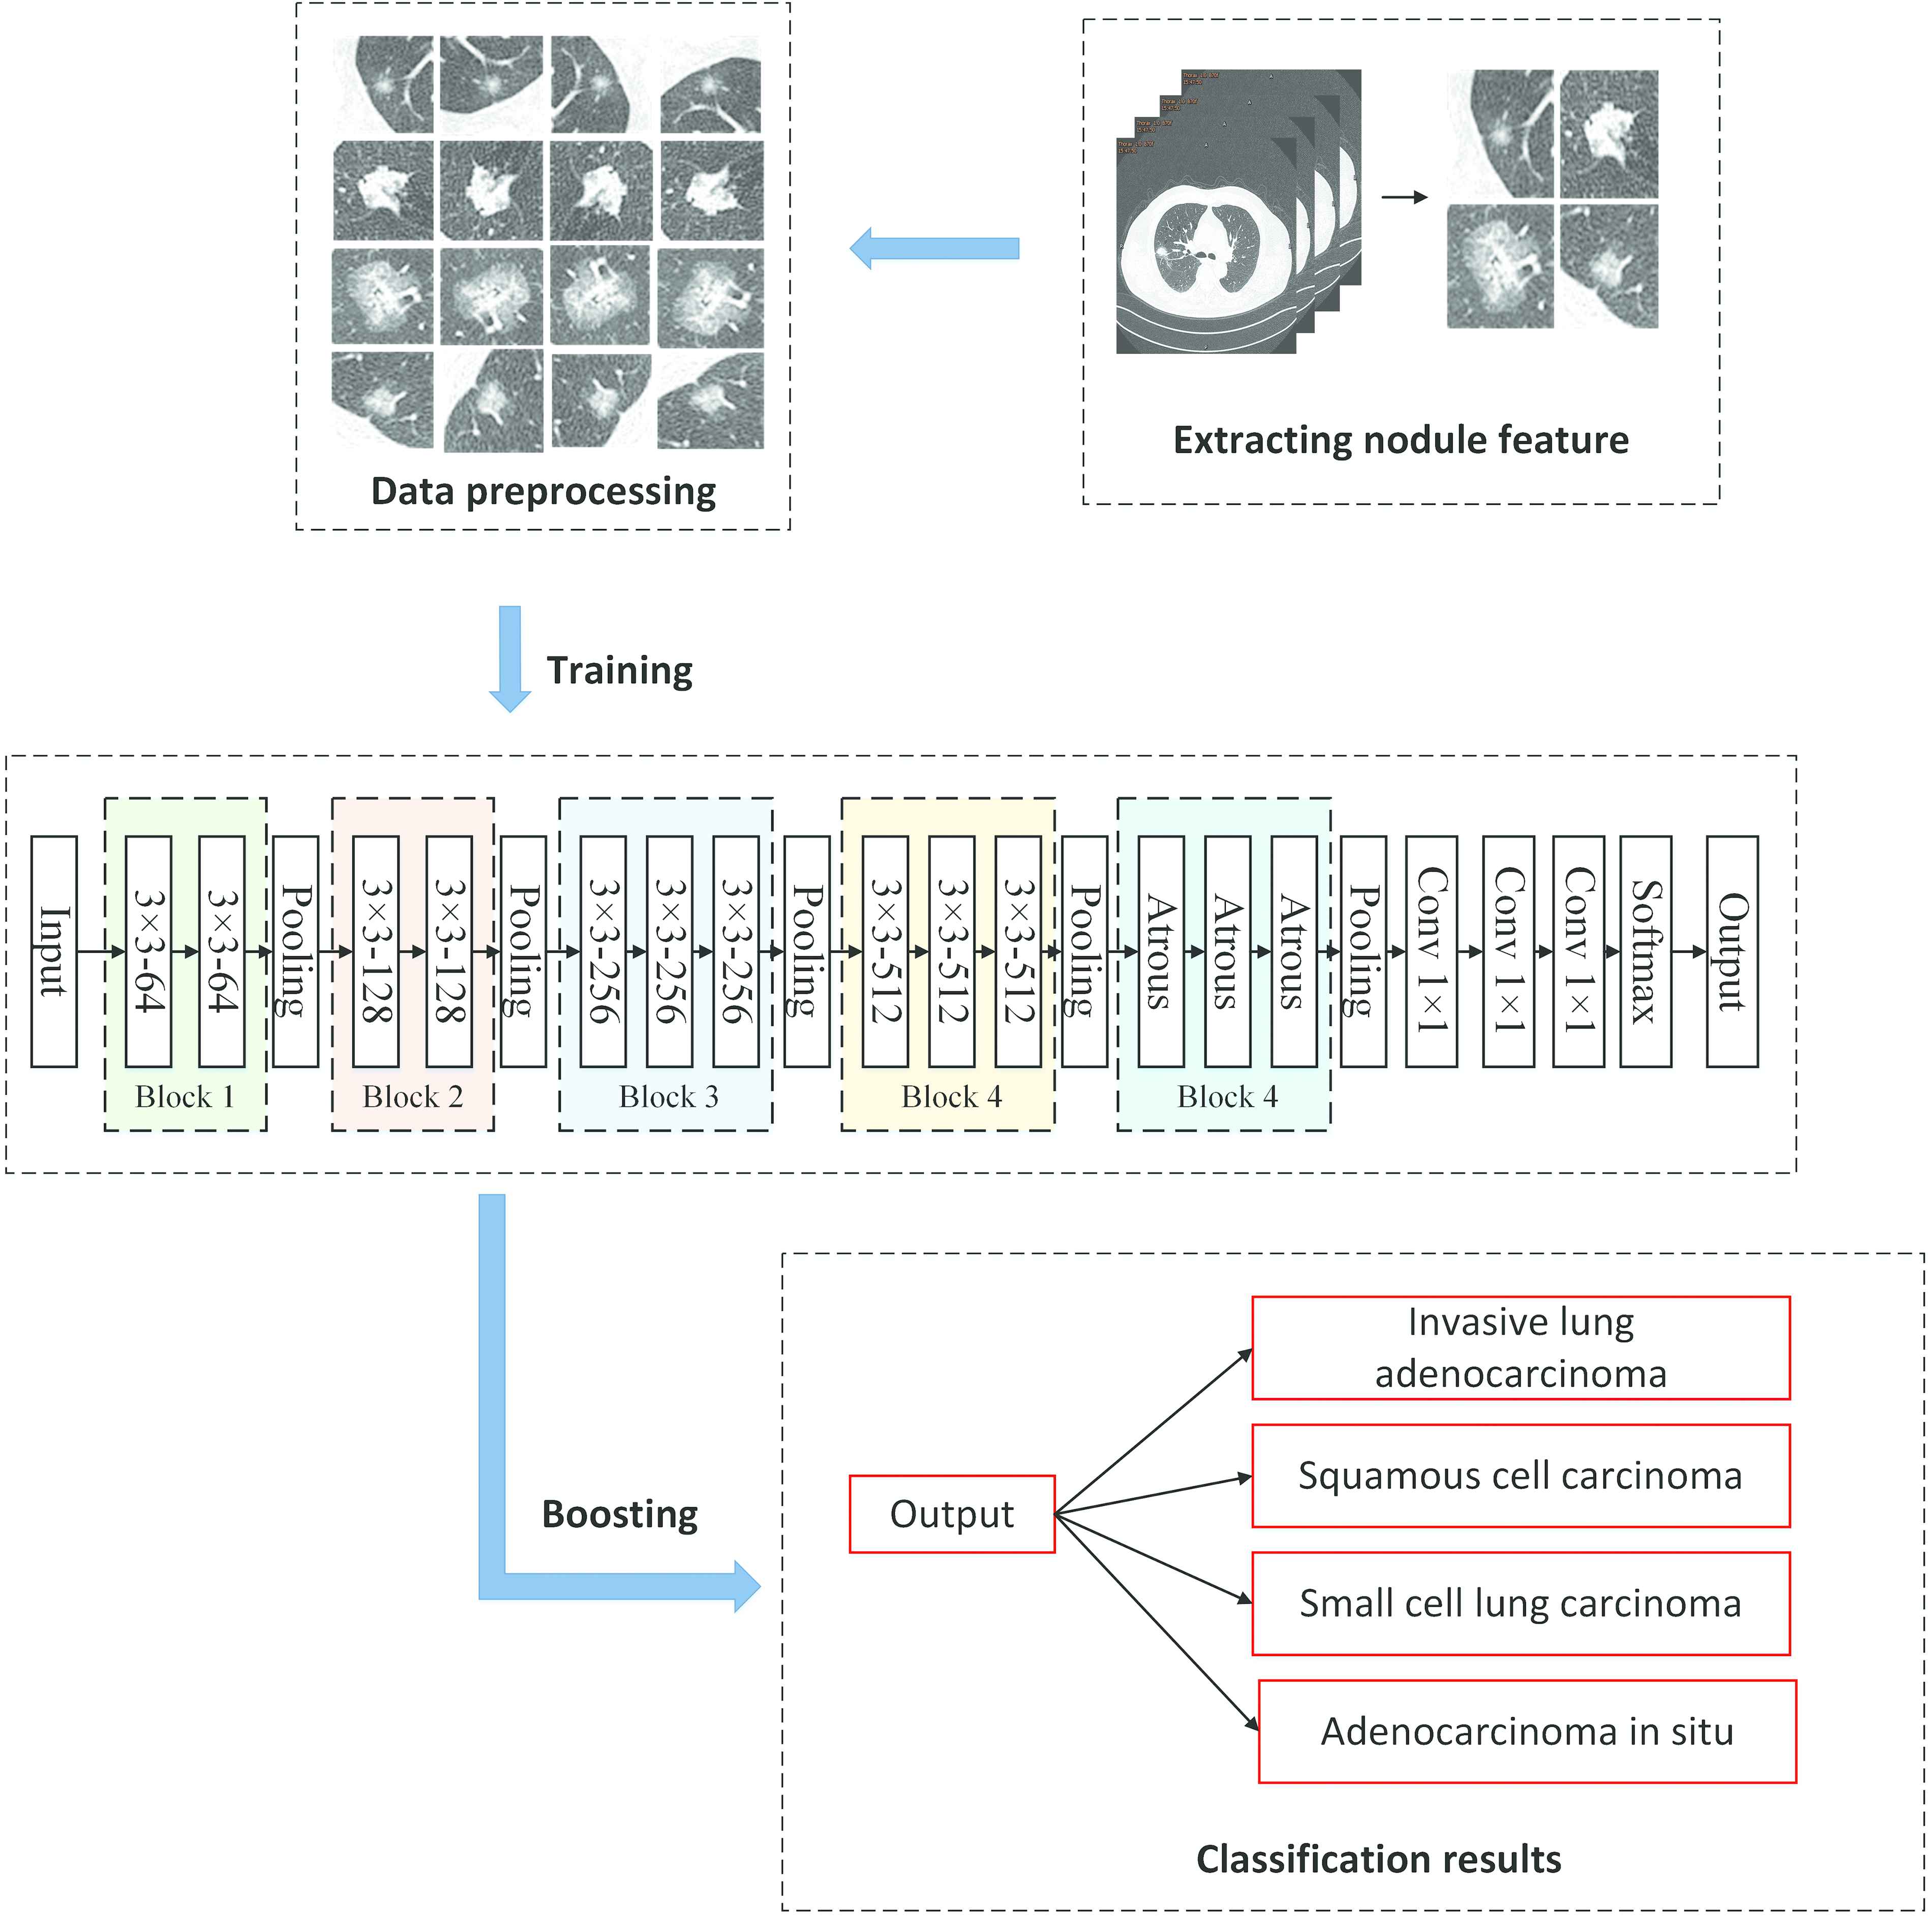
The architecture of our overall lung cancer classification method.
2.1. Data Set of CT Images
Our data set is firstly built by collecting 125 lung cancer patients in early stage ranging in 10 year from Shandong Provincial Hospital. There are in total 2219 CT images, including 1882 invasive lung adenocarcinoma, 140 squamous cell carcinoma, 96 SCLC and 101 in situ lung adenocarcinoma. The pathological type of lung cancer have been clinically determined by respiratory doctors and experienced radiologists. We randomly select 1332 images as training set, 443 images as test set and the remaining 444 images are used as Validation set. The specific distribution of CT images of four different types of lung cancer in the dataset is shown in Table 1.
| Class | Train Sets | Test Sets | Validation Sets |
|---|---|---|---|
| Invasive lung adenocarcinoma | 1129 | 376 | 377 |
| Squamous cell carcinoma | 84 | 28 | 28 |
| Small cell lung carcinoma | 58 | 19 | 19 |
| Adenocarcinoma in situ | 61 | 20 | 20 |
| Total | 1332 | 443 | 444 |
Distribution of four classes of CT images of lung cancer on datasets.
The pixel size and coarse granularity of different scanning surfaces scanned from multifarious medical devices are different. The common processing method is to resample at a fixed isomorphic resolution from the full data set. In our method, all the objects are sampled in
For small tumors, the context information is rich and provides a lot of tumor information to analyze.
For middle tumors, the amount of contextual information is suitable and no other noise information is included.
For large tumors, the main part of the tumors can also be contained with some redundant marginal regions excluded.
The training set is enhanced by image flipping and image rotation, which makes the network have better generalization effect. Image flipping is a random flip of the image in four aspects. Image rotation is a random rotation of the image at any angle (0-360 degrees). Among the four types of lung cancer data, the category with less data is enhanced multiple times. After data enhancement, the training set is increased from the original 1332 to 50,000 CT images.
2.2. The VGG16-T Neural Network
VGG network contains three shallow CNNs (VGG-F, VGG-M and VGG-S) and a deep network VGG-VD [29]. VGG-VD is composed by VGG-16 (with 13 convolutional layers and 3 FC layers) and VGG-19 (with 16 convolutional layers and 3 FC layers). The VGG network can do image processing well by rapidly approximating the target function and abstracting significant feature representations.
VGG16 performs well in diagnosing CT images, so we choose it as the main structure in our model. We propose a novel deep convolutional network architecture, namely VGG16-T. VGG16-T consists of five convolution blocks and its network structure is shown in Figure 3.
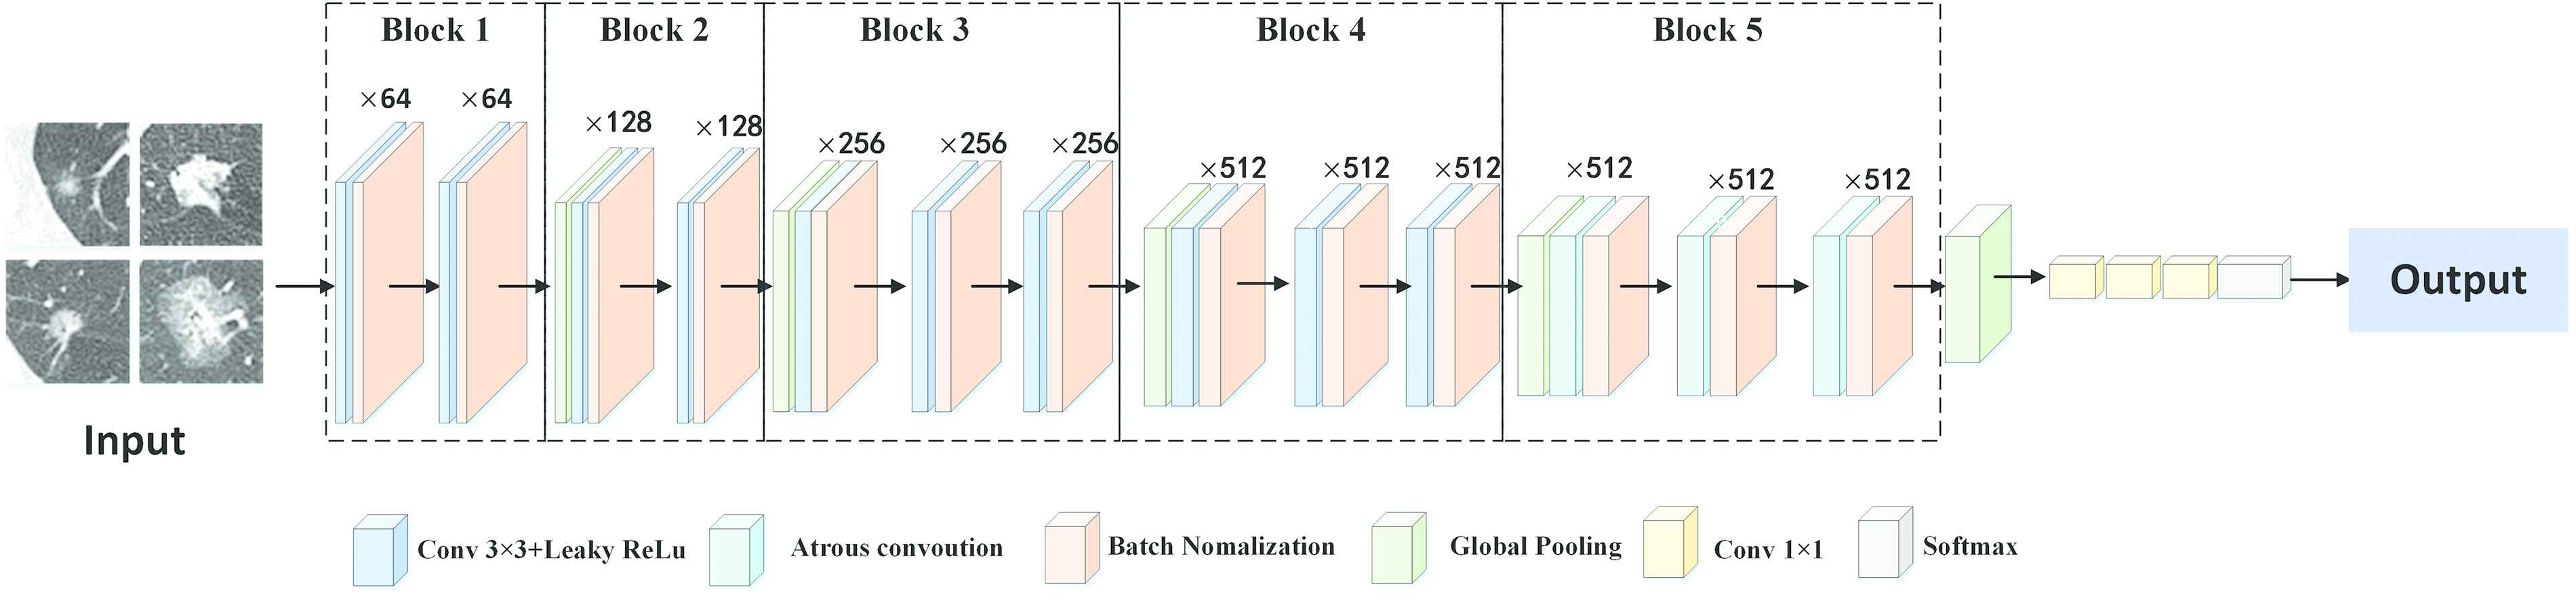
Schematic illustration of the VGG16-T.
VGG16-T uses small convolution kernels of size
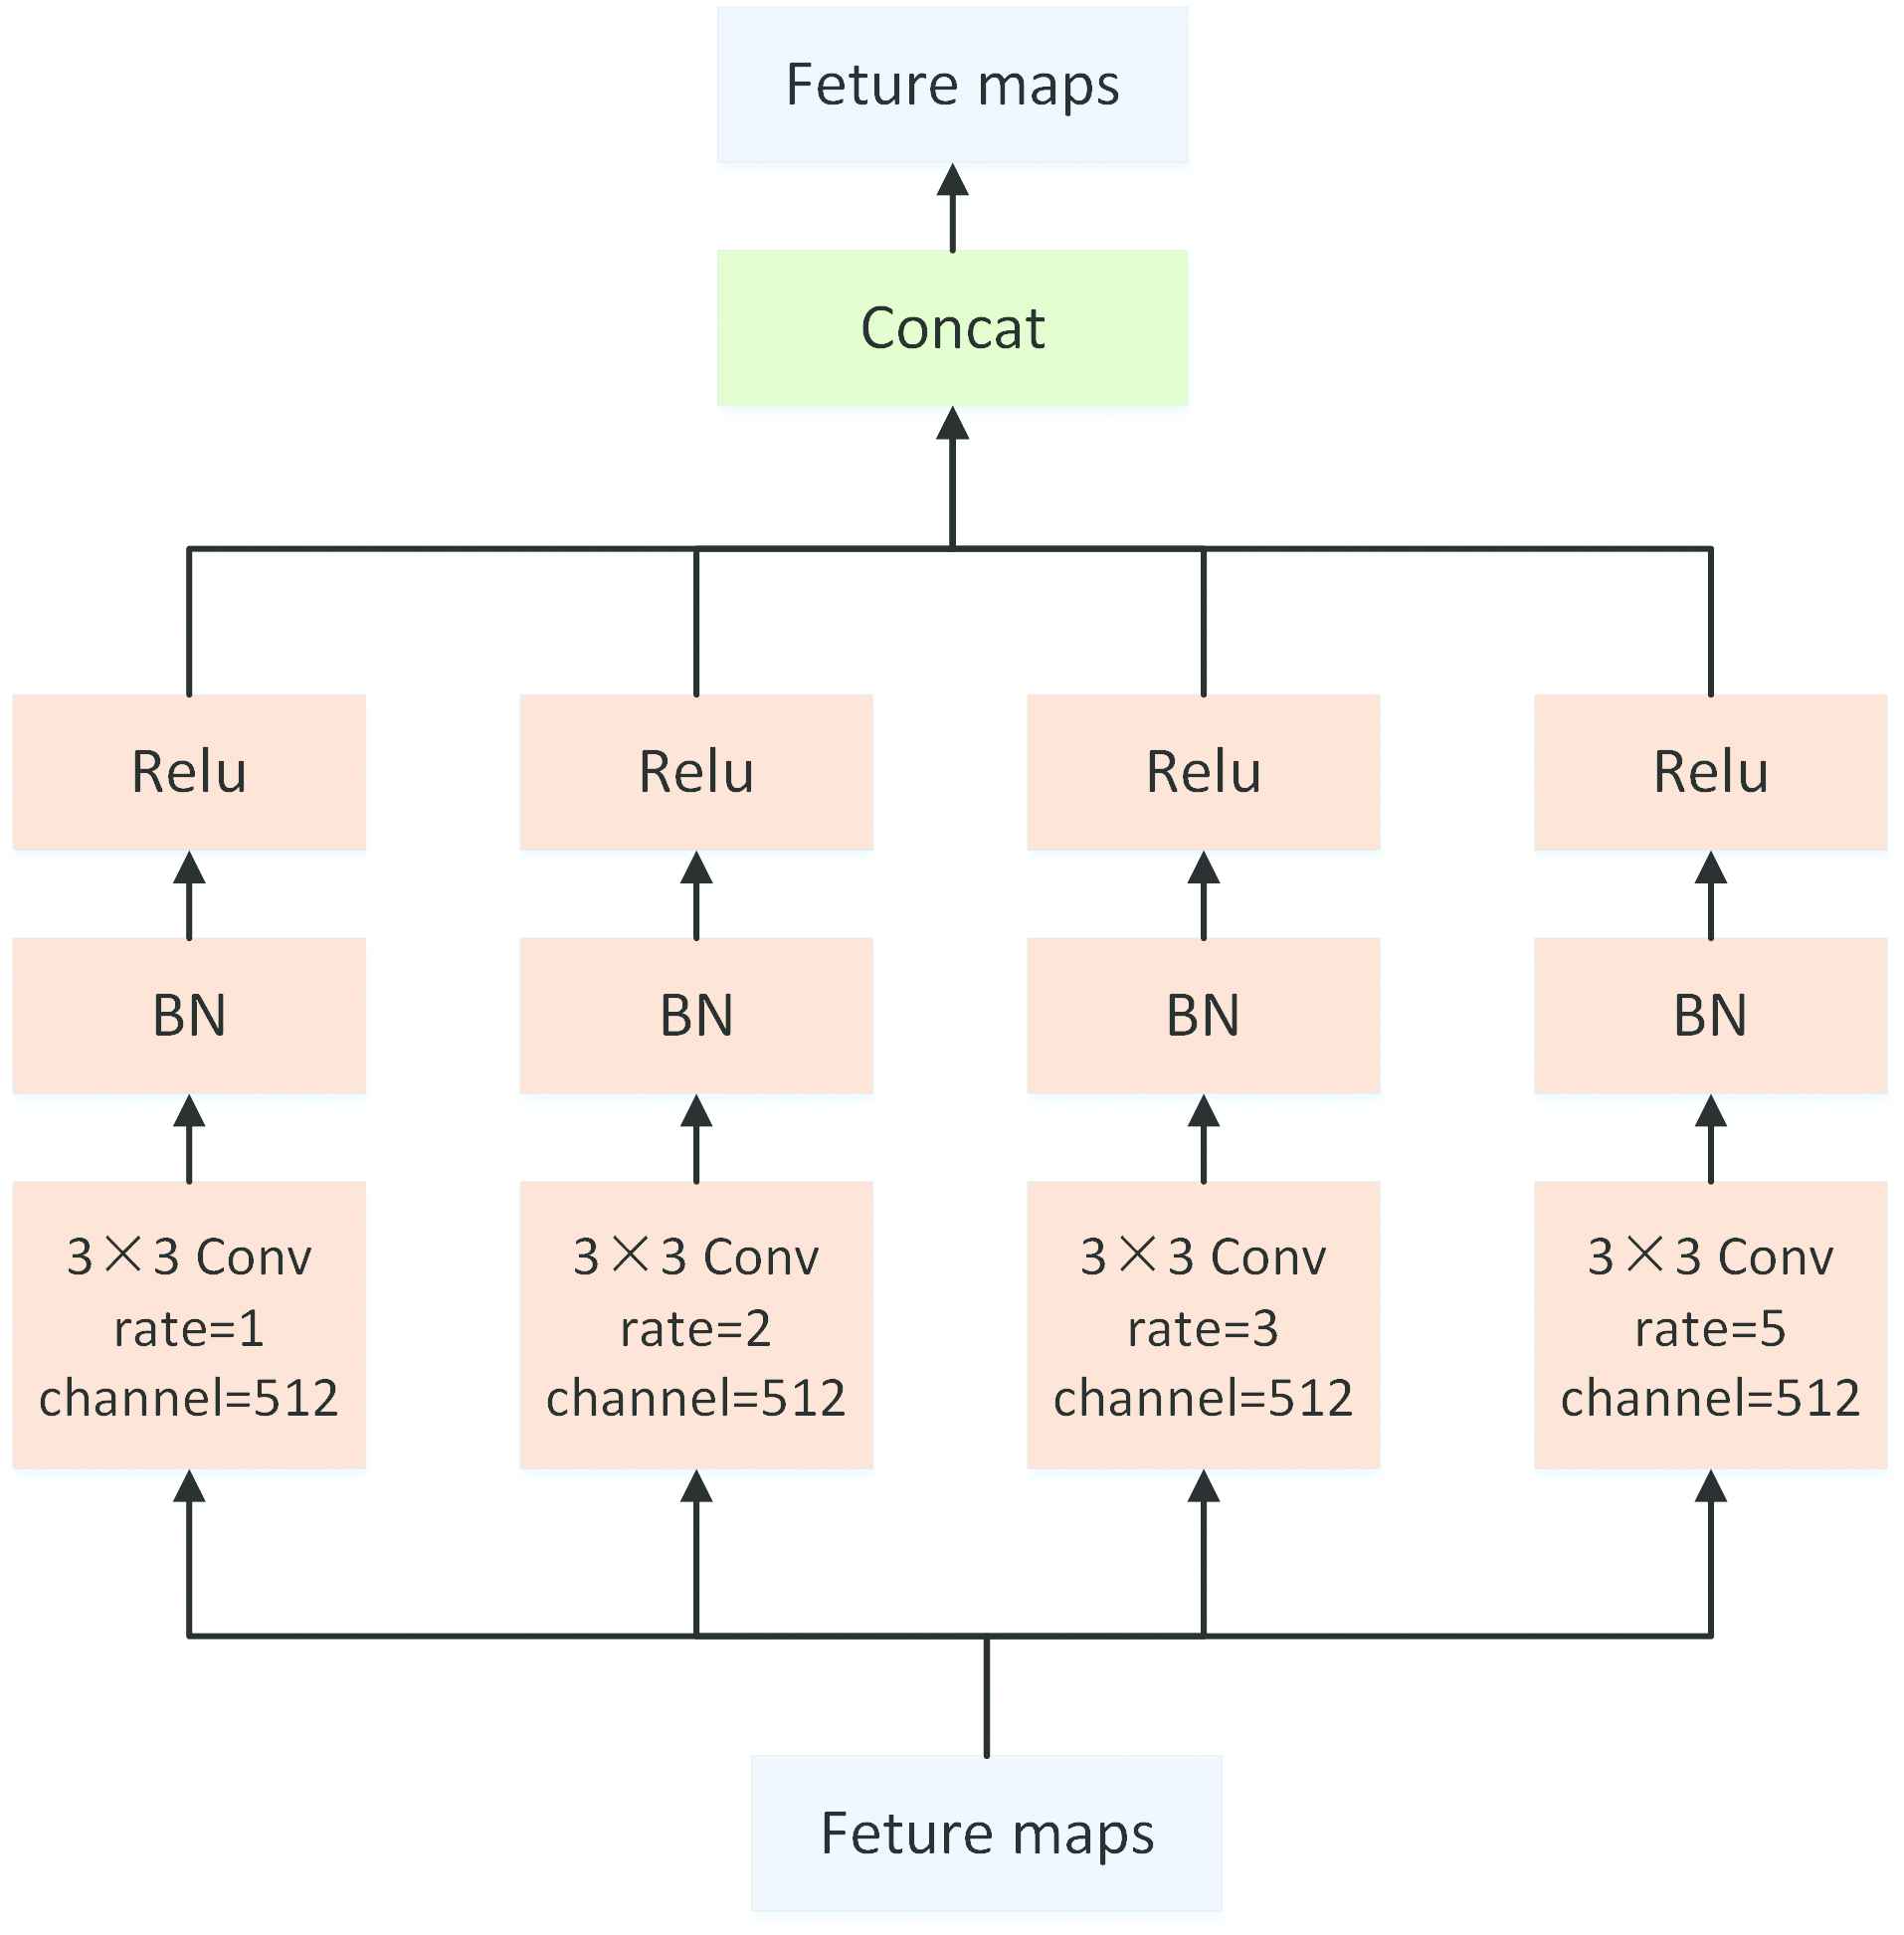
The structure of the atrous convolution block.
The essence of the atrous convolution block is that the input data enters four branches for parallel calculation. The four branches use the same number of convolution kernels. The first branch uses a standard
Since our picture size is
Leaky ReLU activation function is used in the network. BN [30] is applied between the layers of the network. By BN, it makes features of different dimensions to have a certain comparison in value, greatly improves the accuracy and convergence speed as well as prevent gradient explosion in some degree. We use global pooling instead of the original max pooling. Global pooling layer can greatly reduce the total amount of parameters of the model and improve the detection speed.
We avoid the overfitting problem of VGG16-T network from the following aspects:
Iteration truncation can in some degree prevent overfitting. The iteration is stopped before the model converges to the training data set. Accuracy is calculated at the end of each Epoch. If in consecutive 10 epochs (or more times) the model is failed to reach the best accuracy, the iteration should stop.
VGG16-T networks are pretrained on the public lung cancer medical image data set Luna16. Through pretraining, the network avoids the occurrence of overfitting on our data set and alleviates the problem of small amount of data in the data set.
2.3. The Boosting Strategy
The main motivation of using boosting strategy is the fact that our collected data set of lung cancer in early stage is quite imbalance. Specifically, there are 1882 samples of invasive lung adenocarcinoma, and 337 CT images of the other three types. Single classifier is inclined to become overfitting to the samples of large size. The idea of boosting is training multiple weak classifiers make decisions by joint voting. It needs to determine the number of weak classifiers.
After each round of training, we increase the possibility of selecting misclassified samples in the next round training. It is repeated until the number of classifiers reaches an acceptable accuracy with
Boosting strategy will increase the accuracy at the beginning of increasing the number of classifiers. When a large number of weak classifiers are used, it will not increase the accuracy indefinitely and cause overfitting. In our experiments, it is found that 3 weak classifiers are sufficient to form a strong classifier, which significantly improves the performance of the classification.
Each model is based on the architecture of VGG16-T. The training subset is divided into three parts. Each part is independently trained as a weak classifier. The general process of boosting is described in Algorithm 1.
After data enhancement by rotation and flipping, the training set is enlarged to have 50,000 CT images. We randomly select 1/3 samples of the data to train the first weak classifier VGG16-T. Samples misclassified by the first weak classifier and another randomly selected samples (in total 1/3 samples of the whole training set) are combined to train the second weak classifier VGG16-T. Similarly, the third weak classifier is independently trained by samples misclassified by the two classifiers and a randomly selected ones (in total 1/3 samples of the training set). Taking each misclassified sample of previous round as the training data for the next model and increasing the number of misclassified training data can in essence be understood as increasing the weight of these erroneous samples. We can fine tune the weight parameters for training the next weak classifier VGG16-T, which can learn more representative features.
Those misclassified data can relieve the imbalance in some degree. More representative and discriminating samples are selected for training and testing, which can enhance the robustness of the model. An overview of the proposed model is shown in the Figure 5.
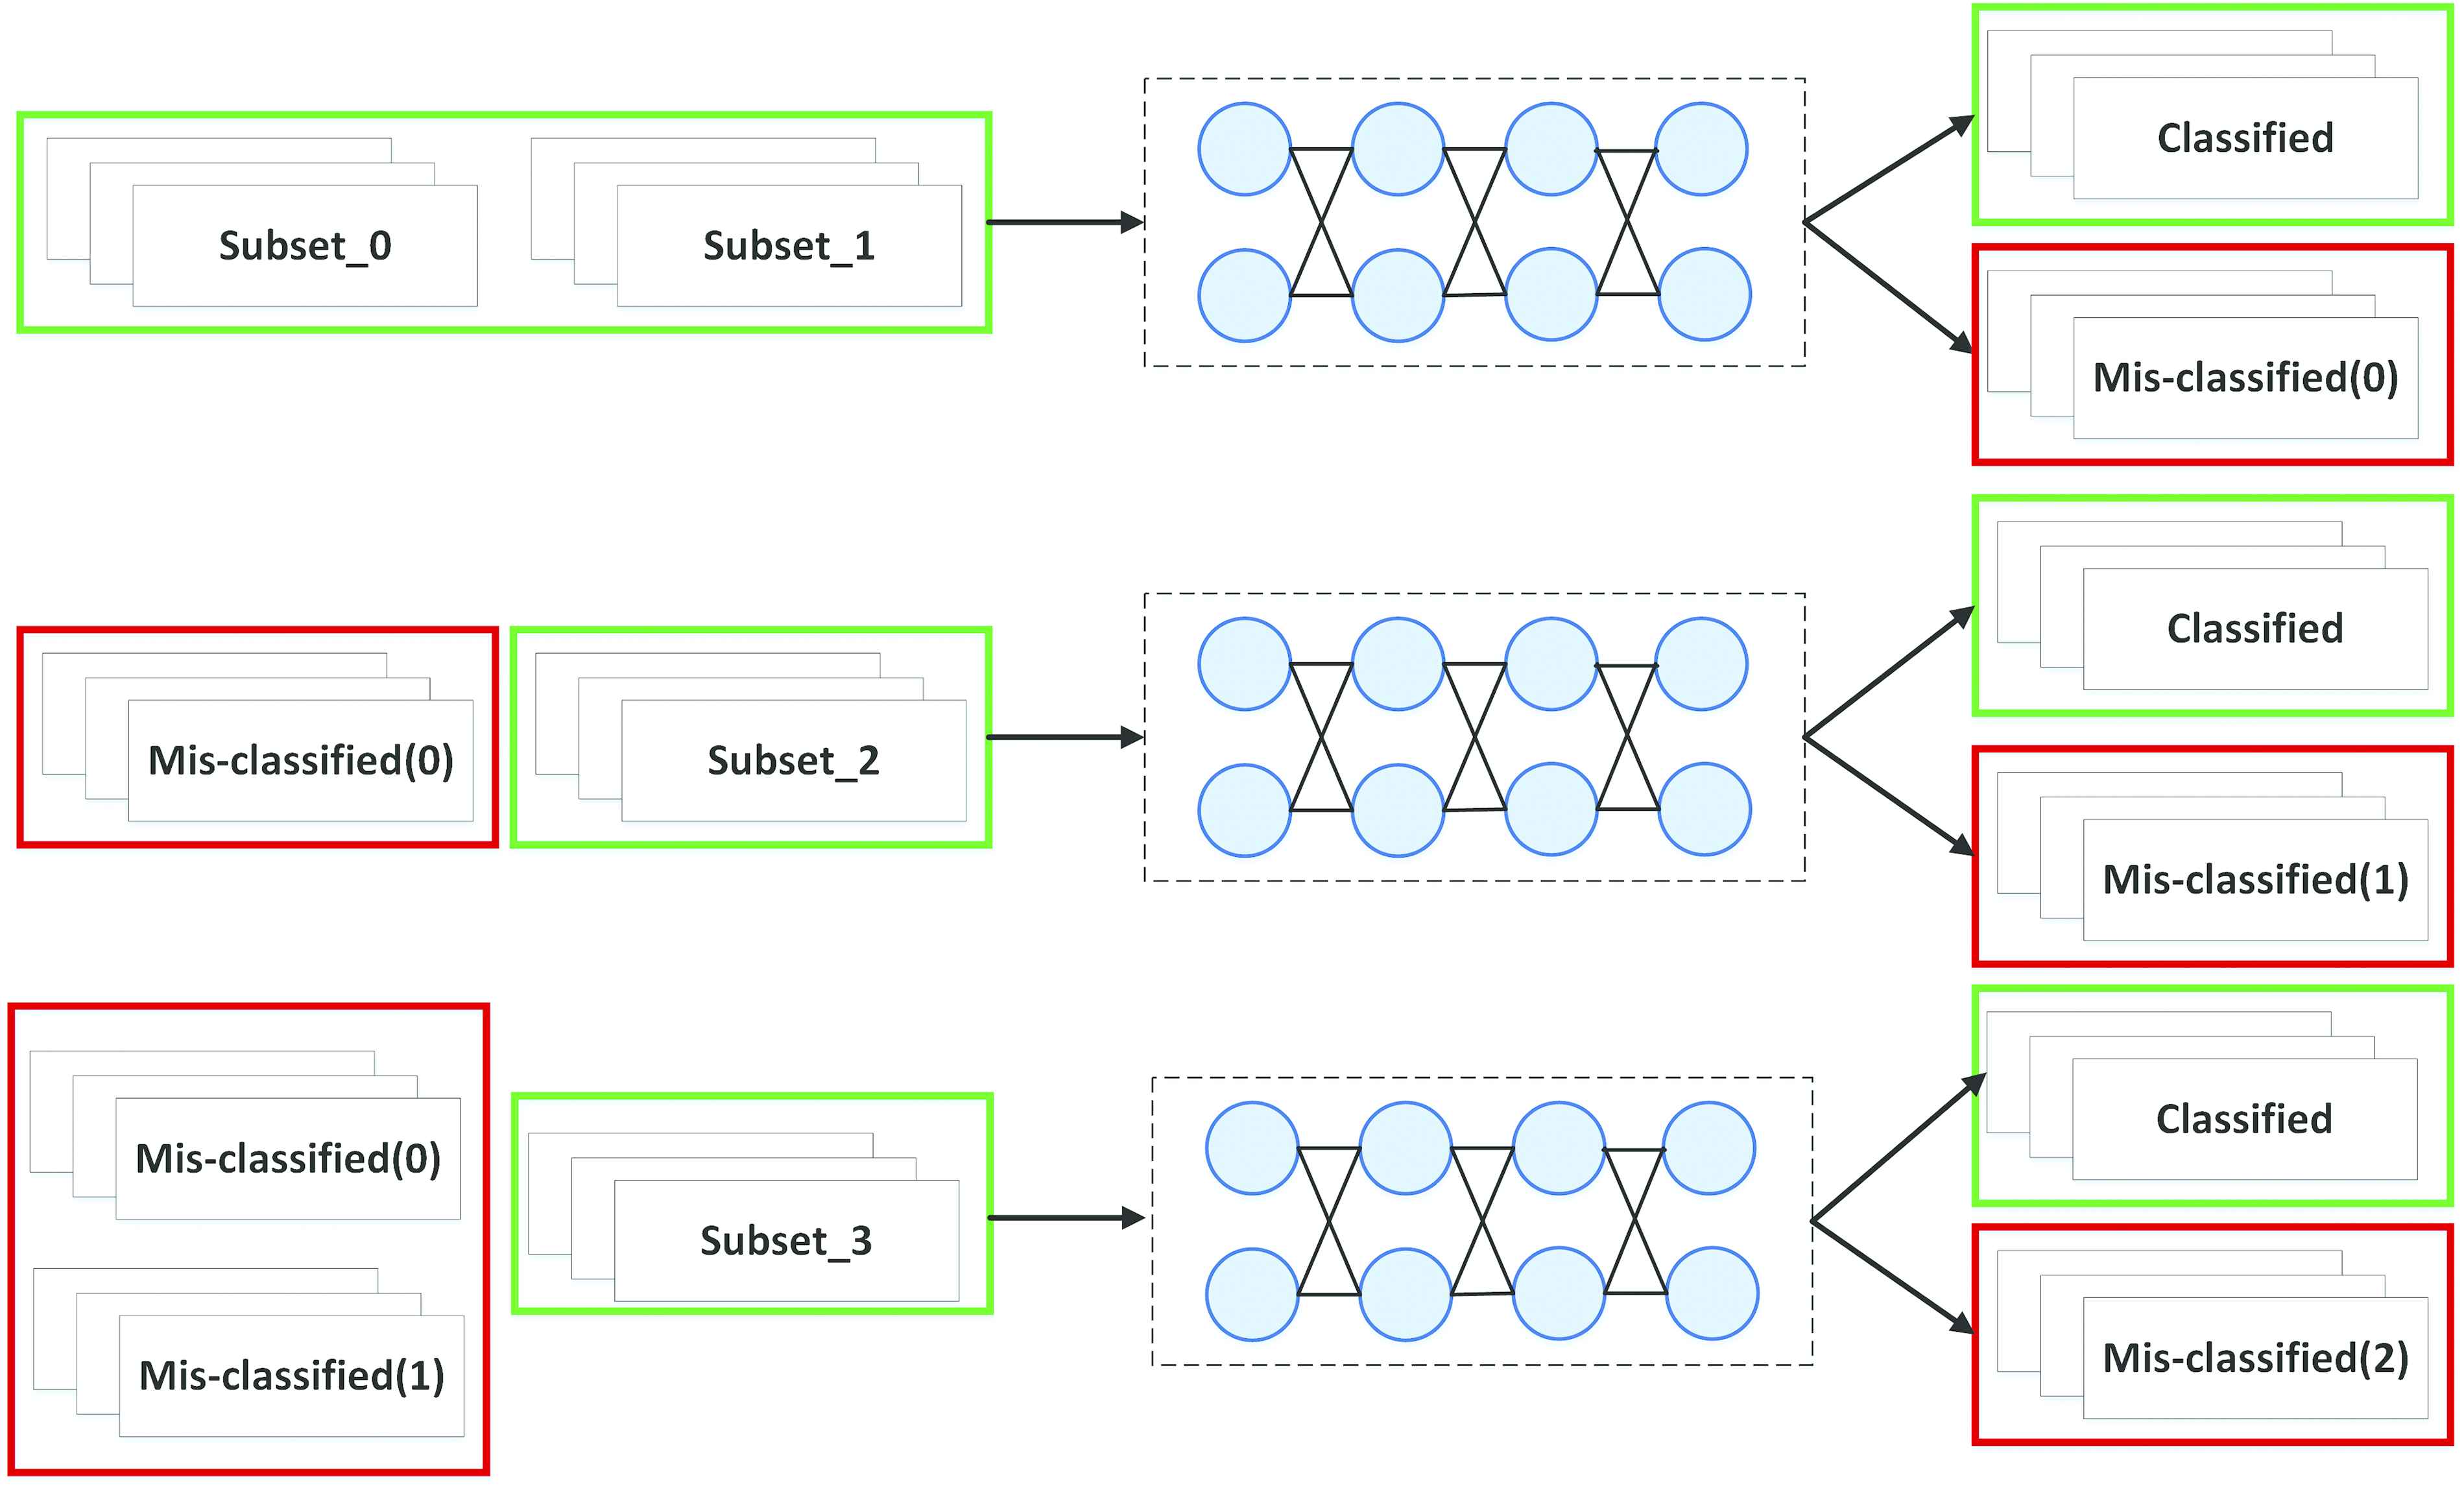
The architecture of the proposed boosting method.
In Figure 5, the topmost weak classifier is trained by the filtered data sets. The error data (mis-classified (0)) of the first model in the red rectangle box and the new training data are merged to train the second weak classifier. The bottom model parameter is optimized by using the erroneous data from first two models and other new data. For false positive (FP) reduction, boosting is a commonly used statistical learning method combined with the idea of enhanced classifiers. The classifiers are linearly combined to improve the classification performance by assigning different weights of the training sample.
Algorithm 1: The boosting based false positive reduction.
Input: Weak classifiers VGG16-T and training set
1: Initializing the size
2: Training the second weak classifier by misclassified samples and newly selected samples;
3: Training the third weak classifier by misclassified samples and newly selected samples;
4: The category of each sample is decided by majority vote of three weak classifiers;
Output: Classification results
2.4. Weighted Softmax Function
Softmax classifier is a generalization of the logistic model on multi-classification problems, which divides target variables into multiple classes. We use softmax classifier for pathological type feature recognition of lung cancer from CT images.
It is assumed there are
The loss function
Unbalanced training samples may cause the training model to focus on the categories with a large number of samples. Generalization ability of the model on test data should be affected. By setting the weight coefficient
3. RESULTS
Experimental results show that VGG16-T with boosting achieves accuracy 86.58
3.1. Evaluations Metrics
The confusion matrix shown in Table 2 is used to predict the classification model. Corresponding to the confusion matrix, the larger the values of true positive (TP) and true negative (TN), the smaller the values of FP and false negative (FN), the better the performance.
| Label | The Prediction Is Positive Sample | The Prediction Is Negative Sample |
|---|---|---|
| Label is positive sample | TP (true positive) | FN (false negative) |
| Label is negative sample | FP (false positive) | TN (true negative) |
Confusion matrix table.
The accuracy is a statistical measure of how well a classifier correctly identifies or excludes a condition [33]. The accuracy is the proportion of true results (both TP and TN), which is defined as Equation (5).
The sensitivity is the proportion of the model's predicted accuracy among all the results with real positive values, which is defined as Equation (6).
The specificity is the proportion of all outcomes where the true value is Negative that the model predicts correctly, which is defined as Equation (7).
In Equations (5–7), parameter
3.2. Parameters of VGG16-T
Our model used a NVIDIA GTX 2080Ti 12Gb GPU for training and testing. During the training, we adopt mini-batch SGD with batch size 16, momentum 0.9 and weight decay 0.0005. We use the “poly” learning rate policy where the learning rate is multiplied by
Since our picture size is
| Name | Filter | Feature Map | Weights | Biases |
|---|---|---|---|---|
| Input | ||||
| Conv3-64 | ||||
| Conv3-64 | ||||
| Conv3-128 | ||||
| Conv3-128 | ||||
| Conv3-256 | ||||
| Conv3-256 | ||||
| Conv3-256 | ||||
| Conv3-512 | ||||
| Conv3-512 | ||||
| Conv3-512 | ||||
| Atrous | ||||
| Atrous | ||||
| Atrous | ||||
| Conv |
||||
| Conv |
||||
| Conv |
||||
| Total |
The parameters of VGG16-T.
3.3. Experimental Results
An independent data set used to compare the performance of VGG16-T before and after the data enhancement. In training set, we have in total 50,000 CT pictures by data augmentation from 1998 original CT images. It is obtained that the accuracy, sensitivity and specificity can reach 86.58%, 86% and 72.63% after data enhancement over 5 runs. The experimental results are shown in Table 4.
| Model | Accuracy | Sensitivity | Specificity |
|---|---|---|---|
| VGG16-T | |||
| Without data enhancement | |||
| VGG16-T | |||
| With data enhancement |
Comparison of accuracy, sensitivity and specificity before and after data enhancement over 5 runs.
It is experimentally determined that 3 weak classifiers VGG16-T are sufficient. The change in accuracy after adding each weak classifier for joint voting is shown in Table 5. It is obtained that the accuracy rate is improved after using the third weak classifier compared with the first two. If scale of the data set is larger, we can increase the number of weak classifiers and determine how many classifiers needed to achieve acceptable classification performance.
| Classifier | Classifier 1 | Classifier 2 | Classifier 3 |
|---|---|---|---|
| Accuracy |
The change in accuracy after using each classifier over 5 runs.
In Table 6, it is shown the precision, recall and F1-score of the four lung cancers after data enhancement with confusion matrix. We performed BN during training to greatly increase the training speed and reduce the strong dependence on initialization. The real-time variation accuracy and loss graph of each epoch with data enhancement are shown in Figures 6 and 7. Among them, the axis X refers to the change of epochs, and axis Y refers to the accuracy and loss value. A total of 100 epochs were trained. The blue and red curves represent training and validation curves, respectively. The loss of training gradually stabilized after 20 epoch. The loss of verification stabilized after 40 epoch. The accuracy of training and verification gradually increased and finally gradually approached 0.9.
| Type | Invasive Lung | Squamous Cell | Small Cell Lung | Adenocarcin-oma in Situ |
|---|---|---|---|---|
| Adenocarcinoma | Carcinoma | Carcinoma | ||
| Precision | 0.9672 | 0.8888 | 0.6000 | 0.6400 |
| Recall | 0.8551 | 0.9231 | 0.9000 | 0.7619 |
| F1-score | 0.9078 | 0.9057 | 0.7200 | 0.6956 |
After data enhancement in each of the four types of lung cancer accuracy.
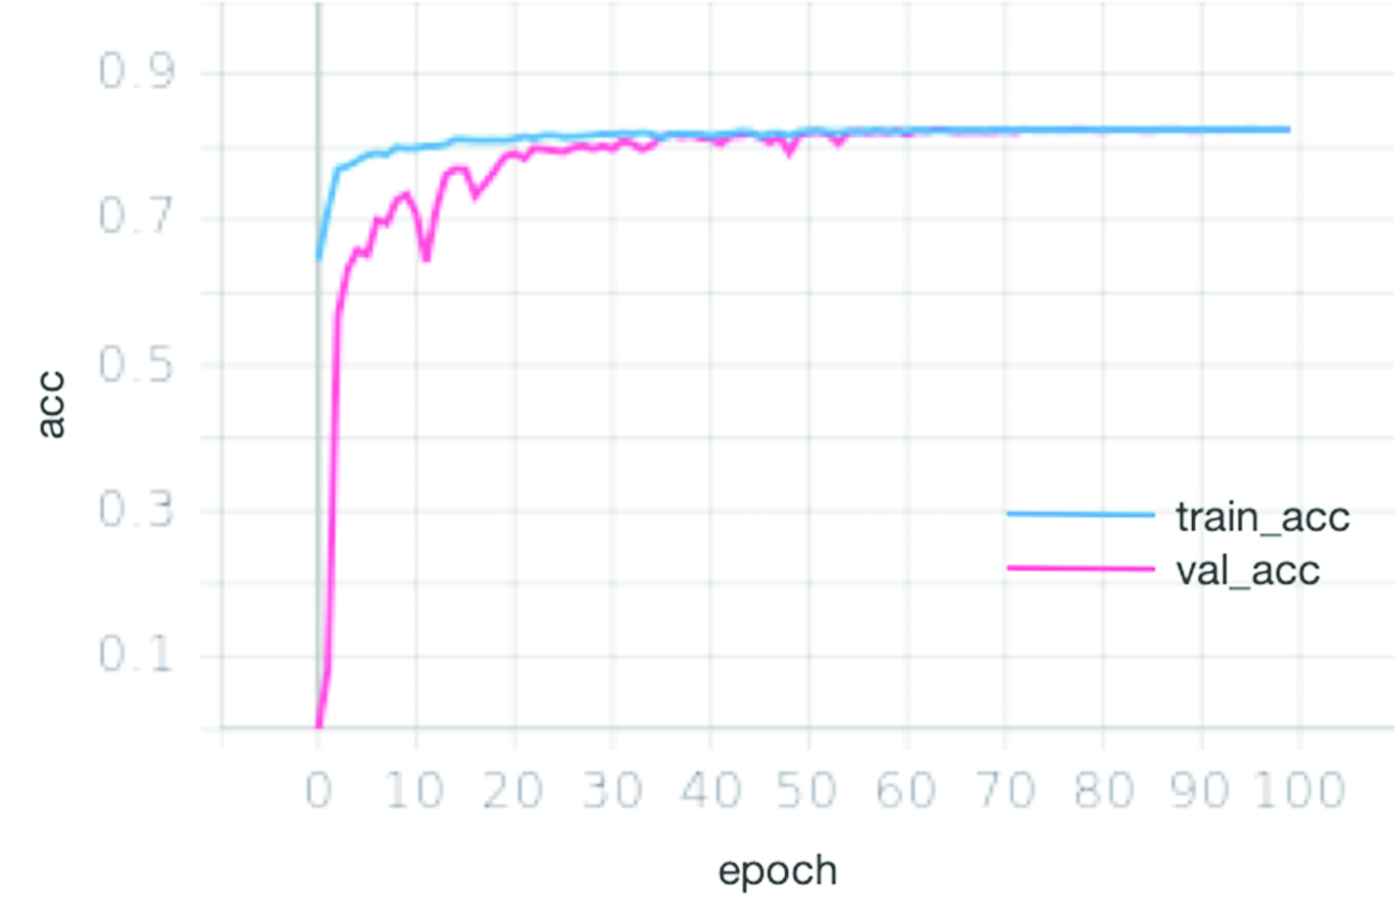
The real-time variation accuracy graph of each epoch with data enhancement.
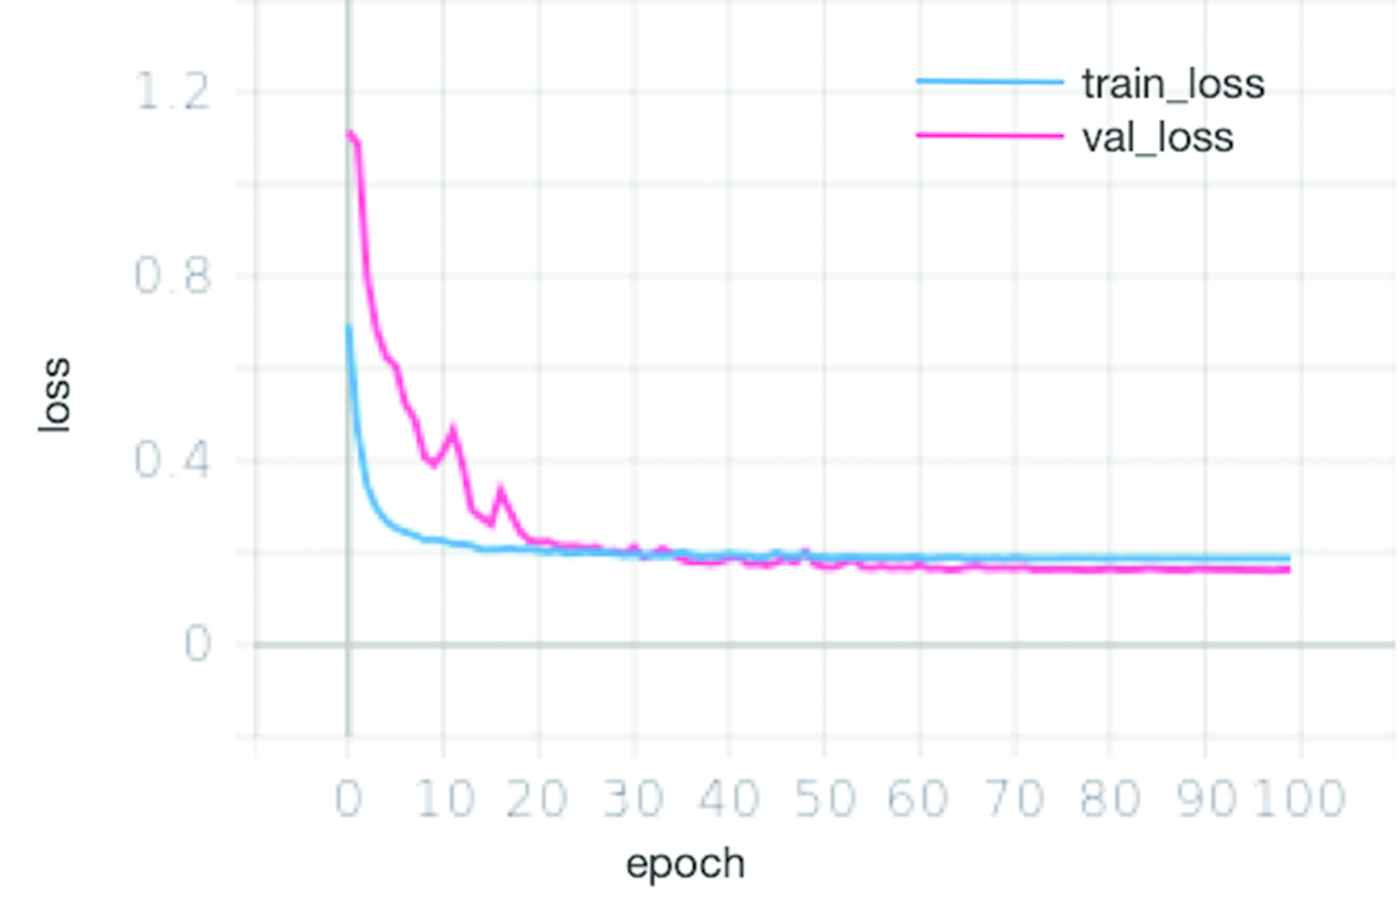
The real-time variation loss graph of each epoch with data enhancement.
In order to verify our method, three image classification models AlexNet, ResNet-34 and DenseNet were selected for comparative experiments. The performance of our method was compared by using two training strategies (weight setting and no weight setting). W represents the weight of the different categories set in training process. The classification methods other than VGG16-T are compared based on the source codes provided by AlexNet [34], ResNet-34 [31] and DenseNet [32]. The method of comparison experiment is the same as our VGG16-T using the same parameter settings and data set.
Experimental results on the two training strategies are shown in Table 7, where
| Method | Accuracy |
|---|---|
| AlexNet | |
| AlexNet+w | |
| ResNet-34 | |
| ResNet-34+w | |
| DenseNet | |
| DenseNet+w | |
| VGG16-T | |
| Our VGG16-T with boosting |
Accuracy on our dataset over 5 runs.
When the weight is not set, the accuracy of the model is higher than that of the other models, indicating the effectiveness of the proposed method. Comparing the results of setting weights and not setting weights for each type of method, the accuracy rate is improved except for ResNet-34. We can indicate that setting weights can alleviate the category imbalance problem to some extent.
Two respiratory doctors from Shandong Provincial Hospital and Shandongthe Third Provincial Hospital (Grade 3A level hospitals) are invited to do handcrafted diagnosing of 20 randomly selected CT images of lung cancer type, achieving accuracy 55% and 65%, respectively. Our VGG16-T with boosting make separate judgments and get accuracy 85% shown in Table 8. The accuracy rate and time cost of VGG16-T and the two doctors are shown in Table 9. Our method can make a decision on each CT image in about 1.3 seconds, but the doctors need about 88.5 seconds on average.
| Number | 1 | 2 | 3 | 4 | 5 | 6 | 7 | 8 | 9 | 10 |
|---|---|---|---|---|---|---|---|---|---|---|
| Truth | SCC | SCLC | SCC | AIS | IA | IA | IA | IA | AIS | AIS |
| Test | SCC | SCC | SCC | AIS | AIS | IA | IA | IA | AIS | AIS |
| Number | 11 | 12 | 13 | 14 | 15 | 16 | 17 | 18 | 19 | 20 |
| Truth | IA | IA | IA | IA | IA | SCC | IA | IA | IA | SCC |
| Test | IA | IA | IA | IA | IA | SCLC | IA | IA | IA | SCC |
IA, invasive adenocarcinoma; AIS, adenocarcinoma in situ; SCC, squamous cell carcinoma; SCLC, small cell lung cancer.
The results of 20 tests on the computer.
| Doctor 1 | Doctor 2 | Average of Doctors | VGG16-T | |
|---|---|---|---|---|
| Accuracy | 0.65 | 0.55 | 0.60 | 0.85 |
| Time of diagnosing an image | 76s | 101s | 88.5s | 1.3s |
Accuracy and times cost by VGG16-T and two doctors for diagnosing 20 randomly CT images.
4. DISCUSSION
In this work, we firstly build up a data set of CT images from 125 patients of lung cancer in early stage. The data set is enhanced by revolving, shifting and reproducing operations to avoid its inherent imbalance. After that, a deep convolutional neural network namely VGG16-T is proposed and multiple VGG16-T worked as weak classifiers are trained with a boosting strategy. Such method achieves significant performance in identifying pathological types of lung cancer with CT images by joint voting. It is the first attempt of using deep models and boosting to identify pathological types of lung cancer in early stage from small scale CT images.
There are some potential directions for further research. It is of interests to improve the accuracy of lung cancer typing, which can be further studied. As well, more contextual information about the tumor can be fused, such as the connections with the surrounding blood vessels, as well as information about the patient, such as the medical history report. Future research may require the use of images from different sources in training and test datasets so that the system has a universal use.
5. CONCLUSION
This paper proposed a new effective CT classification method based on VGG16-T. For the first stage, we introduced a classification framework based on improved VGG16-T to accommodate lung cancer typing. For the second stage, a boosting based classifier is trained to reduce FPs produced by the first stage. Three models are trained sequentially, and the training data of each model includes the mis-classified tumors by the previous model. A more accurate model is obtained by repetitively training tumors which are more difficult to classify. Finally, the weight of the softmax loss function is set, and the loss of a few types of discriminant errors is increased to alleviate the category imbalance problem of the dataset. Experiments on the respiratory dataset of Shandong Provincial Hospital show that the method can classify lung cancer accurately.
COMPETING INTERESTS
The authors declare that they have no competing interests.
AUTHORS' CONTRIBUTIONS
Shanchen Pang designs framework of the work; Tao Song and Fan Meng make the data experiments and manuscript writing; Xun Wang completes the data analysis and interpretation; Xingguang Wang constitutes data collection; Jianmin Wang and Xiaochun Cheng are responsible for literature search and research design. All authors read and approved the final manuscript.
ACKNOWLEDGMENTS
The authors would like to thank the editor and the anonymous reviewers for their constructive comments and suggestions, which improve the quality of this paper. This data collection work is supported by grants from National Natural Science Foundation of China (Nos. 61572523, 61873281, 61873280 and 61672033) and Natural Science Foundation of Shandong Province (No. ZR2019MF012). The analysis and simulation is supported by Fundamental Research Funds for the Central Universities (18CX02152A and 19CX05003A-6) and Taishan Scholarship (No. tsqn201812029). The theoretical investigation is supported by grants from National Natural Science Foundation of China (Nos. 61672248, 61502535 and 61972416).
REFERENCES
Cite this article
TY  - JOUR
AU  - Shanchen Pang
AU  - Fan Meng
AU  - Xun Wang
AU  - Jianmin Wang
AU  - Tao Song
AU  - Xingguang Wang
AU  - Xiaochun Cheng
PY  - 2020
DA  - 2020/06/18
TI  - VGG16-T: A Novel Deep Convolutional Neural Network with Boosting to Identify Pathological Type of Lung Cancer in Early Stage by CT Images
JO  - International Journal of Computational Intelligence Systems
SP  - 771
EP  - 780
VL  - 13
IS  - 1
SN  - 1875-6883
UR  - https://doi.org/10.2991/ijcis.d.200608.001
DO  - 10.2991/ijcis.d.200608.001
ID  - Pang2020
ER  -