
Fuzzy Load Forecast with Optimized Parametric Adjustment Using Jaya Optimization Algorithm

- DOI
- 10.2991/ijcis.d.200617.002How to use a DOI?
- Keywords
- Advanced fuzzy load forecasting model; Hybrid fuzzy-MJO load forecasting algorithm; Minimal total energy error; Minimal peak energy error; Modified Jaya optimization (MJO) algorithm
- Abstract
This paper proposes an advanced fuzzy load forecast method optimized by modified Jaya optimization (MJO) algorithm. MATLAB® platform is used to implement the proposed hybrid Fuzzy-MJO load forecasting algorithm and to verify the outperforming features of a Jaya technique over a fuzzy load forecast model. The novel Fuzzy-MJO load forecasting systems uses the day-time and the daily power consumption to efficiently predict the forecast power consumption. The comparative load forecasting results between proposed Fuzzy-MJO with the latest other algorithms are adequately presented. The full week forecast results using proposed hybrid Fuzzy-MJO load forecasting algorithm demonstrates an outperforming superiority, through the various tested cases, regarding to the total and the peak power error in comparison with the fuzzy-based load forecast model.
- Copyright
- © 2020 The Authors. Published by Atlantis Press SARL.
- Open Access
- This is an open access article distributed under the CC BY-NC 4.0 license (http://creativecommons.org/licenses/by-nc/4.0/).
1. INTRODUCTION
Nowadays optimal energy management (OEM) plays a decisive role because it aims to improve the effectiveness of every power consumption systems [1]. Hence, OEM is increasingly applied to efficiently regulate the consuming power distribution. Load forecasting is not the solution to the energy management issue, but a decisive tool in its implementation [2]. Based on the requirements of energy management, load forecasting can be used to indirectly improve the usage of power by raising user awareness and making the end-process more efficient (assuming the user provides the necessary intervention) [3]. Load forecasting has been implemented for years using different techniques ranging from statistical methods to various computational ones.
Statistical and probability models for load forecasting can be broadly classified into two categories depending on how the load is treated. The first method assumes the pattern of the load is a time series signal and can thus perform time series analysis to obtain the desired result. The second method strives to obtain the relationship between power usage and weather variables, using regression analysis [4,5]. Shepero et al. proposed a new residential probabilistic load forecasting using Gaussian process [6]. Wang et al. introduced a conditional residual model for probabilistic load forecasting [7] and Pozna et al. proposed a load forecast model derived from Bayesian filtering in [8], among them. The fact is that in order to implement regression analysis the correct input data must be available and the basic functional elements must be supposed. This load forecast approach models the system and allows for the regression coefficients to be solved [9].
The emergence of computational intelligence has led to several methods being developed and applied to load forecasting [10,11]. Ghadimi et al. introduced an improved meta-heuristic algorithm for electricity load forecasting [12]. Expert systems can be used in diagnostics, planning, control and it could even be used to forecast loads. This type of system replicates the knowledge and thought processes of a “human expert” [13]. Fallah et al. applied computational intelligence approaches for energy load forecasting in smart-grid energy management [14].
Artificial neural networks (ANNs), or more generally neural networks, are the computational simulation of the learning characteristics and pattern recognition of the human brain which is available to efficiently model load forecast system [15]. Chen et al. proposed a short-term load forecasting method using deep residual neural networks [16]. Rafiei et al. introduced a new probabilistic load forecasting using an improved wavelet neural network trained by generalized extreme learning machine [17]. Lang et al. proposed a short-term load forecasting model based on multivariate time series prediction and weighted neural network [18]. Sriram et al. [19] applied a causal Markov Elman neural network for load forecasting in multi-network systems. Liang et al. [20] proposed a new short-term load forecasting model based on feature extraction and improved general regression neural network. Recently Anh et al. in [21] initiatively introduced an inverse MIMO NARX neural model for online predicting the nonlinear dynamic systems and so on.
Up to now fuzzy logic systems have been successfully applied to design load forecast systems in which the mathematical model is nonlinear or poorly understood. Cerne et al. proposed a short-term load forecasting method by separating daily profiles and using a single fuzzy model across the entire domain [22]. Tang et al. introduced a long-term electricity consumption forecasting method based on expert prediction and fuzzy Bayesian theory [23]. Jamaaluddin and Robandi applied a short-term load forecasting using hybrid regression and interval Type-1 fuzzy inference [24]. Anh et al. in [25] successfully proposed an adaptive MIMO NARX fuzzy model for online predicting the nonlinear dynamic plants, among them.
In addition to the abovementioned soft computing-based methods, there are hybrid intelligent methods that combine at least two of the methods abovementioned to improve the performance of load forecast results. Abreu et al. introduced a multi-nodal load forecasting for distribution systems using a hybrid fuzzy art-map neural network [26]. Luy et al. proposed a short-term fuzzy load forecasting model using genetic–fuzzy and ant colony–fuzzy optimization approaches [27]. Qin et al. introduced a hybrid forecasting model based on long short-term memory network combined deep learning neural network [28]. Zahid et al. applied a load forecasting model using enhanced convolutional neural network and enhanced support vector regression in smart grids [29]. Anh et al. in [30] proposed a hybrid evolutionary neural model optimized with modified differential evolution technique to online predicting the nonlinear dynamic MIMO systems. Gil et al. [31] applied microscopic simulation and fuzzy rule interpolation for identifying the highly uncertain nonlinear plants. The fuzzy-neural method, introduced by Liao [32], improved the performance of hybrid load forecast model in comparison with the genetic algorithm (GA)-based optimized neural network model created by the same author.
The optimization problem of parameter tuning plays an important role in load-forecast problem. Recently several well-known interesting swarm intelligence algorithms have proved very good results regarding to solving optimization problems including parameter tuning problems. Wang et al. [33] proposed a novel hybrid bat algorithm with harmony search for global numerical optimization. Precup and David in [34] suggested novel nature-inspired optimization algorithms proved convincingly efficient for fuzzy-based controlled servo systems. Fe-Perdomo et al. in [35] proposed an automatic selection method regarding to optimal parameters based on simple soft-computing methods which was effectively applied in micro-milling processes. Specifically, Tharwat and Hassanien [36] introduced quantum mechanics (QPSO), which do not require velocity vectors to move the particles, and the number of adjusting parameters is less than the standard particle swarm optimization (PSO). Beruvides et al. [37] proposed a new multi-objective cross entropy (MOCE) method which demonstrated very fast convergence and few parameters to be adjusted. The fact is that the no free lunch theorem in search and optimization has proven that there will be not the best optimization algorithm in search and optimization successfully applied for all optimal identification problems.
Recently an advanced optimization algorithm called Jaya, first proposed by Venkata Rao [38] obtains outperformed features such as simple to implement, not need any specified control coefficients. The Jaya optimization approach has been proved to be able of effectively resolving not only constrained but also unconstrained optimized-orientation tasks, and its potentiality has demonstrated that this method proves more efficient than recently well-known optimization approaches, such as GA [39], PSO [40]. The Jaya algorithm has now been increasingly used and improved for versatile problems in numerous domains such as mechanical engineering [40–43], ANN training [44], structural optimization [45] and load forecast systems in this paper among them.
Motivating from the emergence of computational intelligence techniques which has been successfully applied to load forecasting in which hybrid intelligent methods that combine at least two of the soft-computing approaches abovementioned in order to improve the performance of load forecast results. Based on such analysis related to promisingly potential capability of the hybrid intelligent load forecast model and Jaya optimization method, a new approach for optimally implementing a novel load forecasting system combining fuzzy model and modified Jaya optimization (MJO) algorithm is proposed in this research.
The contribution of this paper is two-fold. Firstly a novel Fuzzy-MJO load forecasting systems, optimized by the MJO algorithm, using the day-time and the daily power consumption is initiatively proposed to efficiently predict the forecast power consumption. Secondly the full week forecast data using proposed hybrid Fuzzy-MJO load forecasting algorithm is resulted and demonstrates an outperforming superiority, through the various tested cases, regarding to the total and the peak power error in comparison with the standard fuzzy-based load forecast method.
The rest of this paper is structured as follows: Section 2 provides a detailed description of the development and implementation of the load forecasting algorithm and associated features combining fuzzy logic systems and Jaya optimization algorithms. The necessary assumptions and constraints to enable implementation are presented and the performance criteria are described. Section 3 presents the tests and results determining the required amount of input data to yield accurate results. Detailed case studies are then presented to show the effect that the MJO algorithm has on the load forecasting results. Section 4 analyzes of the results from the research findings. Eventually Section 5 concludes the paper and provides a summation of the most pertinent results obtained.
2. LOAD FORECASTING SYSTEM FORMULATION
For this investigation into load forecasting, fuzzy logic system is combined with MJO algorithm to provide the desired hybrid Fuzzy-MJO load forecast system. This section documents the development of the fuzzy logic systems for the load forecasting algorithm, as well as the development of the MJO algorithm to accurately parameterize the algorithm. The necessary assumptions and constraints are presented as well as the performance criteria.
2.1. Assumptions and Constraints
As to implement the load forecasting algorithm necessary assumptions and constraints are introduced as follows:
The original load profile that the system is designed for is a wing of a single floor of the Faculty of Electrical and Electronics Engineering (FEEE) building at the HCM City University of Technology—VNUHCM (henceforth known as the University), with a profile illustrated in Figure 1.
Power usage data (input and forecast) is normalized on 0 kWh–12 kWh (due to the original load profile) to ensure that any load could be accommodated.
30-minute intervals are considered the normal period for forecasts (as per the Vietnam power utility measurements, and measurements performed on the University campuses).
24-hours interval is considered the shortest time scale for the forecast in order to calculate performance.
The maximum period for load forecasting is limited to a full week to reduce the required amount of input data.
Week is defined as Monday to Friday, and weekend is defined as Saturday and Sunday.
Public holidays are modeled as weekend days where necessary.
Weather had minimal impact within the week long timescale and as such is neglected for the study.
The fuzzy logic systems for each of the test cases are all the same before implementing the MJO algorithm as to allow for comparison of the proposed MJO algorithm performance.
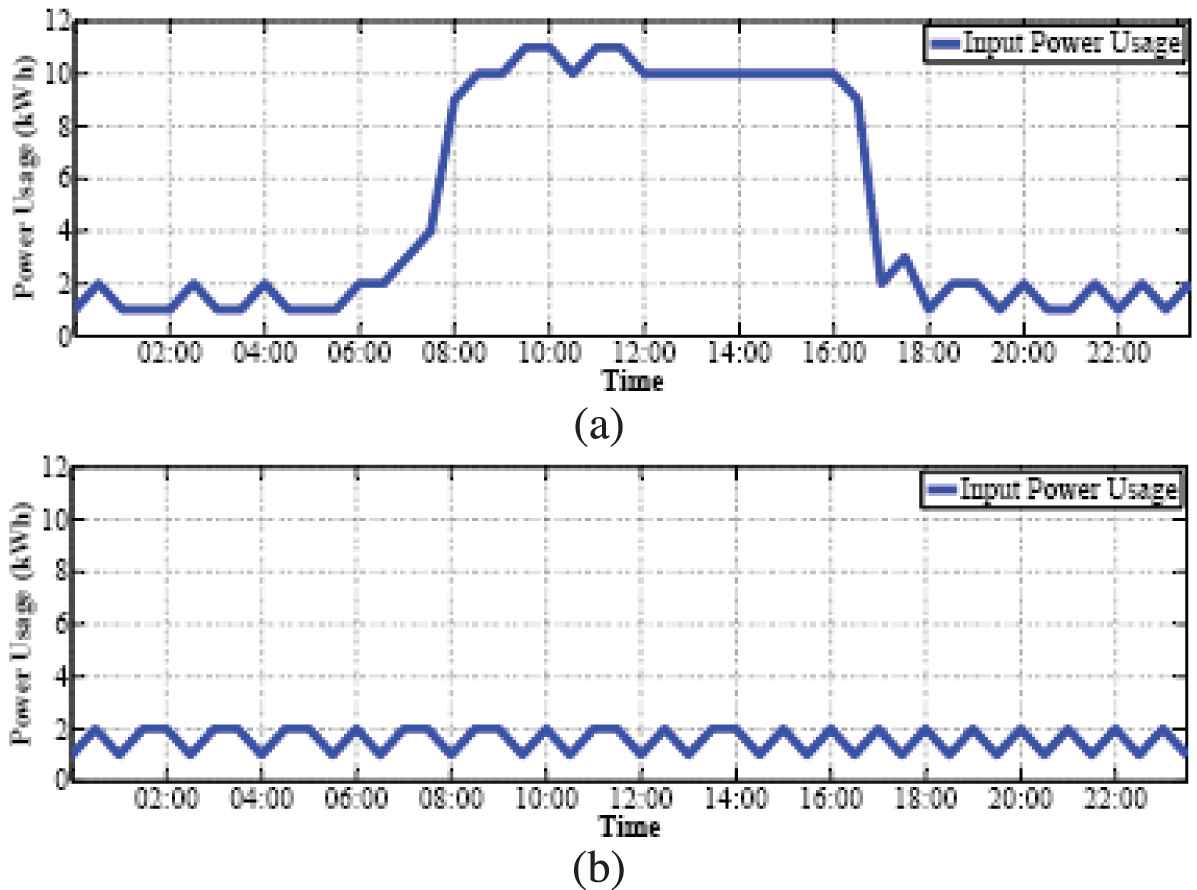
Sample load profile to illustrate the necessity to distinguish between (a) week days and (b) weekend days in the load forecasting algorithm.
These assumptions and constraints ensured the results obtained from the proposed Fuzzy-MJO load forecasting algorithm is accurate and valid, while remaining uncomplicated and prompt in operation.
2.2. Definition of Performance Criteria
Two criteria are required to be defined as to evaluate the performance of the proposed load forecasting algorithm. They are
The difference between the forecast peak load and the measured peak load (Epeak) for a 24 hour period (or peak energy error - Epeak),
andThe difference between the total energy required for the forecast load and the measured load in a 24 hour period (or total energy error – Etotal),
with Pforecast represents the forecast power usage,Pmeasured represents the measured power usage,
n represents the maximum number of terms in the forecast period.
It should be noted that the integral in (2) is performed using trapezoidal numerical integration to give the closest approximation value to the true one.
These performance criteria are chosen since they belong to some of the most important factors when considering energy management [10]. If the peak load and the total energy usage in a 24-hour period can be precisely forecast then the user can implement methods of reducing it, or the power producer can plan accordingly to ensure that the required peak power is available. This would lead to a greater awareness of the power usage and possibly improve bill management for the user. The defined performance criteria utilized a backward comparison approach, meaning the performance could only be established for the week-ahead forecast once the current week had been completed.
In order to evaluate the effectiveness of the proposed MJO algorithm, a simple equation is defined to show the ratio between the result before and after the MJO algorithm is implemented. This ratio can also be considered the improvement factor
2.3. Outline of Proposed Load Forecasting Algorithm
The proposed load forecasting algorithm comprised of two fuzzy logic systems performing the load forecasting, one for weekday forecasts and the latter for weekend forecasts due to differences in the observed trends for the types of day as illustrated in Figure 1. The inputs to the algorithm are the time of day and the historic power usage. A third input is the day of the week however it would not impact the fuzzy logic systems.
It rather selects which of the fuzzy logic systems to use whether the day is during the week or weekend. A MJO algorithm is developed to optimally adjust the parameters for the fuzzy logic membership functions and rules to maximize the performance of the load forecasting algorithm. The MJO algorithm is not implemented in real-time, but rather once a week (every seven days) due to computational requirements. For each new week the MJO algorithm needs to be reimplemented to maintain a high level of accuracy. The logical flow diagram of the proposed load forecast Fuzzy-MJO algorithm is illustrated in Figure 2.
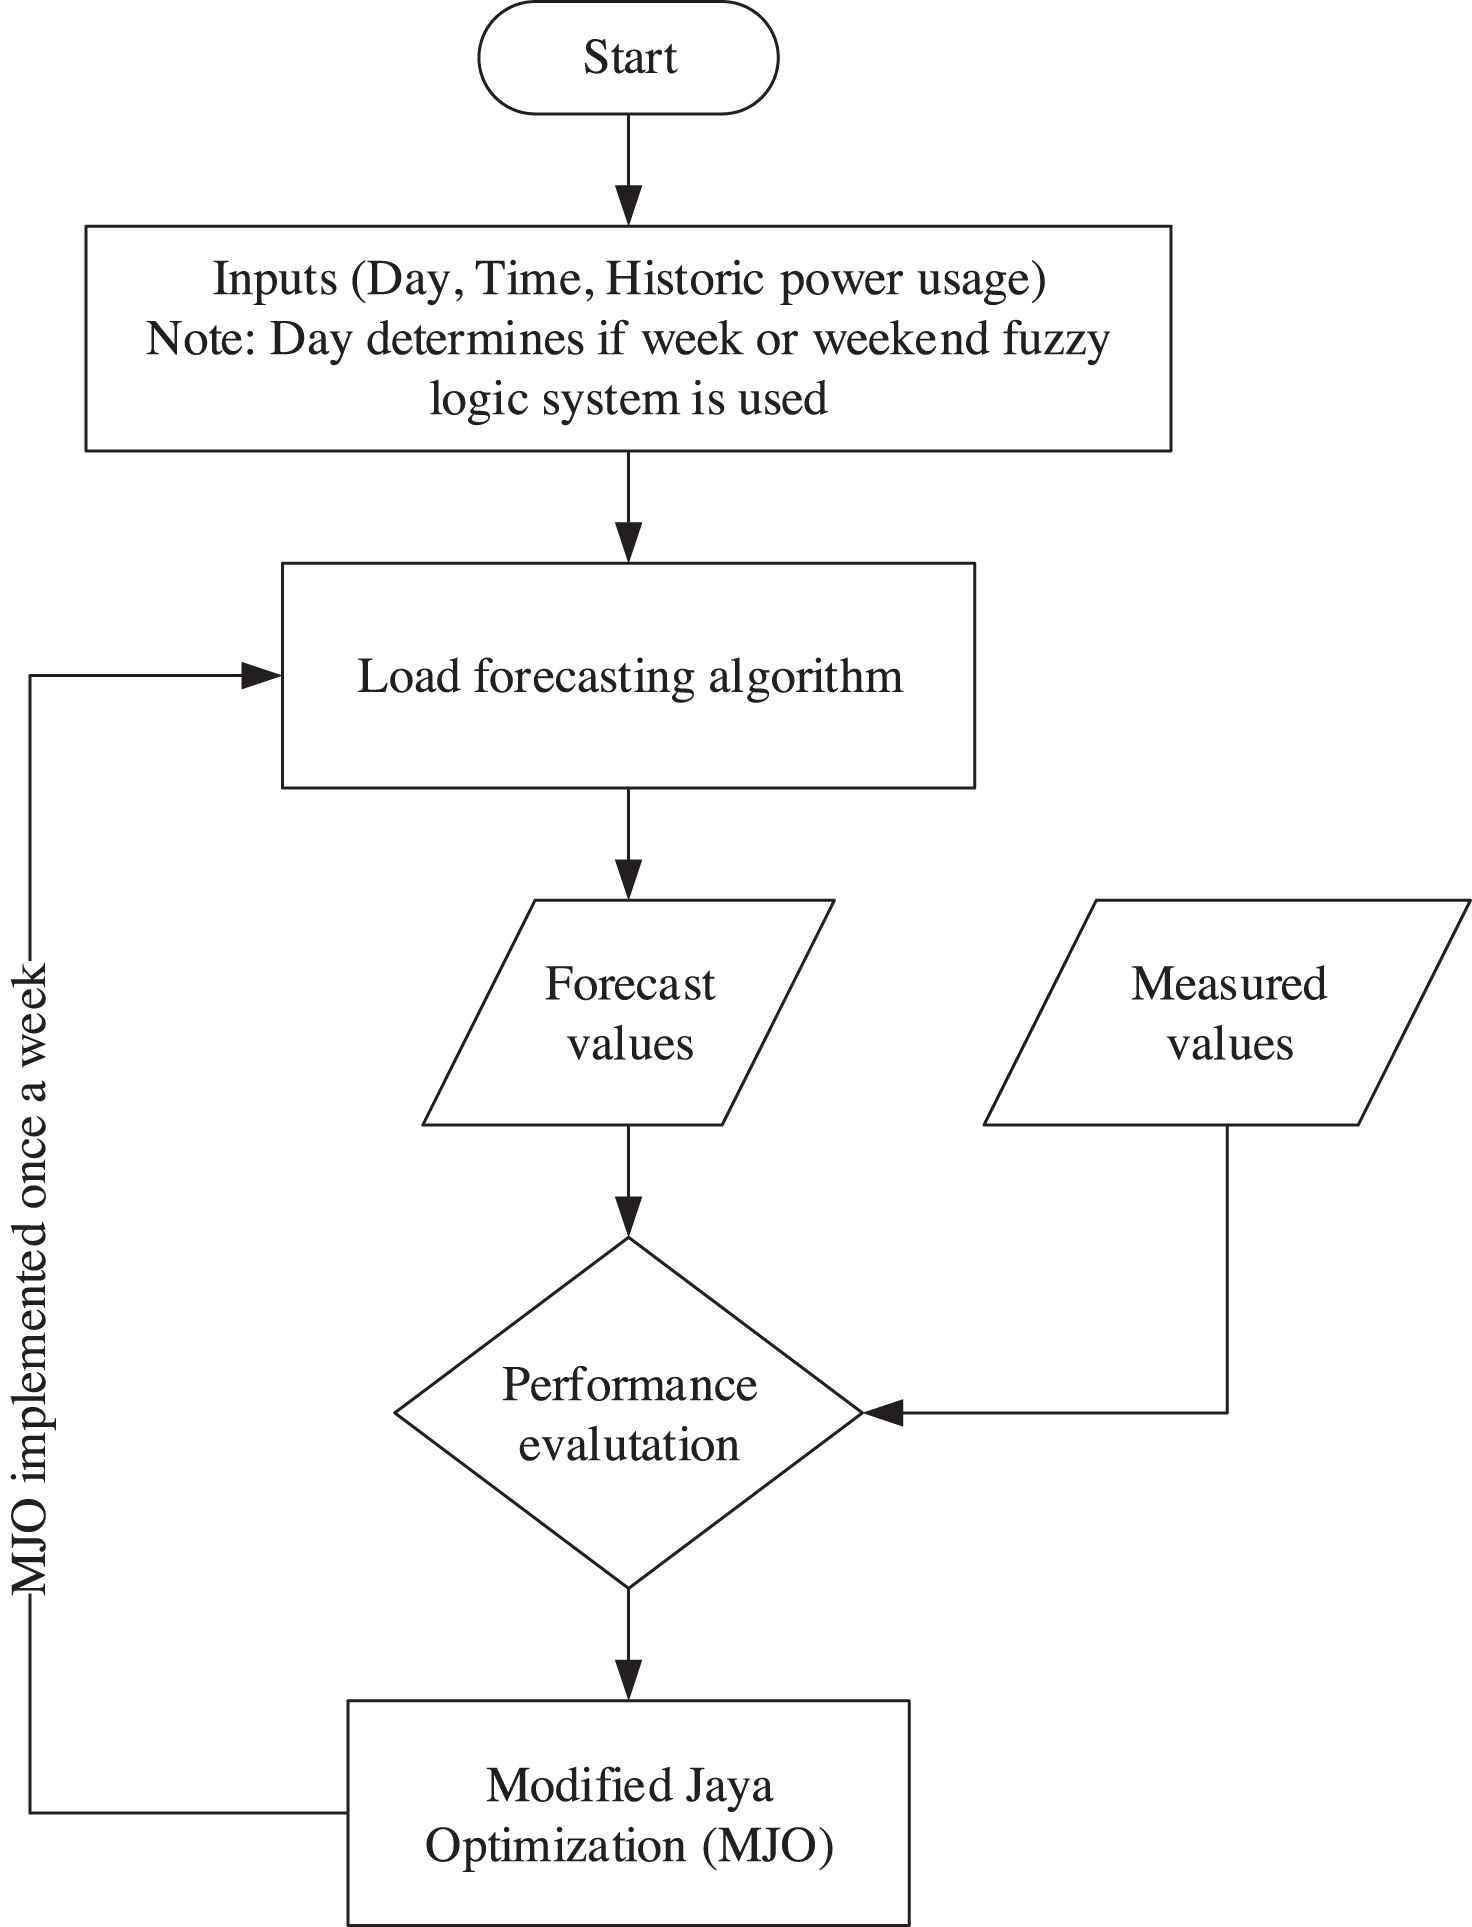
Flow diagram for the proposed Fuzzy-modified Jaya optimization (MJO) load forecasting algorithm.
2.4. Fuzzy Load Forecast System
The designed fuzzy logic systems follow the structure depicted in Figure 3. Both fuzzy logic systems are implemented to be the same structure, and only the fuzzy model parameters differ between week days and weekend days.
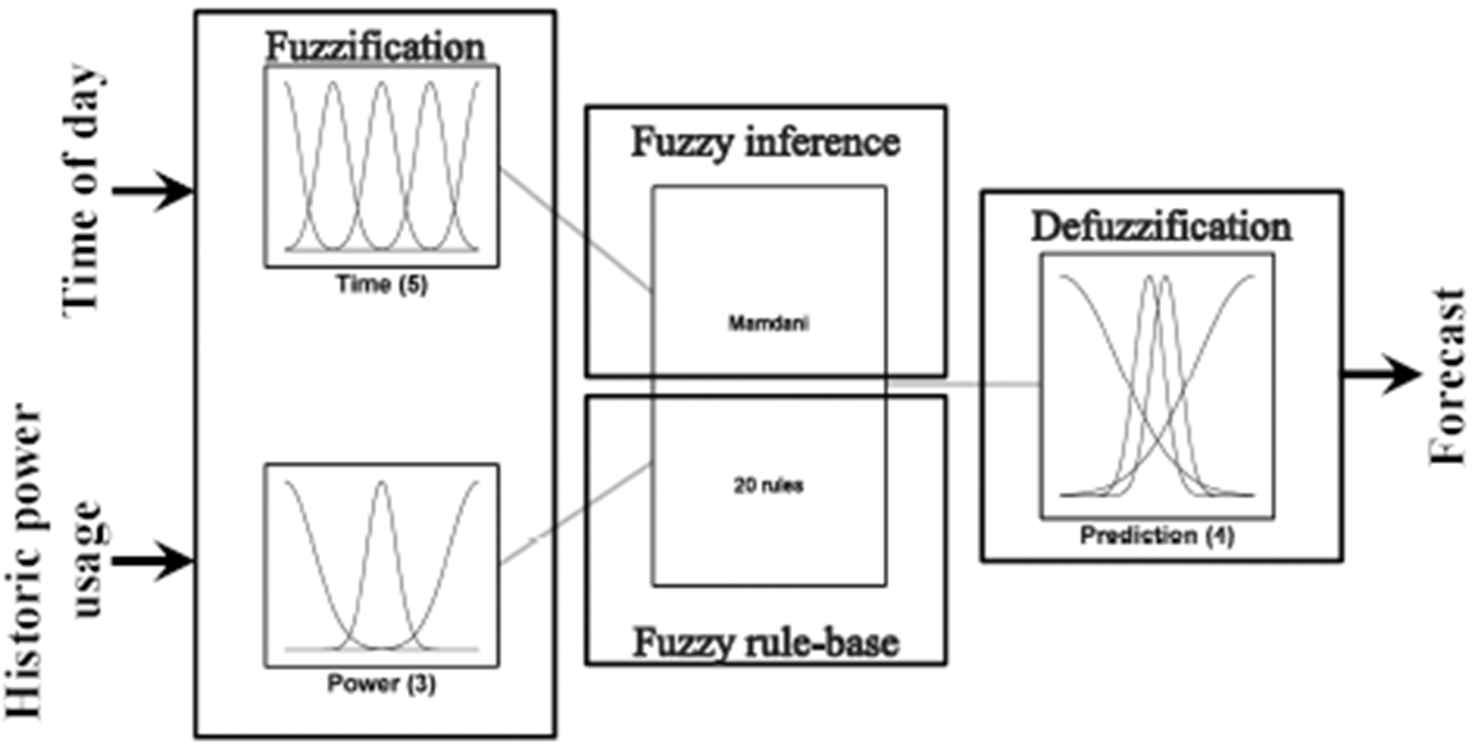
Overview of the fuzzy logic system used in the proposed Fuzzy-modified Jaya optimization (MJO) load forecasting algorithm.
The input and output sets of the proposed fuzzy system used a symmetrical Gaussian distribution for each of the membership functions, described in Eq. (4) with
The parameters of positions (
2.4.1. Proposed fuzzification process
Two input sets are used in the designed fuzzy system to fuzzify the crisp input fuzzy values. The required inputs are the time of day, shown in Figure 4(a), and the historic power usage, presented in Figure 4(b).
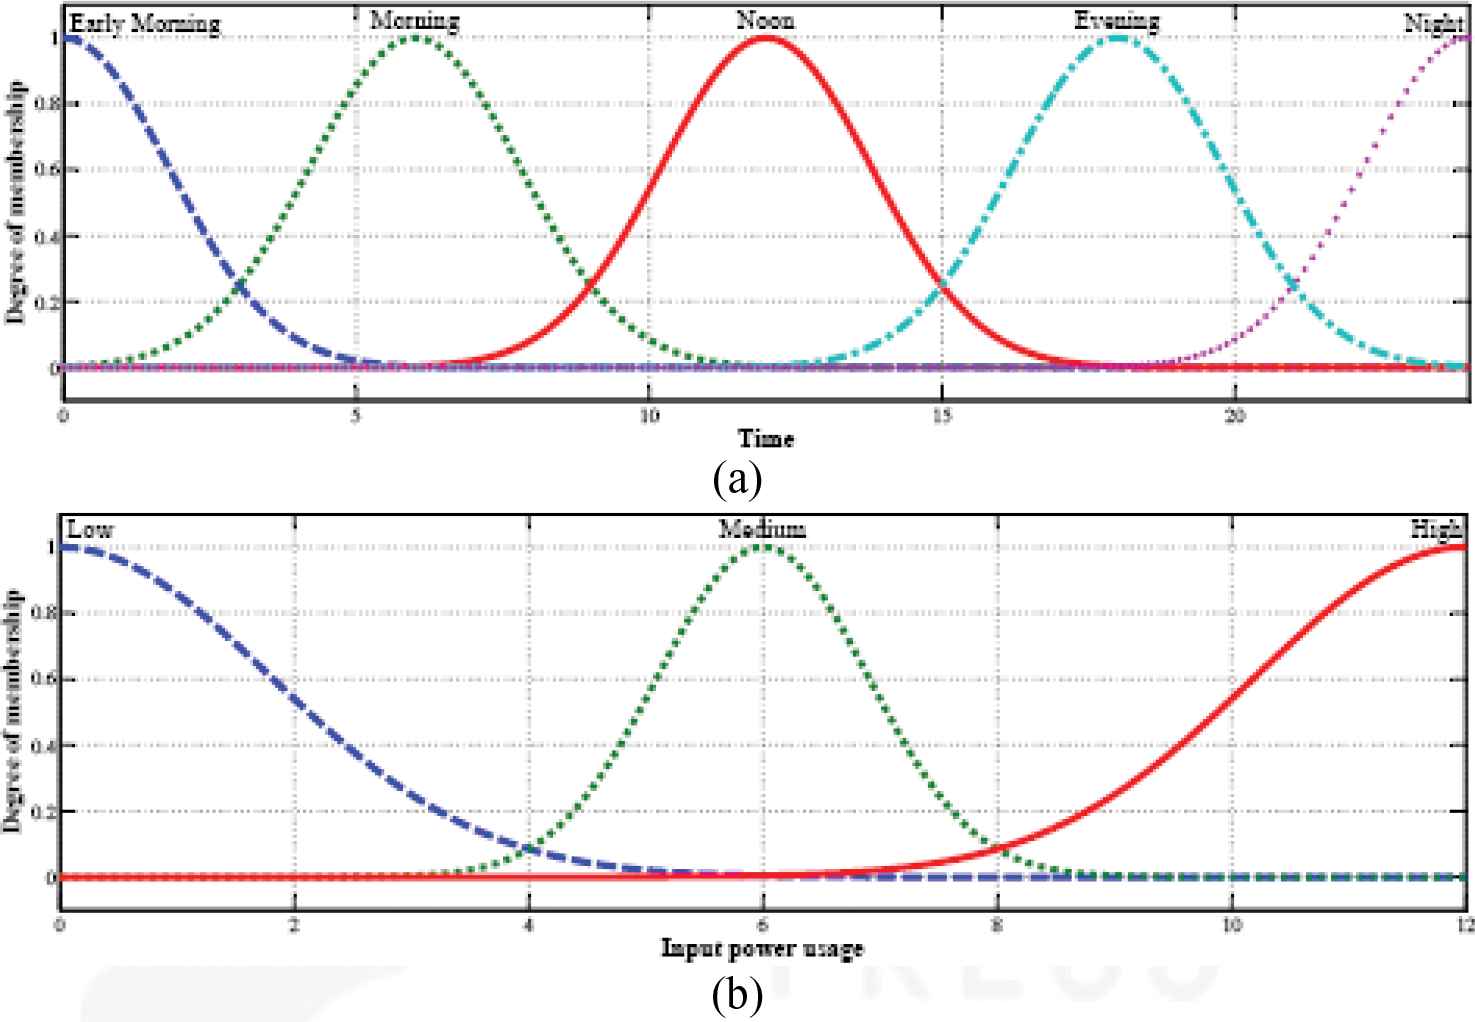
Input fuzzy sets for (a) time of day and (b) historic power usage used in the proposed hybrid fuzzy-MJO load forecasting algorithm.
These crisp input values are passed to the fuzzy systems, and converted to fuzzy values through the fuzzification process. The crisp value (on the x-axis) is assigned a degree of membership (on the y-axis) based on which membership function curve it is corresponded to.
2.4.2. Fuzzy inference engine
Fuzzy inference is established using a linguistic fuzzy rule-base as well as the max–min inference process. The fuzzy rule-base consisted of 20 Mamdani-type linguistic rules, shown in Table 1. The weight of each rule, being a variable for parameterization optimized with proposed MJO algorithm, is initially set to one. This implied that each fuzzy rule contributes to the final output equally. These linguistic fuzzy rules are derived using a priori knowledge of the behavior of the load forecast system, based on the load profile shown in Figure 1.
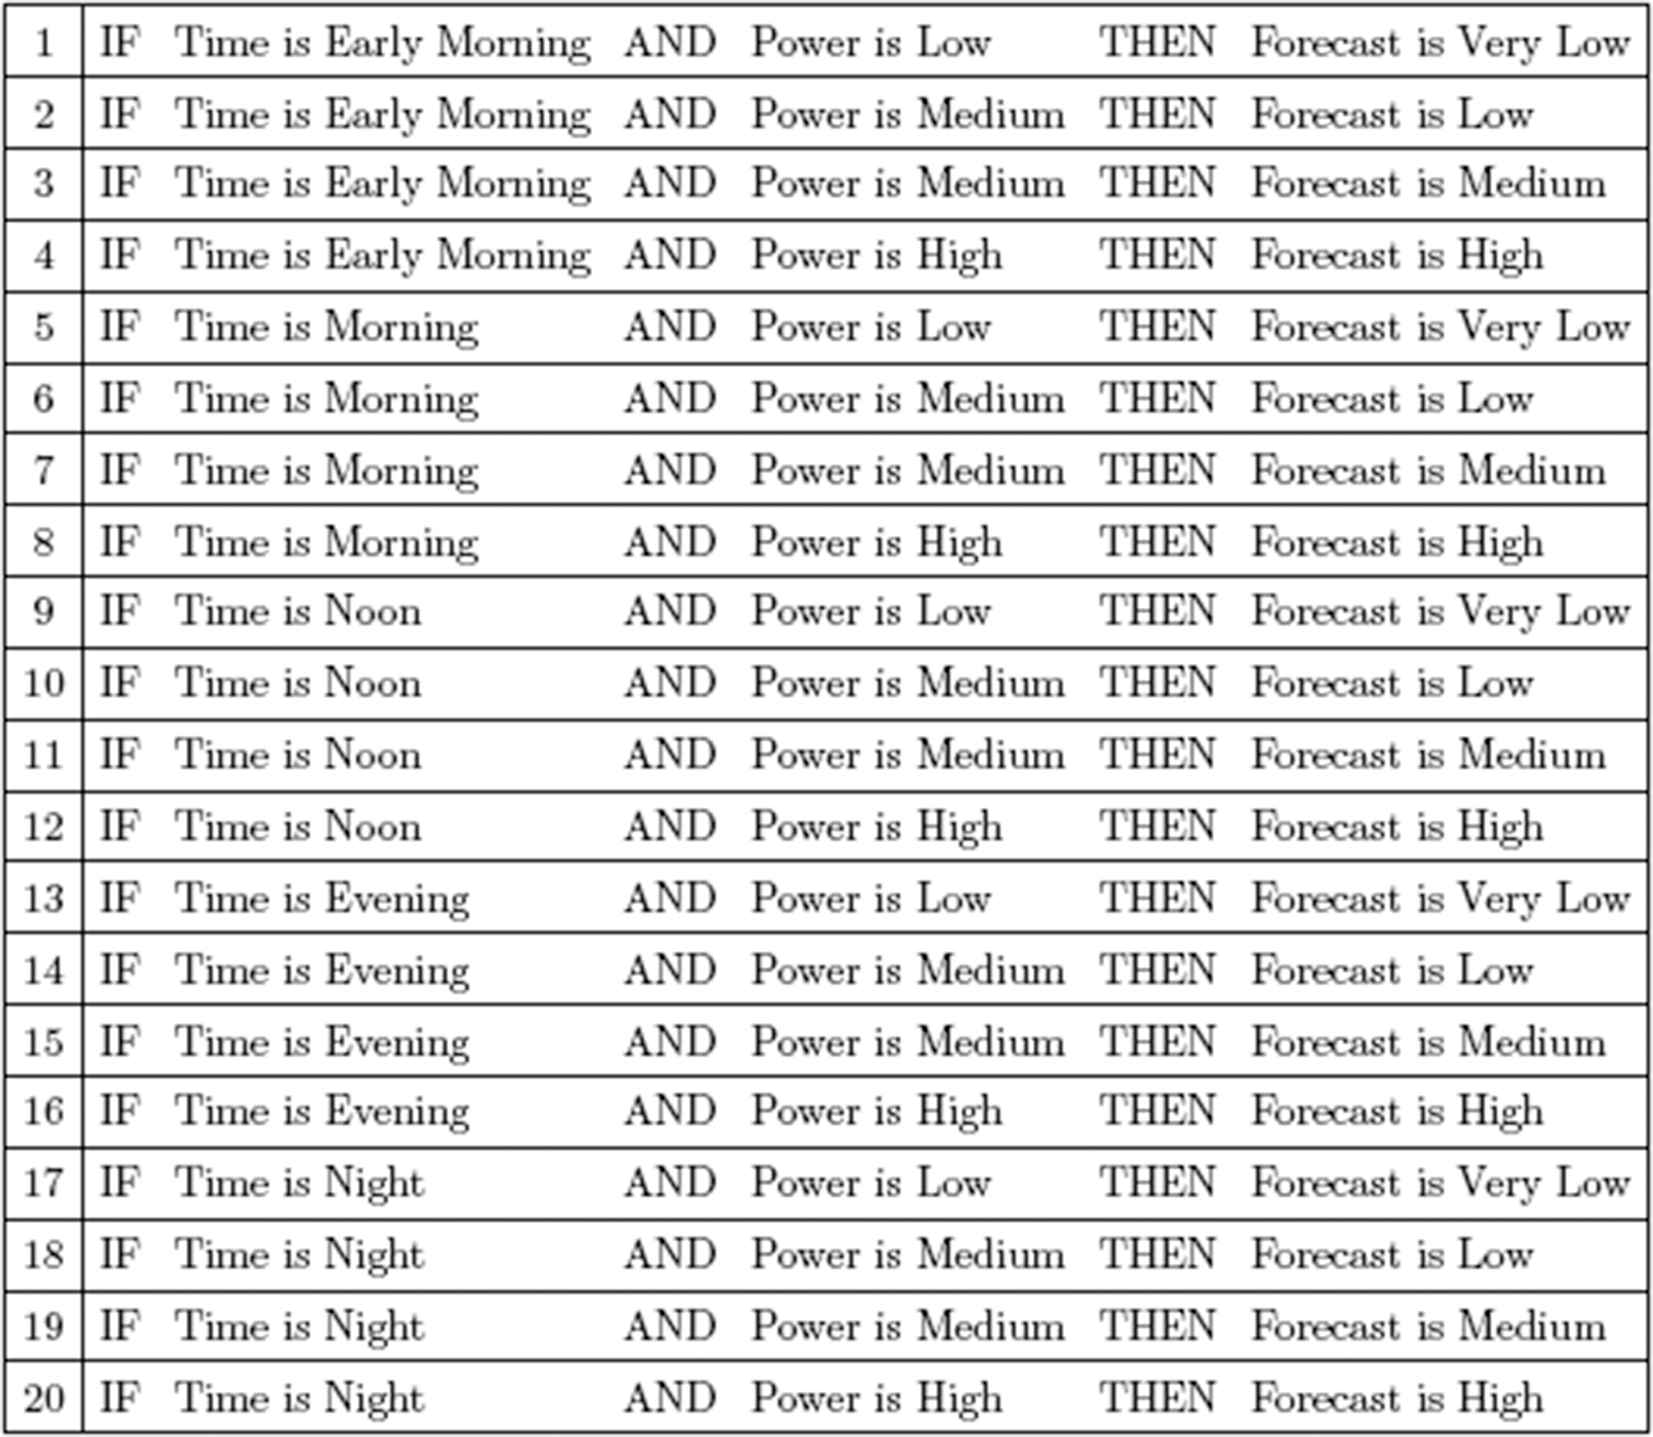 |
Mamdani-style fuzzy rule-base used in the hybrid fuzzy-modified Jaya optimization (MJO) load forecasting algorithm.
2.4.3. Defuzzification procedure
The outputs of the fuzzy inference engine are combined with a single crisp output set shown in Figure 5, to de-fuzzify the fuzzy values. This yielded the desired crisp value, being the forecast load profile. The mean of maximum calculation is used for defuzzification. An example of this is shown in Figure 6. This calculation determines the mean value of all the possible crisp values that correspond to the maximum output fuzzy value, thus yielding a single predicted value.
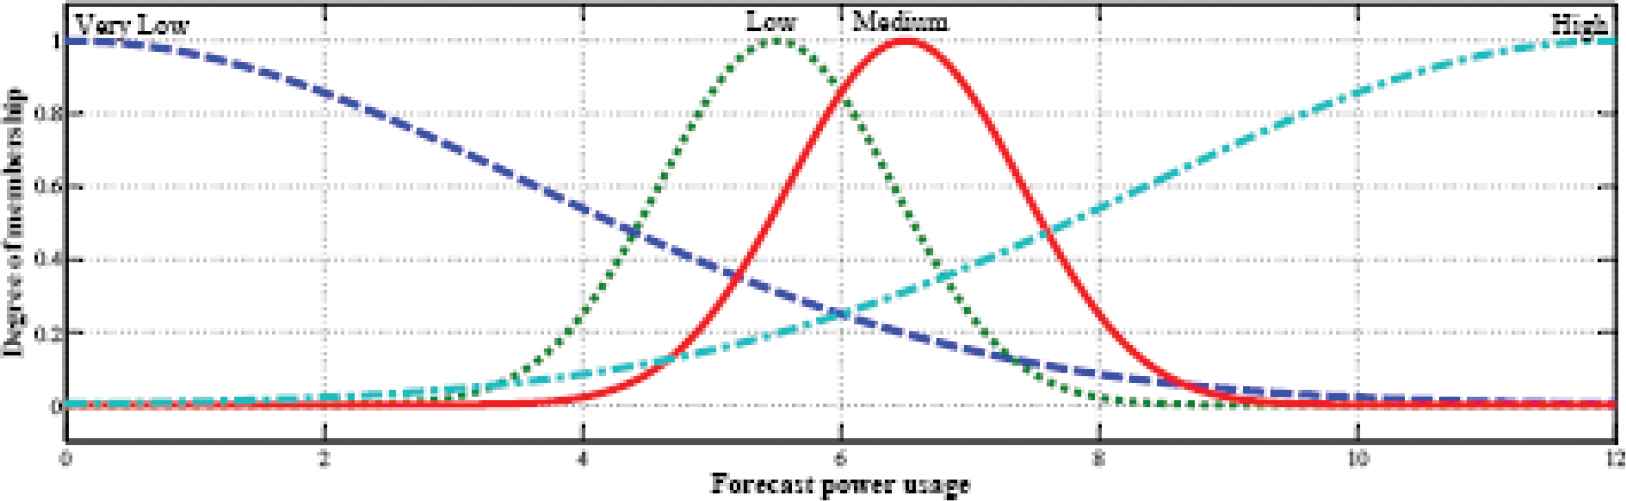
Eventually resulted output fuzzy set optimized with hybrid fuzzy-modified Jaya optimization (MJO) forecaster.
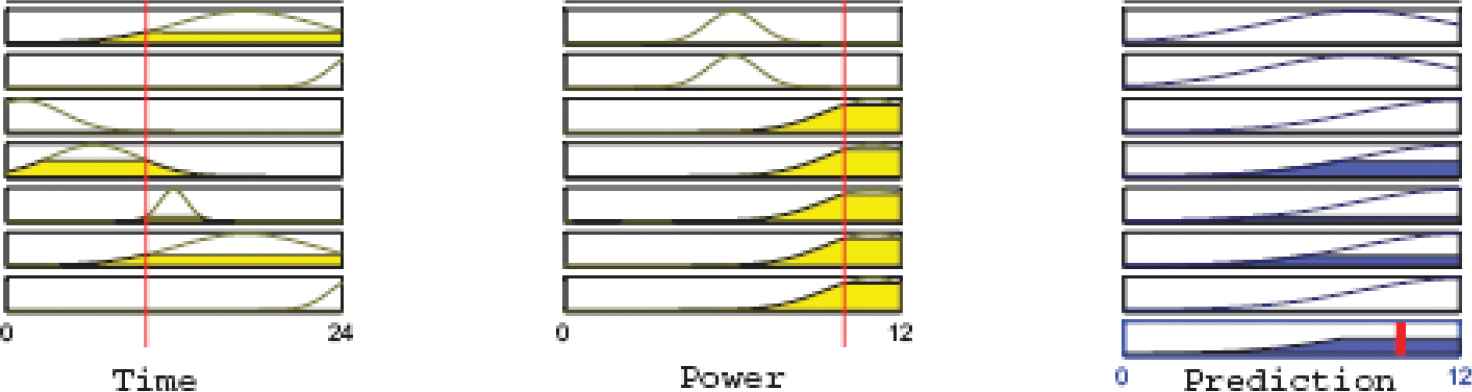
Illustration of the mean of maximum defuzzification calculation. Time = 10h00; Historic power usage = 10 kWh; Predicted power usage (after defuzzification) = 9.9 kWh.
2.5. Proposed MJO Algorithm
2.5.1. Jaya optimization algorithm
The Jaya method, firstly introduced by Venkata Rao [38], belongs to global seeking-based swarm algorithm. This method improves the notion that it persistently focuses in reaching the best solution and in avoiding local optimum-solutions. Furthermore, it proves very simple to install since it needs only popular control coefficients, such as population and number of iterations. The comprehensive contents of this Jaya method can be concisely described in four following stages:
At the first stage of the Jaya method, it randomly generates the initial swarm containing
The second stage, a vector
In the third stage, an operation is executed with respect to the term value
Eventually in the fourth stage, using the fitness function value, the vector
2.5.2. Modified Jaya Optimization (MJO algorithm
Jaya is an algorithm that has not any calibration parameters. This shows a great advantage since it needs not any process of algorithm parameter adjustment. However, it is not possible to adjust the parameters with respect to the characteristics of each objective function. As a result the algorithm sometimes does not converge. To overcome the problem, this paper proposes a MJO algorithm with newly adding parameters. This makes the MJO algorithm more flexible in programing and the ability to quickly converge to global solution.
The proposed MJO algorithm is similar to the conventional Jaya algorithm except using (9) instead of (6). The constant
2.5.3. MJO particle representation applied in Fuzzy-MJO load forecast method
The content of each particle of the MJO algorithm is the initial “guess” at the variables to be solved. The initial guesses as to the initial chromosome for a week day and a weekend day can be seen in lines 3 and 4 of Tables 2–4.
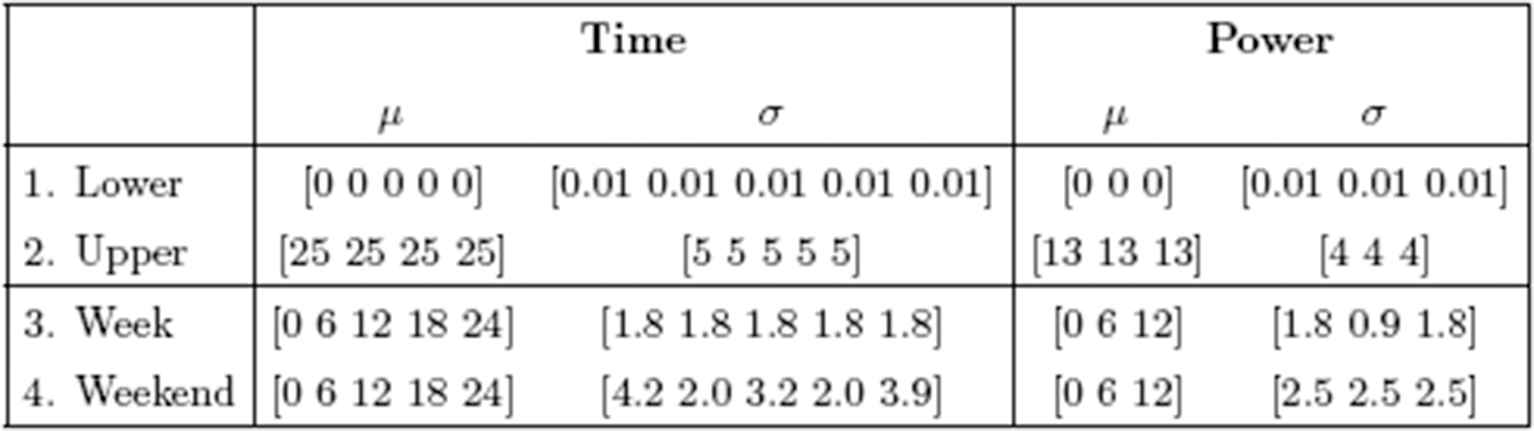 |
Particle specifications of the modified Jaya optimization (MJO) algorithm for the fuzzy input membership functions.
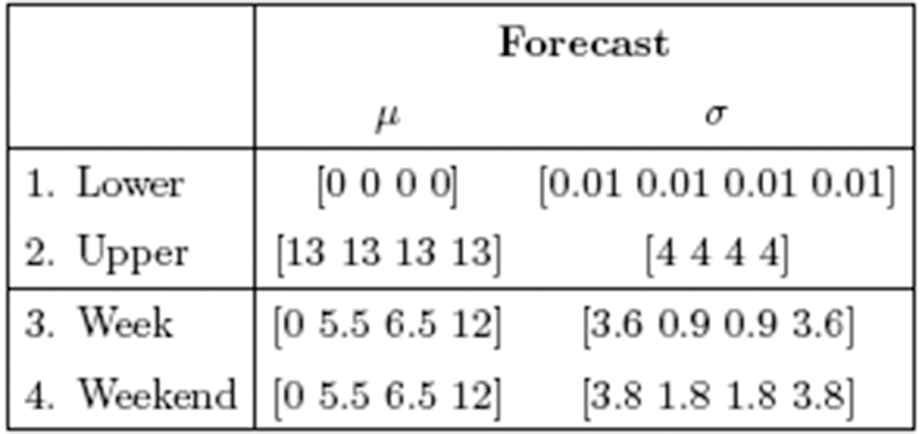 |
Particle specifications of the modified Jaya optimization (MJO) algorithm for the fuzzy output membership functions.
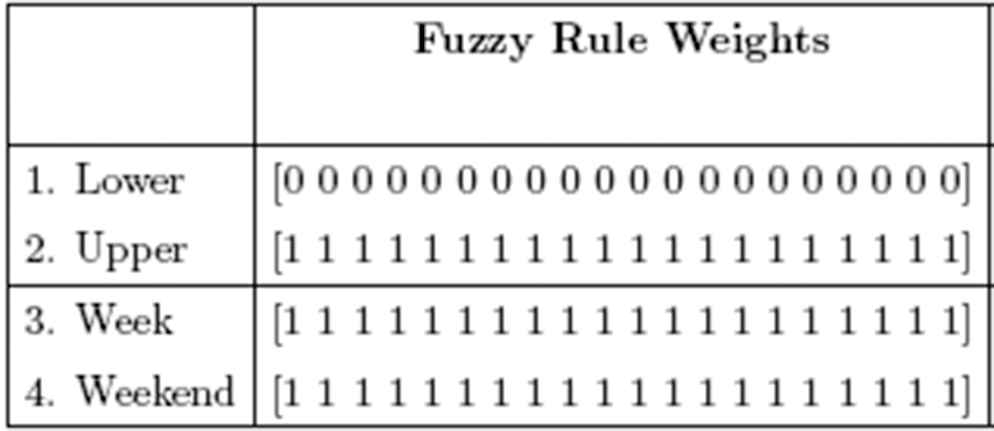 |
Particle specifications of the modified Jaya optimization (MJO) algorithm for the fuzzy rule set weights.
These values were determined using a priori knowledge of the system. Thus the fuzzy logic systems were “tuned” until accurate results were obtained. Lines 1 and 2 in Tables 2–4 indicate the lower and upper boundary of the search space for the chromosome such that the fuzzy logic systems were contained within the defined universe of discourse.
The population size is set to 120 to ensure greater variability in the population. The maximum number of generations is set to 200 such that it ensures adequate cycles which are completed to globally converge on the global solution.
2.5.4. Objective/fitness function implementation
The fitness function defined for the MJO algorithm is the average of the two performance criteria, as indicated in Eq. (10). This ensured that the average of the two errors was reduced to a minimum, since the MATLAB® implementation of the fitness function sought the global minimum solution as determined in (10),
Fitness scaling is carefully selected to be rank scaling. This improved the probability of the fittest of the population to progress to the next generation. The stopping criteria of the MJO algorithm are set to a fitness function tolerance of
2.6. Structure of the Proposed Hybrid Fuzzy-MJO Load Forecasting Algorithm
The algorithm was developed and implemented using MATLAB® toolboxes. The fuzzy forecast system is created using the fuzzy logic toolbox and the MJO algorithm is created using the personally edited optimization MJO technique. The proposed hybrid fuzzy-MJO load forecasting approach block diagram is shown in Figure 7.
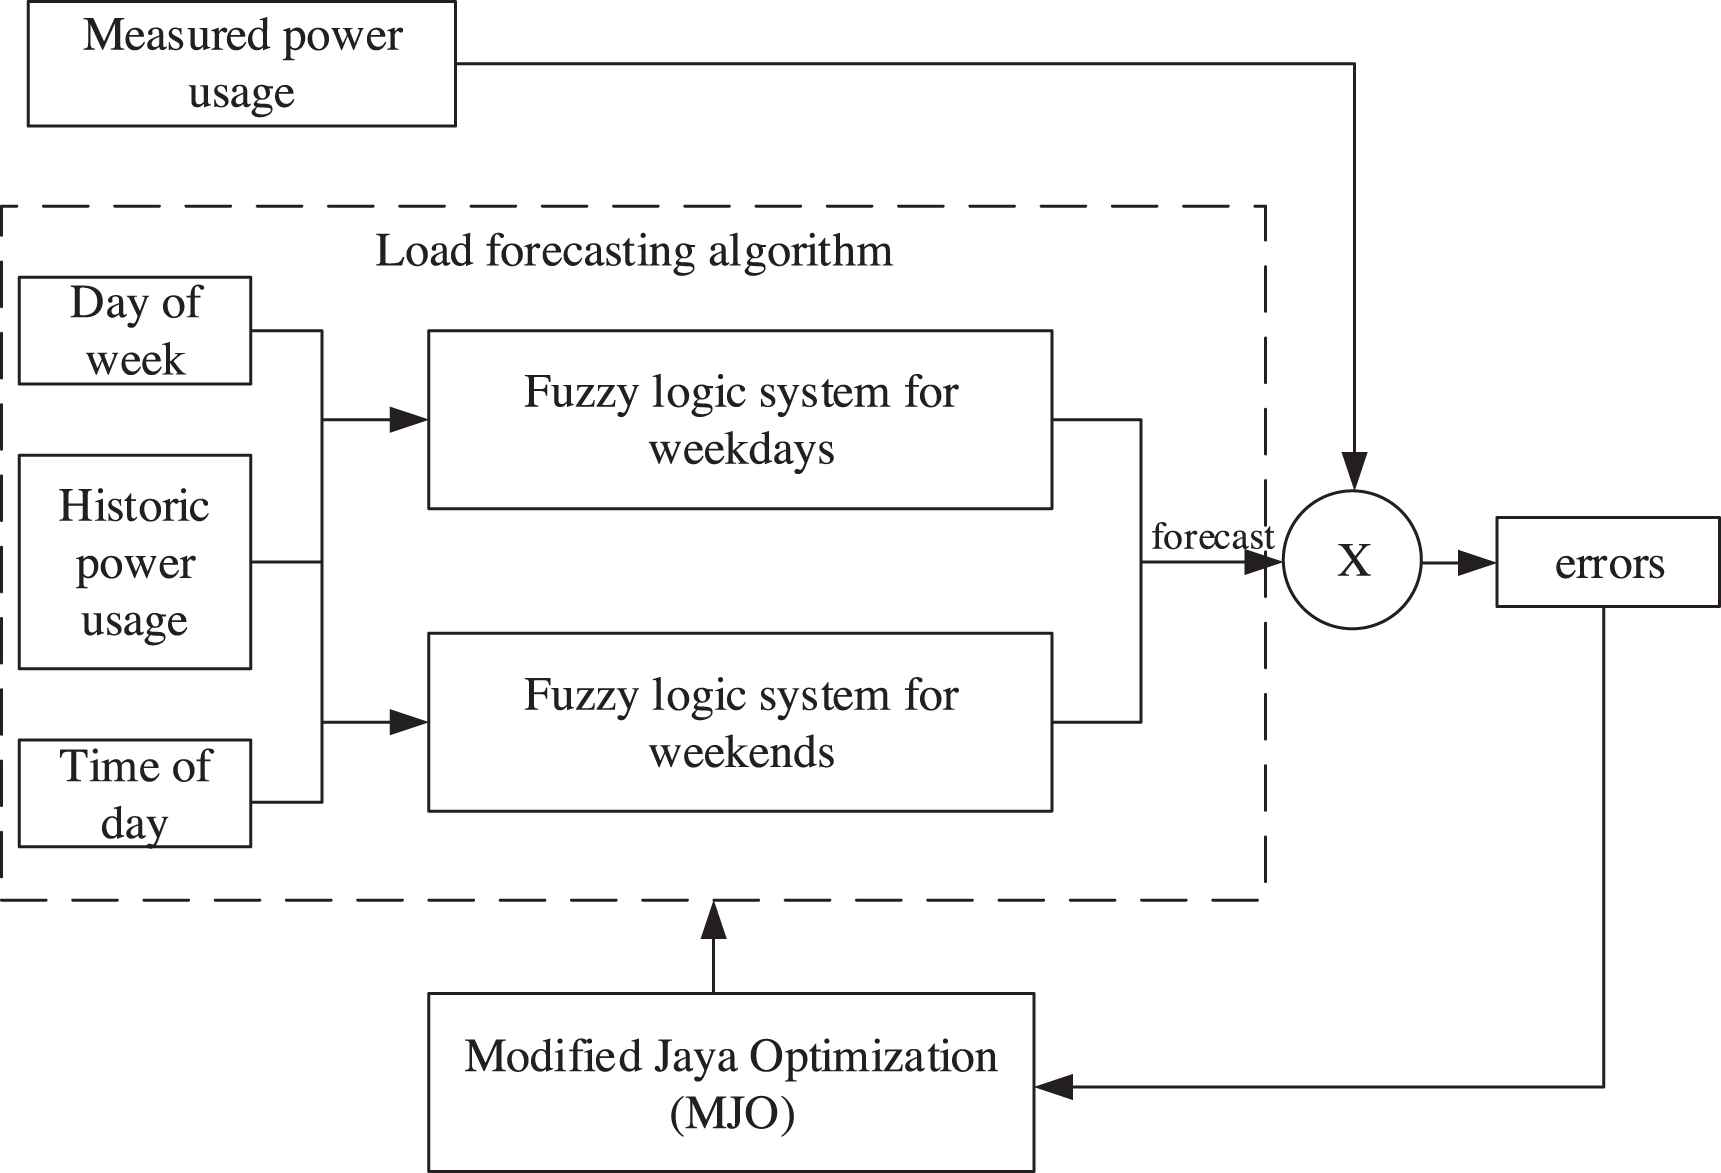
Structure of the hybrid Fuzzy-modified Jaya optimization (MJO) load forecasting algorithm with the accompanying performance evaluation and optimisation processes.
3. PROPOSED FUZZY-MJO LOAD FORECAST ALGORITHM TESTING AND RESULTS
This section presents the results of different tests performed to determine the input data requirements to yield the most accurate results, and for each of the case studies described. The case studies are performed before and after the MJO algorithm implemented to observe the effects of the MJO algorithm on the fuzzy systems. Five different load profiles are adequately tested. The loads are collected as follows (from largest to smallest): the Ho Chi Minh City in Viet Nam; the First Campus at the Ho Chi Minh City University of Technology-VNU HCM, Ho Chi Minh City, Viet Nam (henceforth known as the University), B-1 Building Resident at the University, B-3 Building at the University and a single plug point with a variable load. Graphical results are only generated for after the MJO algorithm implementation for illustrative purposes.
3.1. Preliminary Algorithm Testing to Determine Input Requirements
The desired amount of input data required is determined by using a varied number of week's historic power usage data used in term to the input of the load forecasting model. Three options are considered: using one, two or three weeks' data prior to the test as the input to the algorithm. The input for the two weeks and three weeks options is the average of the data from each of the 2 and 3 weeks applied to the test. The results for each of these tests are shown in Table 5.
| Input Quantity | Epeak (%) | Etotal (%) | Average (%) |
|---|---|---|---|
| One-week data | 0.35 | 3.27 | 1.81 |
| Two-week data | 4.57 | 4.27 | 4.42 |
| Three-week data | 2.92 | 5.80 | 4.36 |
Error calculations for the varying inputs test before the modified Jaya optimization (MJO) is implemented.
The results indicate that power consumption data through a week prior to the test ensured the most precise prediction capabilities with an average error of 1.81% determined from Epeak and Etotal. This was better than using either of the two other proposed inputs by a factor of approximately 2.4. Therefore power consumption data through one week prior to the test is used for the detailed case studies.
3.2. Case 1—Ho Chi Minh City in Viet Nam
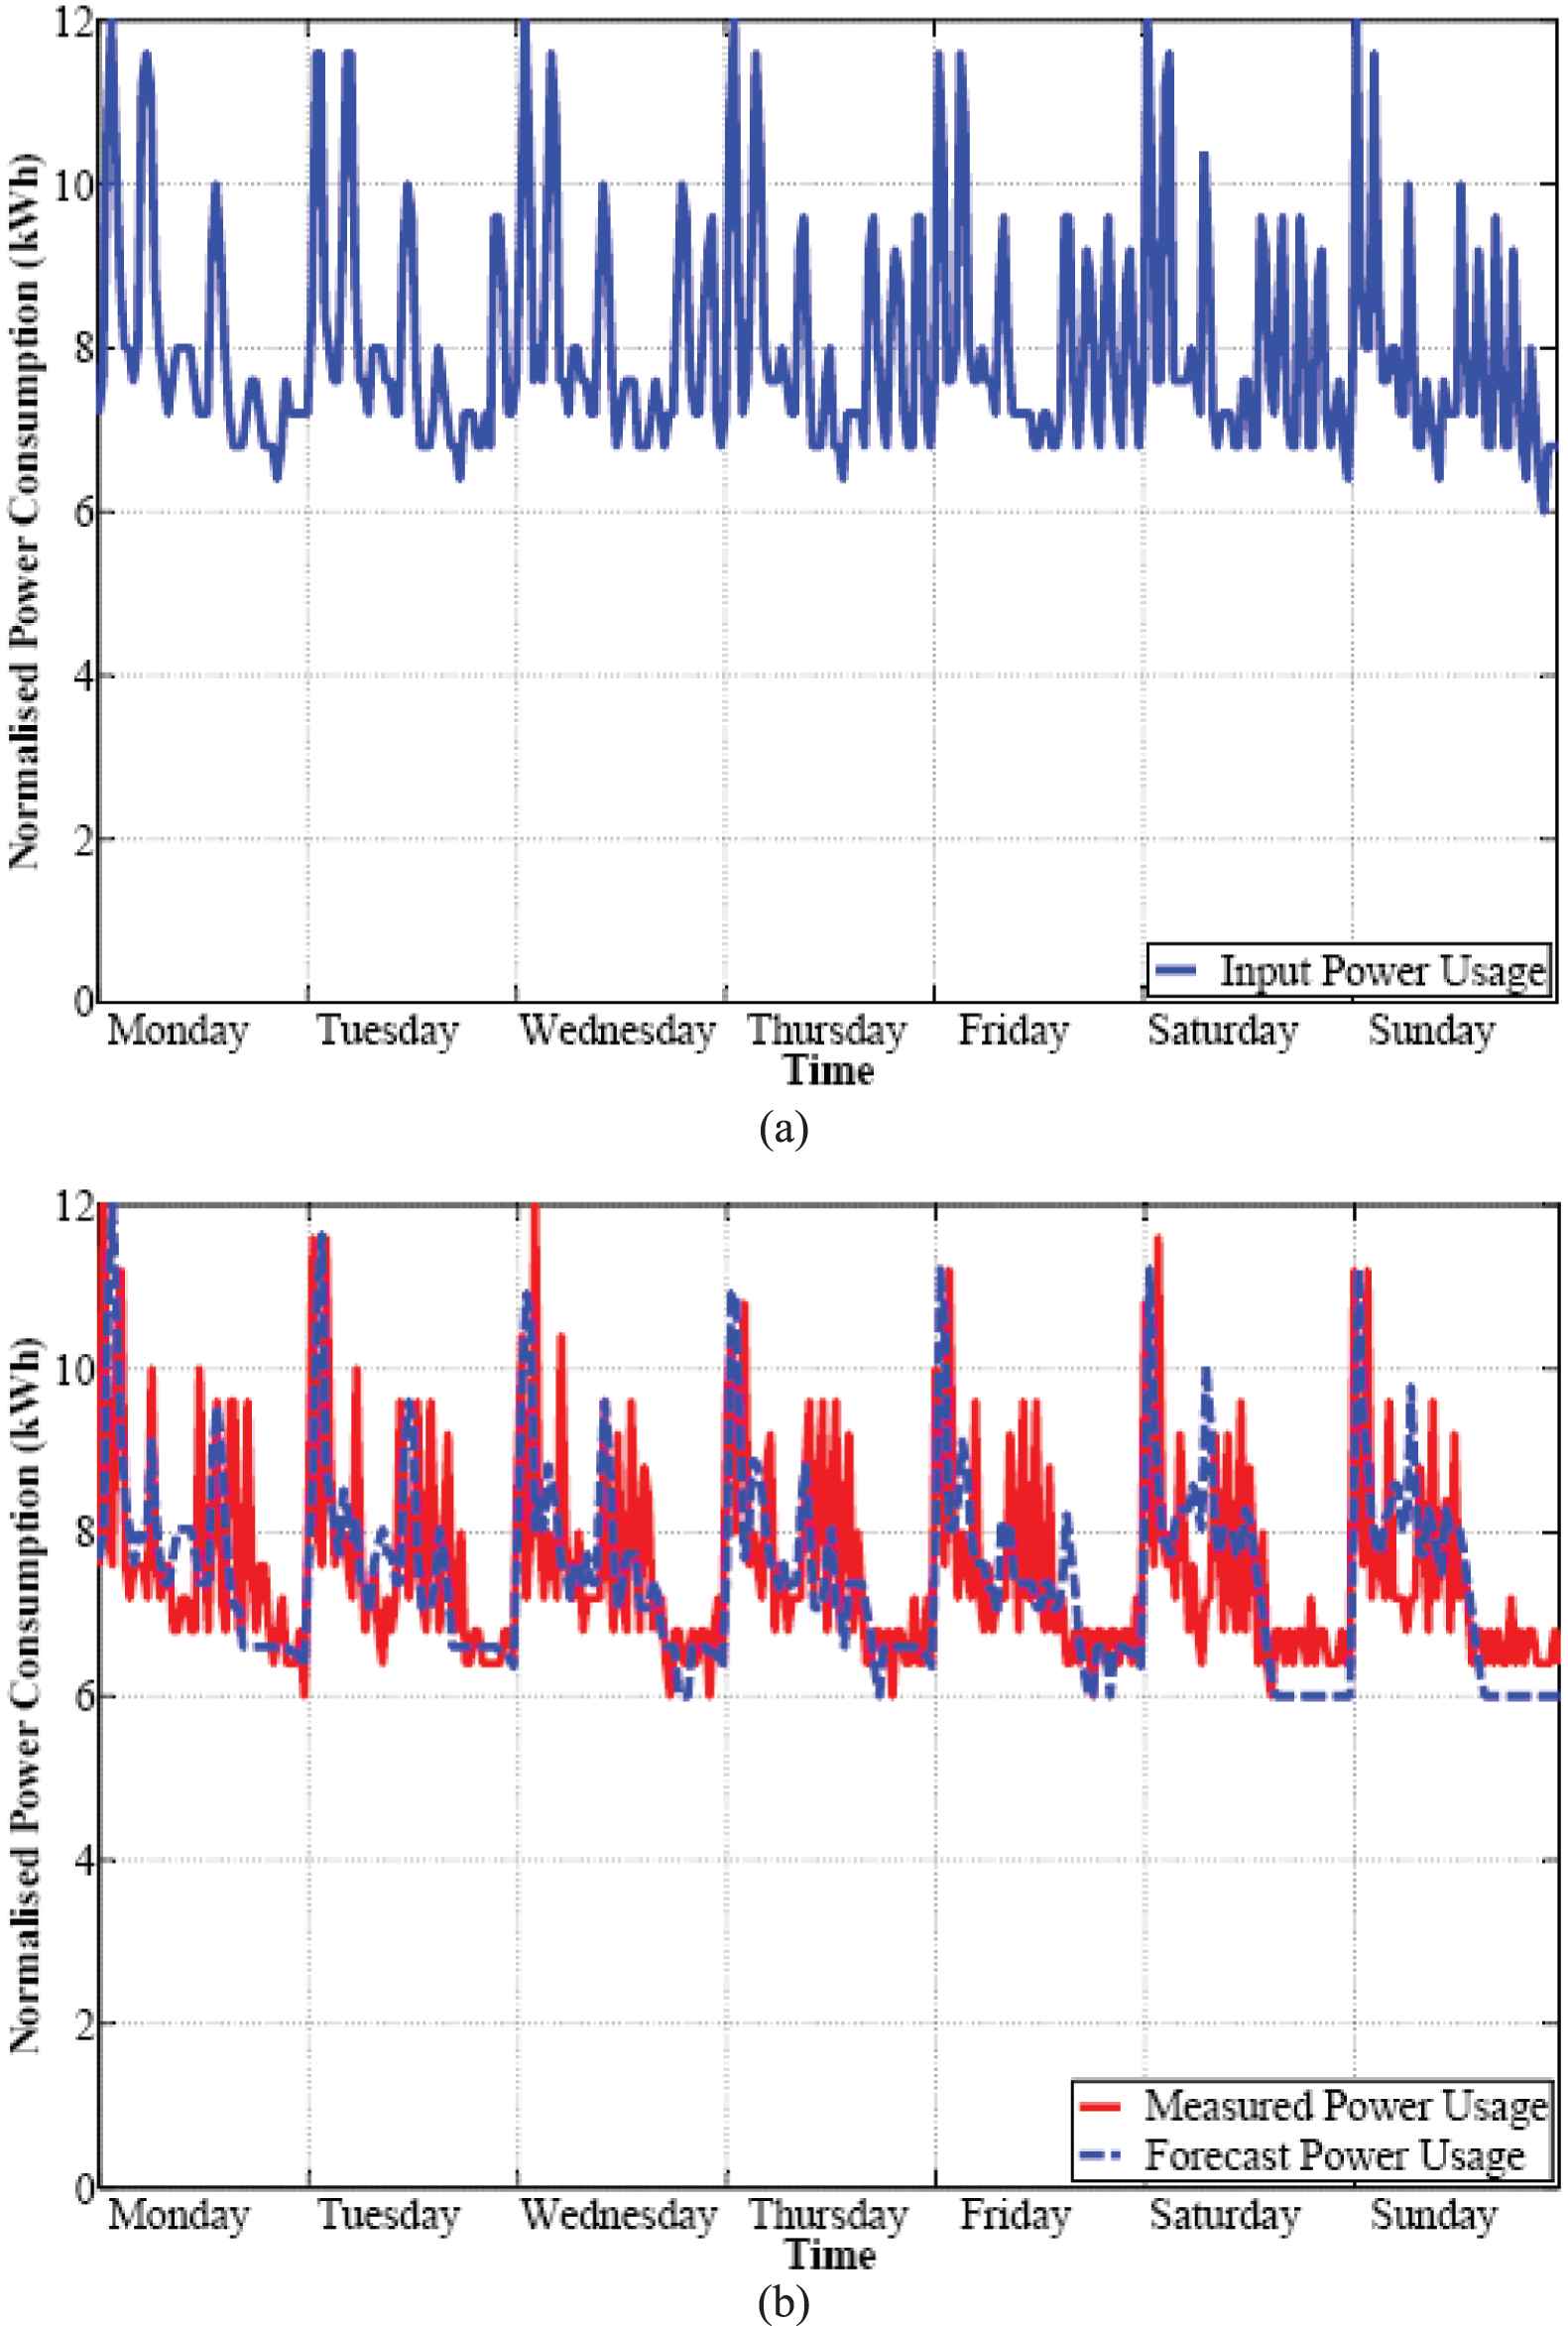
The energy usage data for this case was obtained from the Viet Nam power producer. Load power consumption profile data is normalized and shown in Figure 8(a). The area of the load profile, relative to the whole country, can be shown in Google earth.
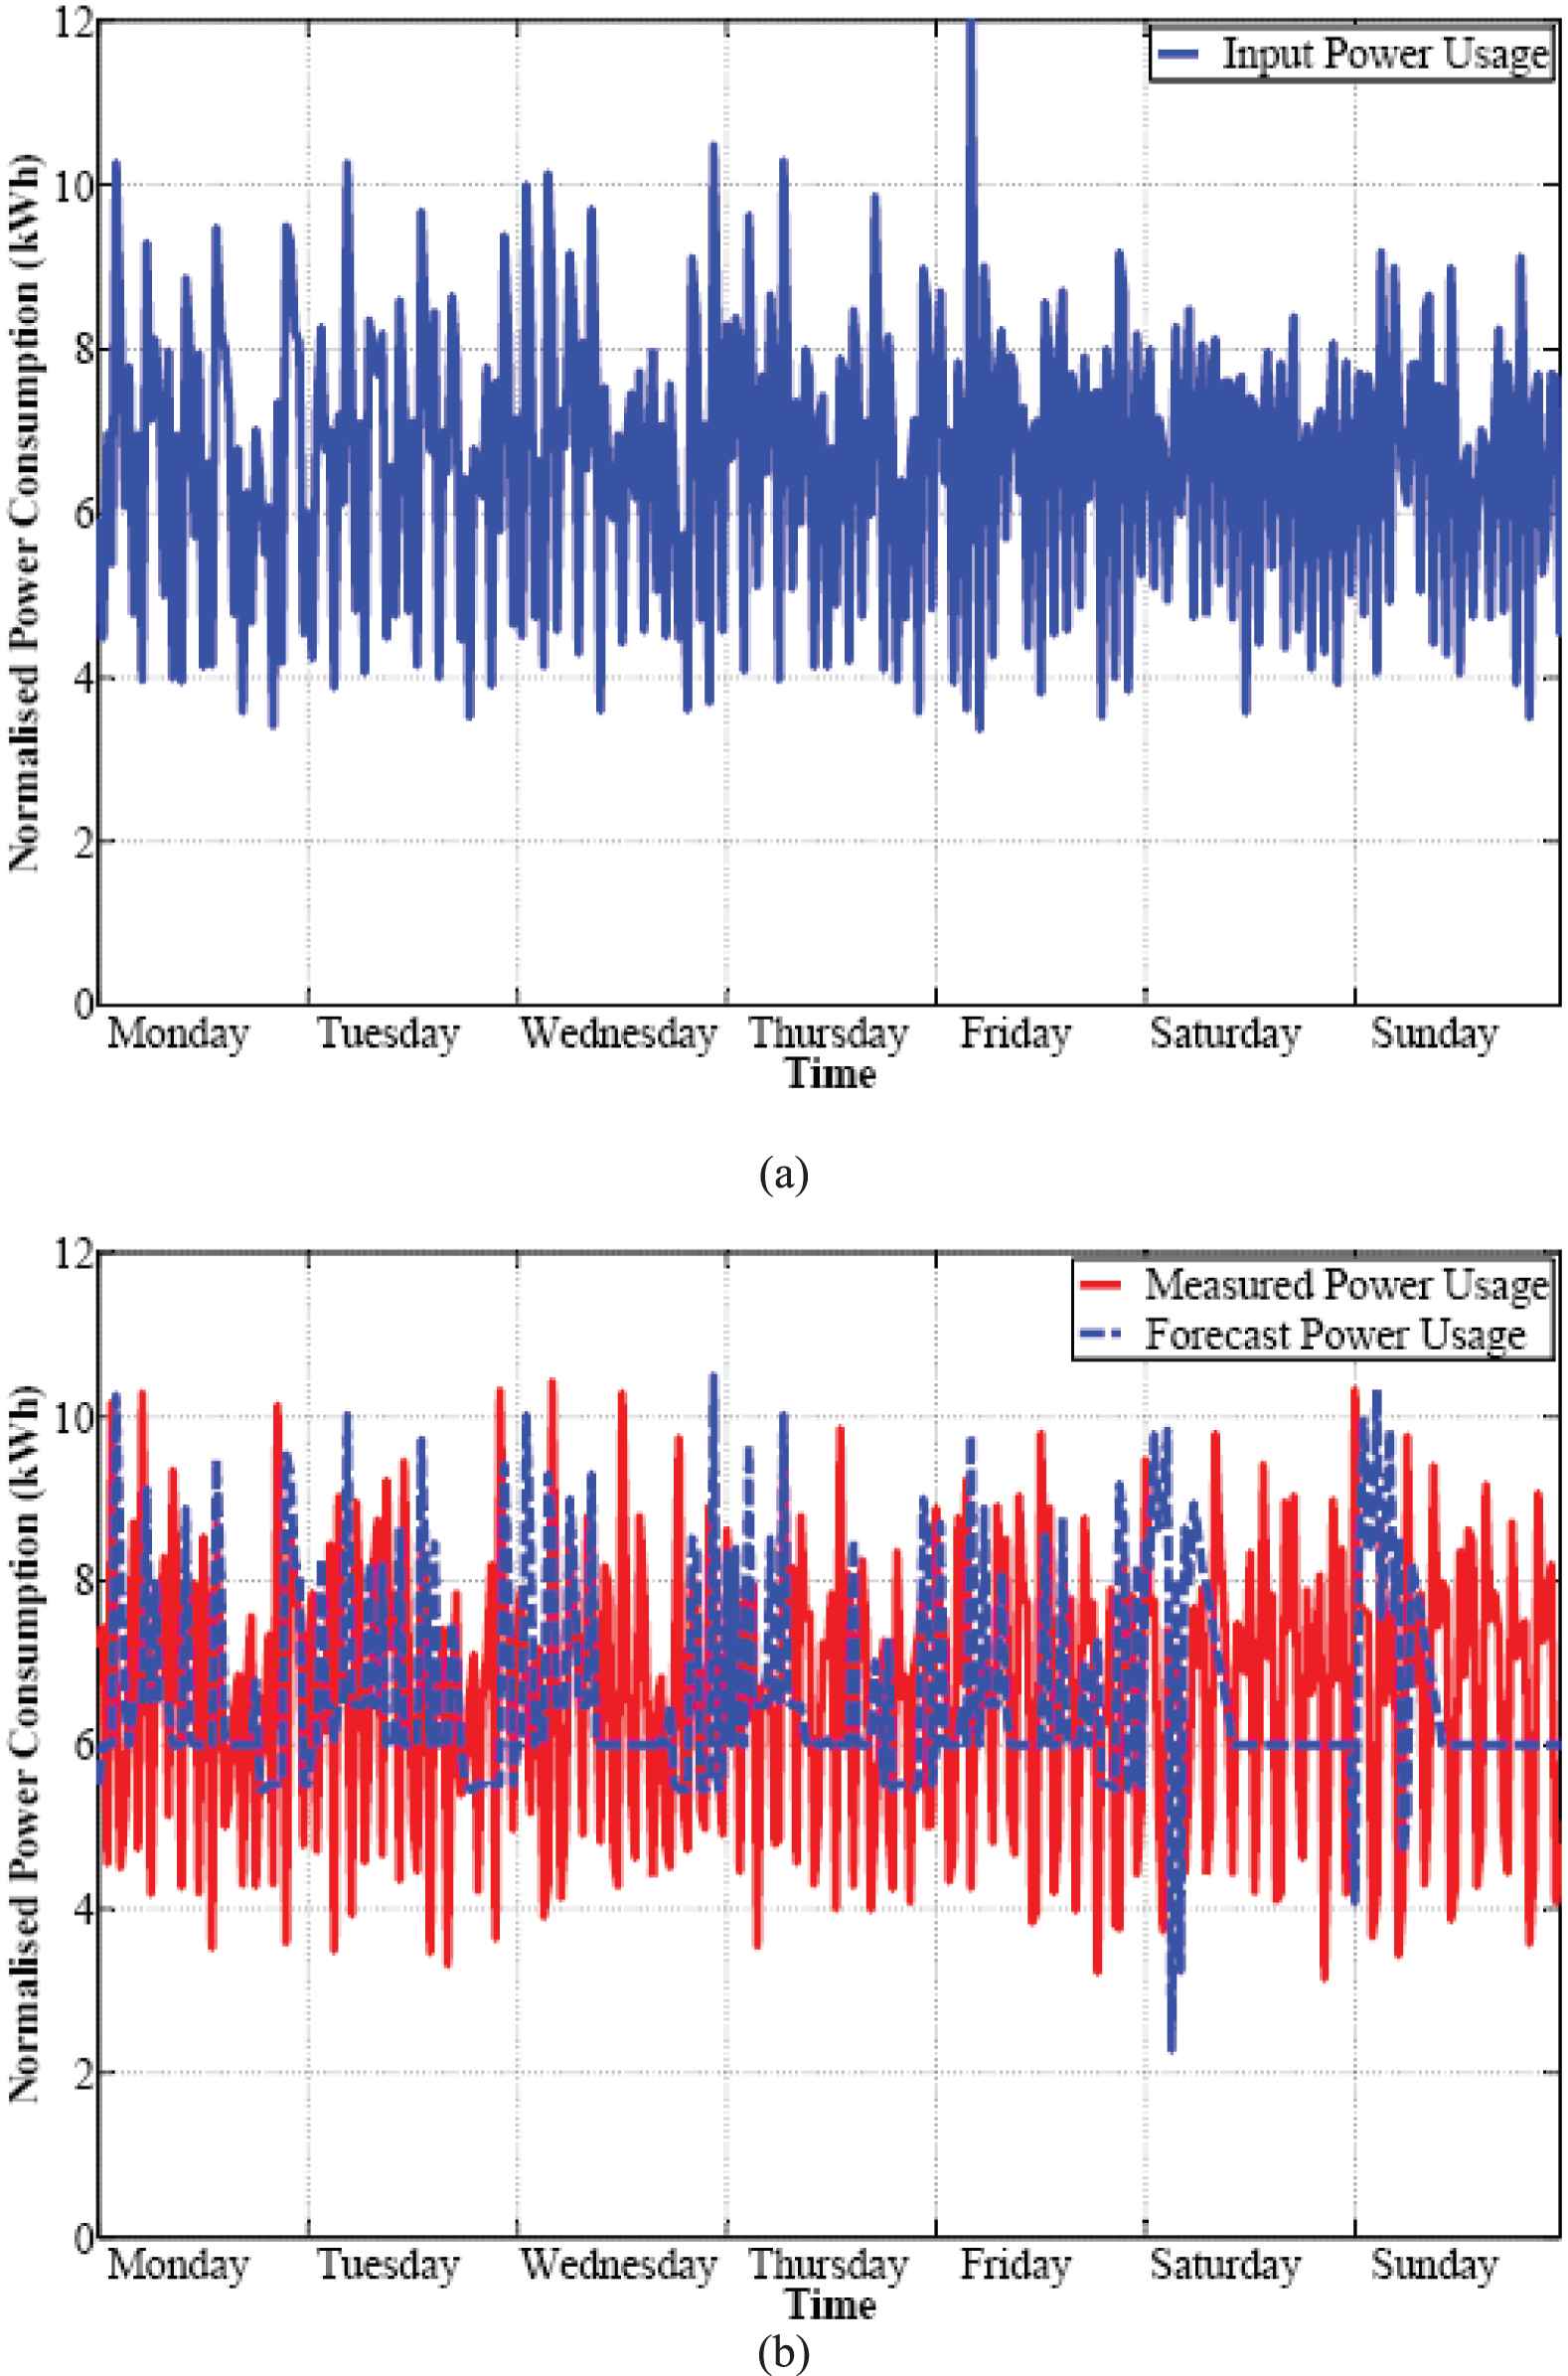
(a) Input to the proposed Fuzzy-modified Jaya optimization (MJO) load forecasting algorithm. (b) Full week forecast for the Ho Chi Minh City in Vietnam.
The full results for the load forecasting test on this load can be seen in Table 6. A graphical summary of the week-long forecast can be seen in Figure 8(b).
| Before MJO |
After MJO |
|||
|---|---|---|---|---|
| Epeak (%) | Etotal (%) | Epeak (%) | Etotal (%) | |
| Monday | 2.61 | 3.98 | 0.27 | 0.02 |
| Tuesday | 0.04 | 2.59 | 2.95 | 0.01 |
| Wednesday | 0.67 | 0.42 | 0.66 | 0.49 |
| Thursday | 4.72 | 1.28 | 1.68 | 0.02 |
| Friday | 2.28 | 5.98 | 0.15 | 0.02 |
| Week Average | 2.06 | 2.85 | 1.14 | 0.12 |
| Saturday | 38.70 | 9.93 | 0.52 | 0.02 |
| Sunday | 4.15 | 8.15 | 0.05 | 0.01 |
| Weekend Average | 21.42 | 9.03 | 0.28 | 0.01 |
| Average | 7.60 | 4.62 | 0.89 | 0.07 |
Load forecasting results for the Ho Chi Minh City, before and after the modified Jaya optimization (MJO) algorithm is implemented.
The mean peak power error through one week is 0.89 % and the mean total power error is 0.07% for the fuzzy-MJO load forecast after the MJO algorithm was implemented. When compared to the results from before the MJO algorithm implementation (Epeak - 7.60 % and Etotal - 4.62 %), it is clearly to notice that an improvement due to the MJO algorithm by factors of 8.45 and 60.26 for Epeak and Etotal respectively was observed.
3.3. Case 2—First Campus at the University
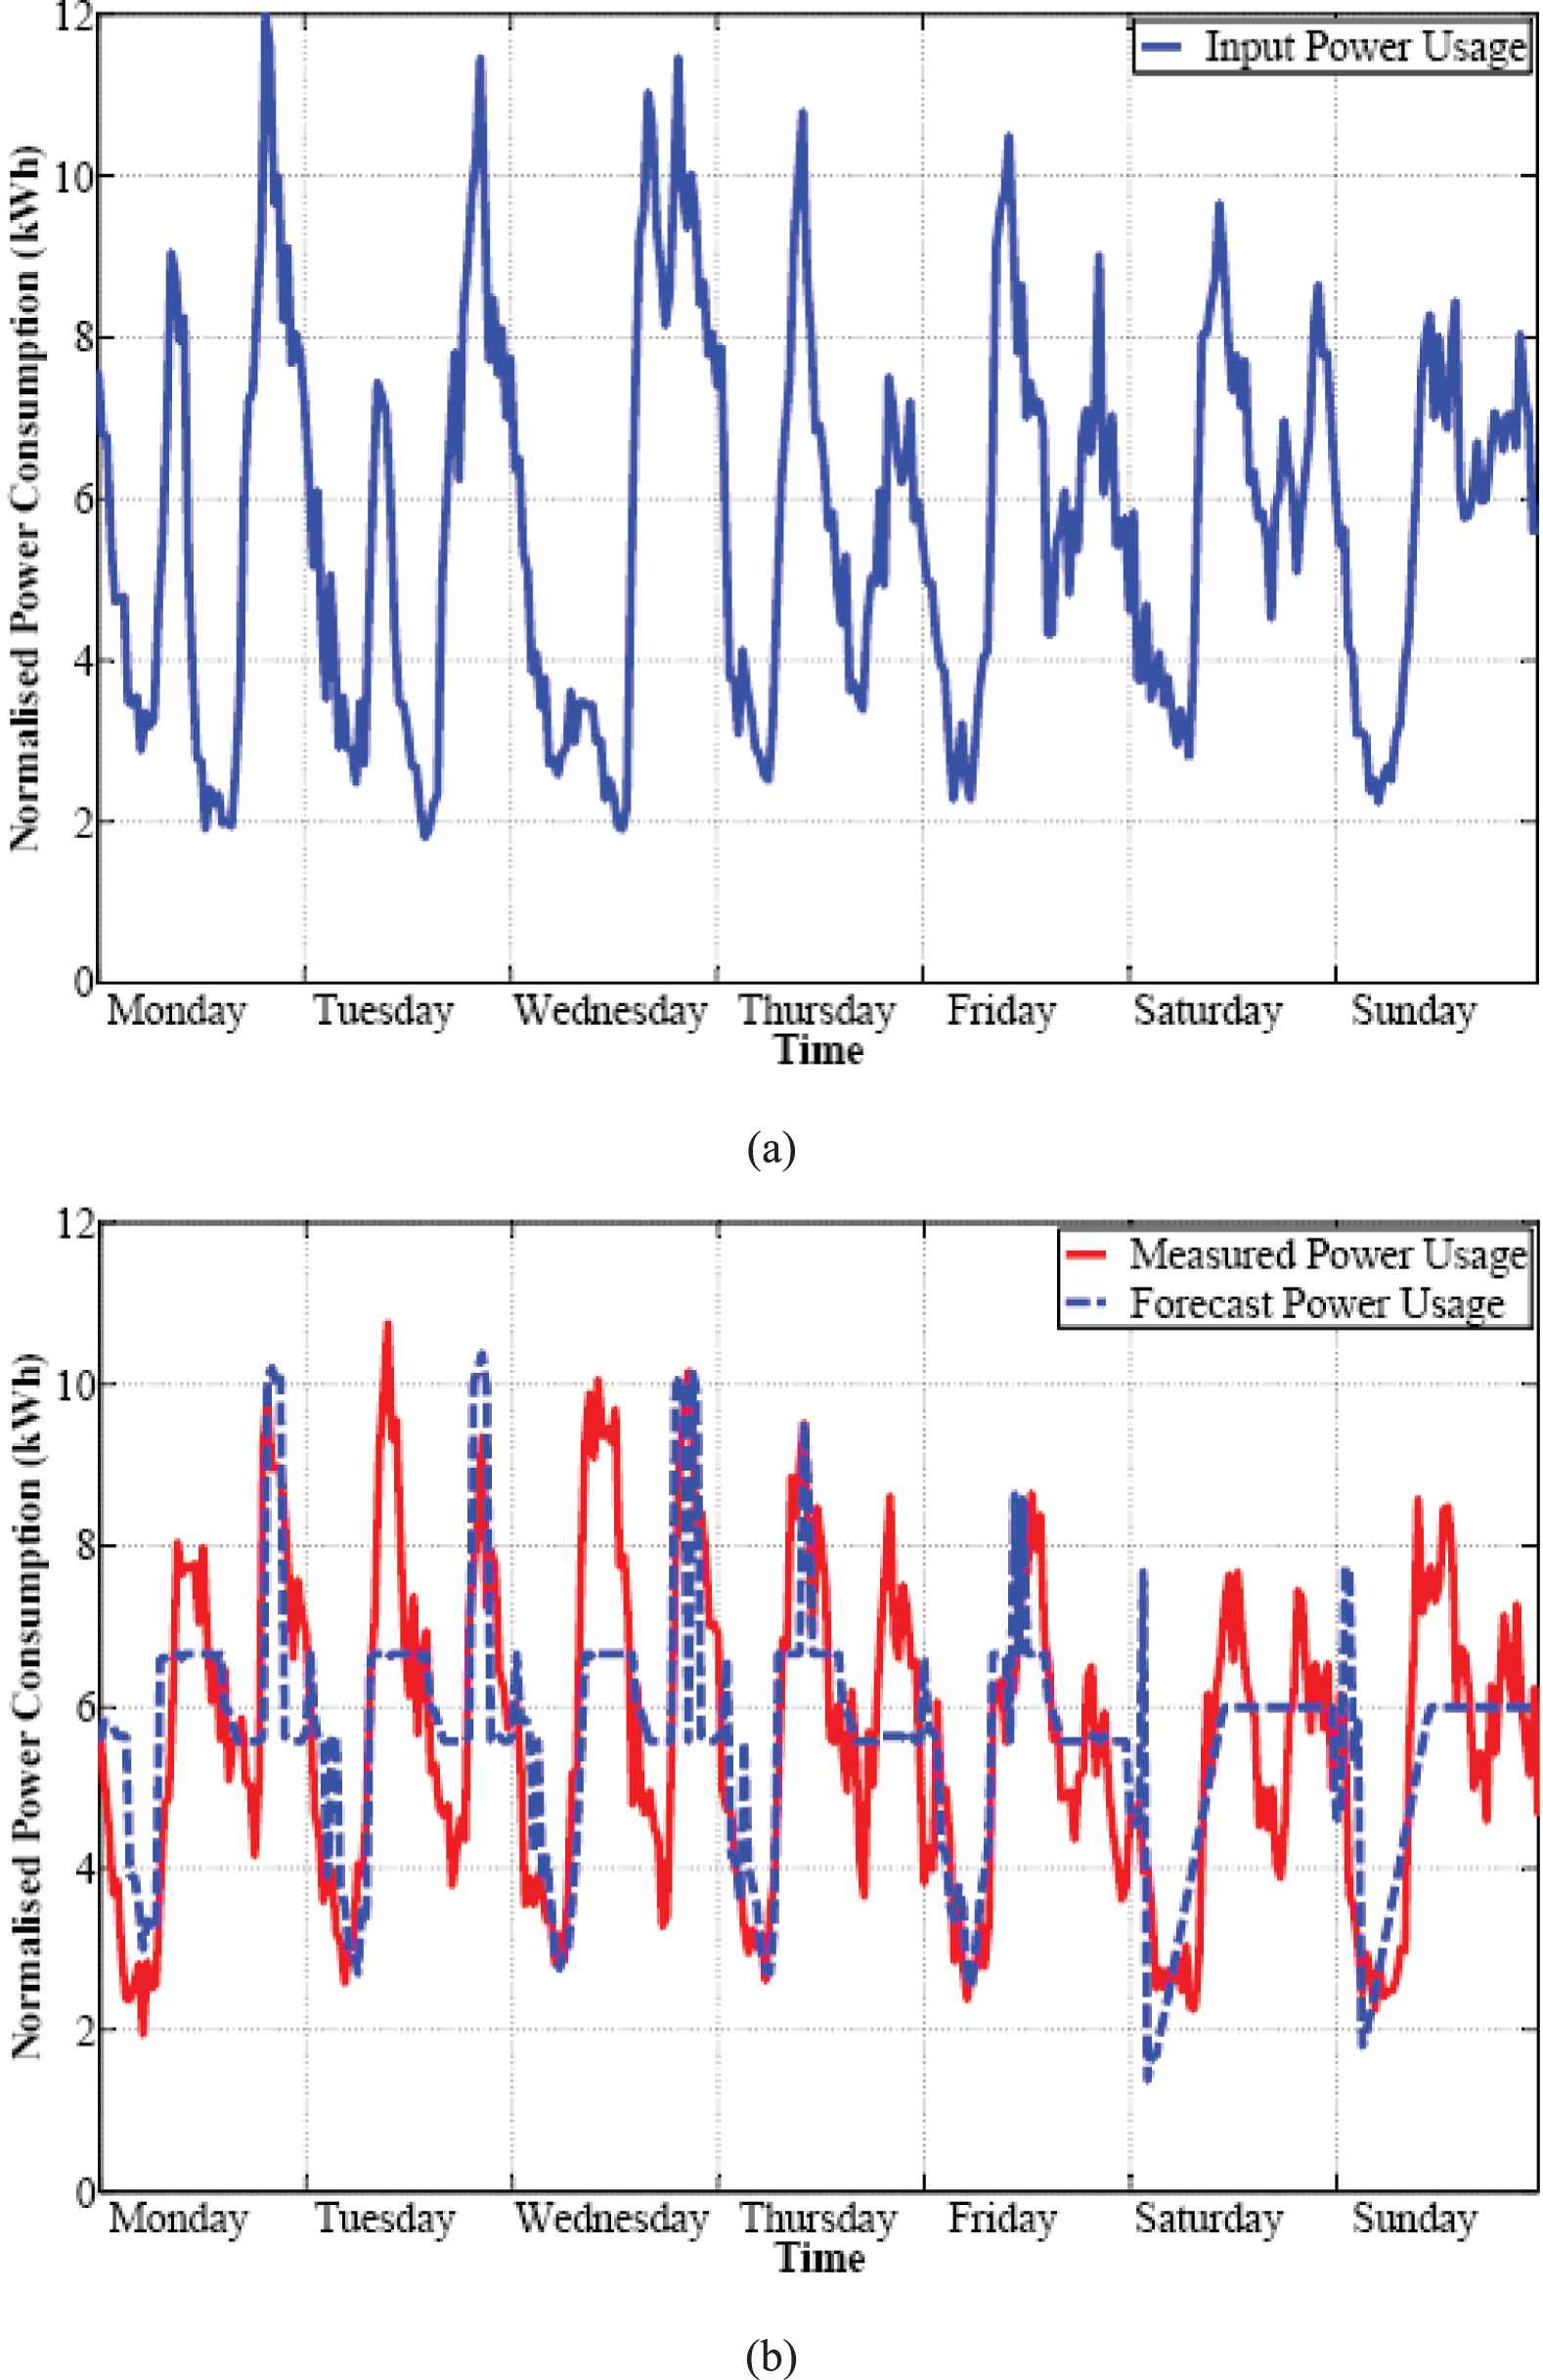
Load power consumption profile data was acquired from the installed power meters for the main feed of First Campus at the University which is normalized and shown in Figure 9(a). The full results for the load forecast test on this load can be seen in Table 7. A graphical summary of the week-long forecast can be seen in Figure 9(b).
(a) Input to the proposed Fuzzy-modified Jaya optimization (MJO) load forecasting algorithm. (b) Full week forecast for First Campus at the University.
| Before MJO |
After MJO |
|||
|---|---|---|---|---|
| Epeak (%) | Etotal (%) | Epeak (%) | Etotal (%) | |
| Monday | 3.99 | 5.73 | 0.01 | 0.02 |
| Tuesday | 4.84 | 4.78 | 0.33 | 0.02 |
| Wednesday | 7.99 | 3.62 | 8.99 | 0.01 |
| Thursday | 2.24 | 4.48 | 1.12 | 2.22 |
| Friday | 2.85 | 2.86 | 0.17 | 0.01 |
| Week Average | 4.37 | 4.28 | 2.13 | 0.45 |
| Saturday | 1.91 | 4.41 | 3.27 | 0.01 |
| Sunday | 5.53 | 9.10 | 0.19 | 0.01 |
| Weekend Average | 3.73 | 6.76 | 1.73 | 0.01 |
| Average | 4.19 | 4.99 | 2.01 | 0.31 |
Load forecasting results for First Campus at the University, before and after the modified Jaya optimization (MJO) algorithm was implemented.
The mean peak power error through one week is 2.01 % and the mean total power error is 0.31% for the fuzzy-MJO load forecast after the MJO algorithm is implemented. When results from the fuzzy forecast implementation alone (Epeak - 4.19 % and Etotal - 5.00 %) are compared to the hybrid fuzzy forecast and MJO algorithm combination, an excellent improvement due to the MJO algorithm by factors of 2.08 and 15.40 for Epeak and Etotal respectively is noticed.
3.4. Case 3—B-1 Building Residence at the University
Load power consumption profile data was acquired from the installed power meters for the main feed of the B-1 Building at the University which is normalized and presented in Figure 10(a). The complete results for this test can be seen in Table 8. A graphical summary of the week-long forecast can be seen in Figure 10(b).
(a) Input to the proposed Fuzzy-modified Jaya optimization (MJO) load forecasting algorithm. (b) Full-week forecast for the B-1 Building student residence at the University.
| Before MJO |
After MJO |
|||
|---|---|---|---|---|
| Epeak (%) | Etotal (%) | Epeak (%) | Etotal (%) | |
| Monday | 6.91 | 3.65 | 3.85 | 5.20 |
| Tuesday | 6.89 | 10.71 | 3.54 | 0.05 |
| Wednesday | 3.37 | 9.46 | 0.17 | 5.70 |
| Thursday | 5.25 | 6.26 | 0.22 | 4.10 |
| Friday | 15.87 | 12.76 | 0.09 | 5.41 |
| Week Average | 7.66 | 8.57 | 1.57 | 4.08 |
| Saturday | 33.67 | 19.25 | 0.06 | 0.58 |
| Sunday | 30.07 | 1.62 | 9.79 | 5.59 |
| Weekend Average | 31.87 | 10.44 | 4.94 | 1.57 |
| Average | 14.57 | 9.10 | 2.54 | 3.36 |
Load forecasting results for the B-1 Building at the University, before and after the modified Jaya optimization (MJO) algorithm is implemented.
The mean peak power error through one week is 2.54 % and the mean total power error is 3.36% for the proposed fuzzy-MJO load forecast after the MJO algorithm is implemented. When compared to the results from before the MJO algorithm implementation (Epeak—14.58 % and Etotal—9.10 %), an improvement due to the MJO algorithm by factors of 5.76 and 2.70 for Epeak and Etotal respectively was observed.
3.5. Case 4—B-3 Building at the University
Load profile data was acquired from the installed power meters for the B-3 building, on the First Campus at the University, normalized and shown in Figure 11(a). A wing of a single floor of the building, that was designated office area, was used for the test case to illustrate the load forecasting capability for an office environment.
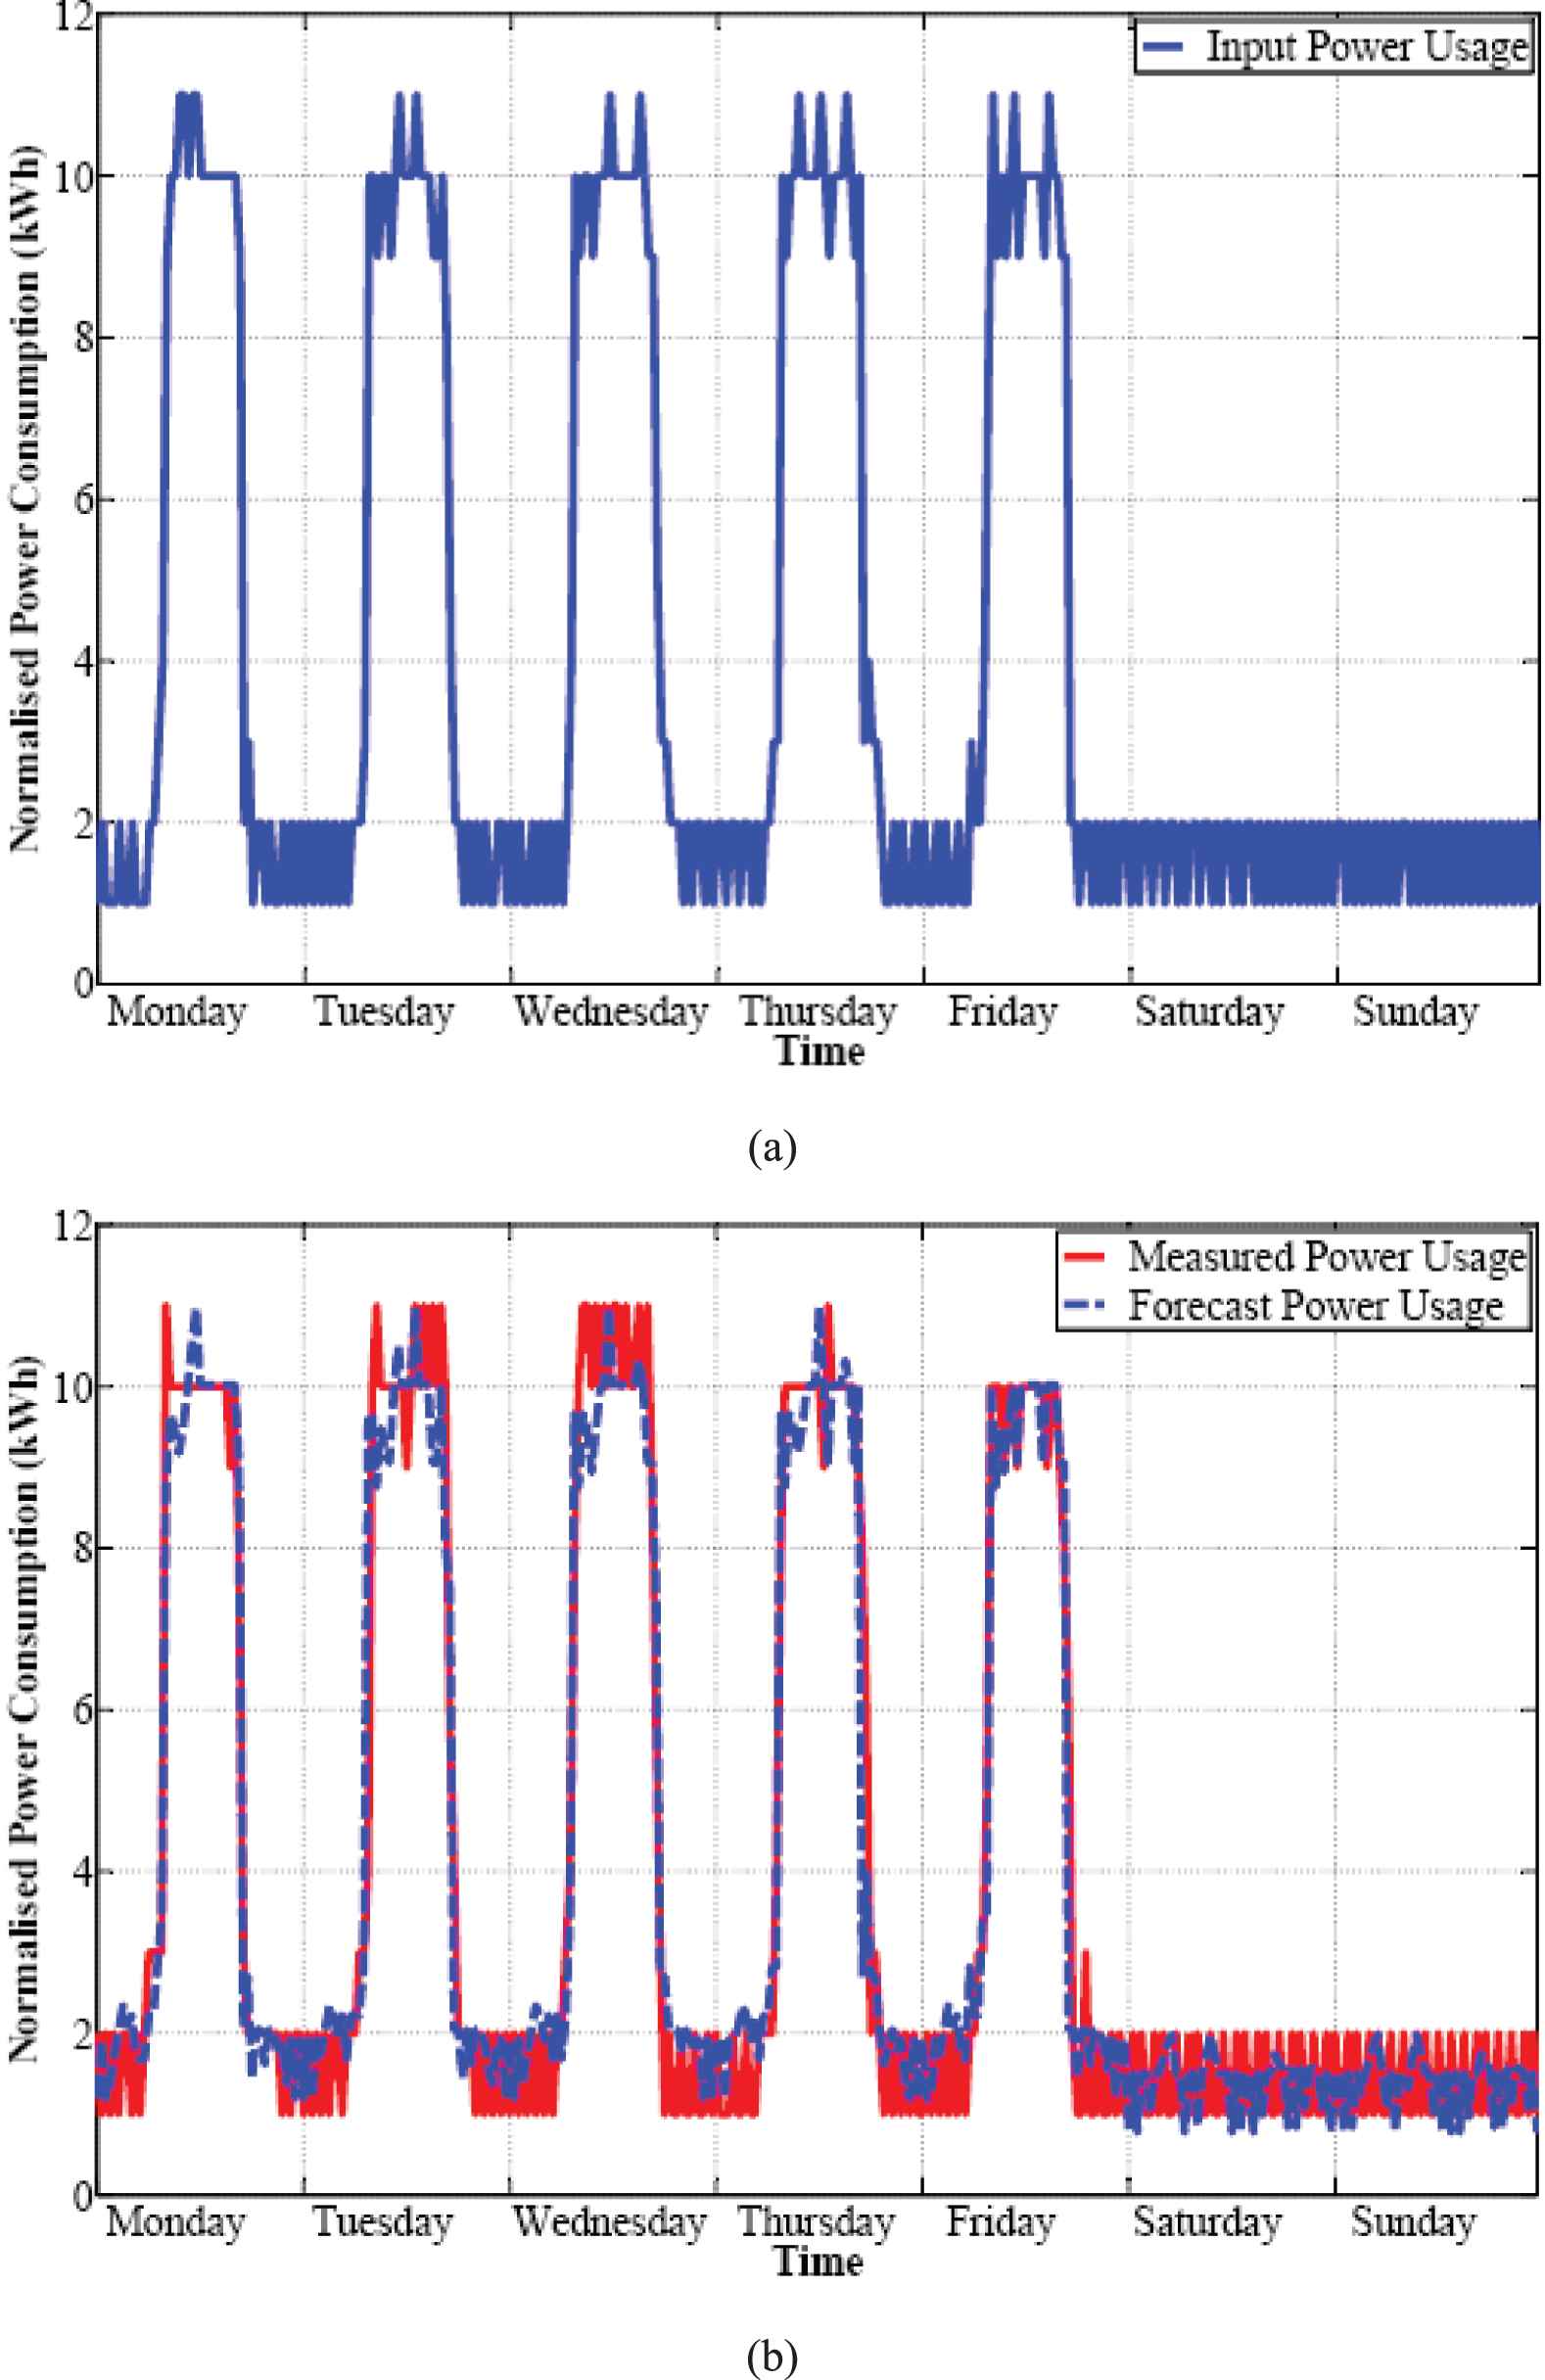
(a) Input to the proposed Fuzzy-modified Jaya optimization (MJO) load forecasting algorithm. (b) Full-week forecast for the B-3 building at the University.
The results for the load forecasting test on this load can be seen in Table 9. A graphical summary of the week-long forecast can be seen in Figure 11(b).
| Before MJO |
After MJO |
|||
|---|---|---|---|---|
| Epeak (%) | Etotal (%) | Epeak (%) | Etotal (%) | |
| Monday | 0.36 | 0.42 | 0.18 | 0.11 |
| Tuesday | 0.36 | 0.53 | 0.18 | 0.24 |
| Wednesday | 0.36 | 0.01 | 0.18 | 0.03 |
| Thursday | 0.35 | 1.26 | 0.18 | 0.02 |
| Friday | 5.01 | 3.34 | 0.20 | 0.94 |
| Week Average | 1.29 | 1.11 | 0.19 | 0.27 |
| Saturday | 1.99 | 0.11 | 0.99 | 0.03 |
| Sunday | 2.01 | 0.99 | 1.01 | 0.01 |
| Weekend Average | 2.00 | 0.55 | 1.00 | 0.02 |
| Average | 1.49 | 0.85 | 0.42 | 0.20 |
Load forecasting results for a wing of a single story of the B-3 building at the University, before and after the modified Jaya optimization (MJO) algorithm is implemented.
The mean peak power error through one week is 0.42% and the mean total power error is 0.20% for the fuzzy-MJO load forecast model after the MJO algorithm is implemented. The MJO algorithm exhibited improvements to the original fuzzy load forecasting algorithm (Epeak—1.49 % and Etotal—0.95 %) by factors of 3.57 and 4.79 for Epeak and Etotal respectively.
3.6. Case 5—Single Plug Point with a Variable Load
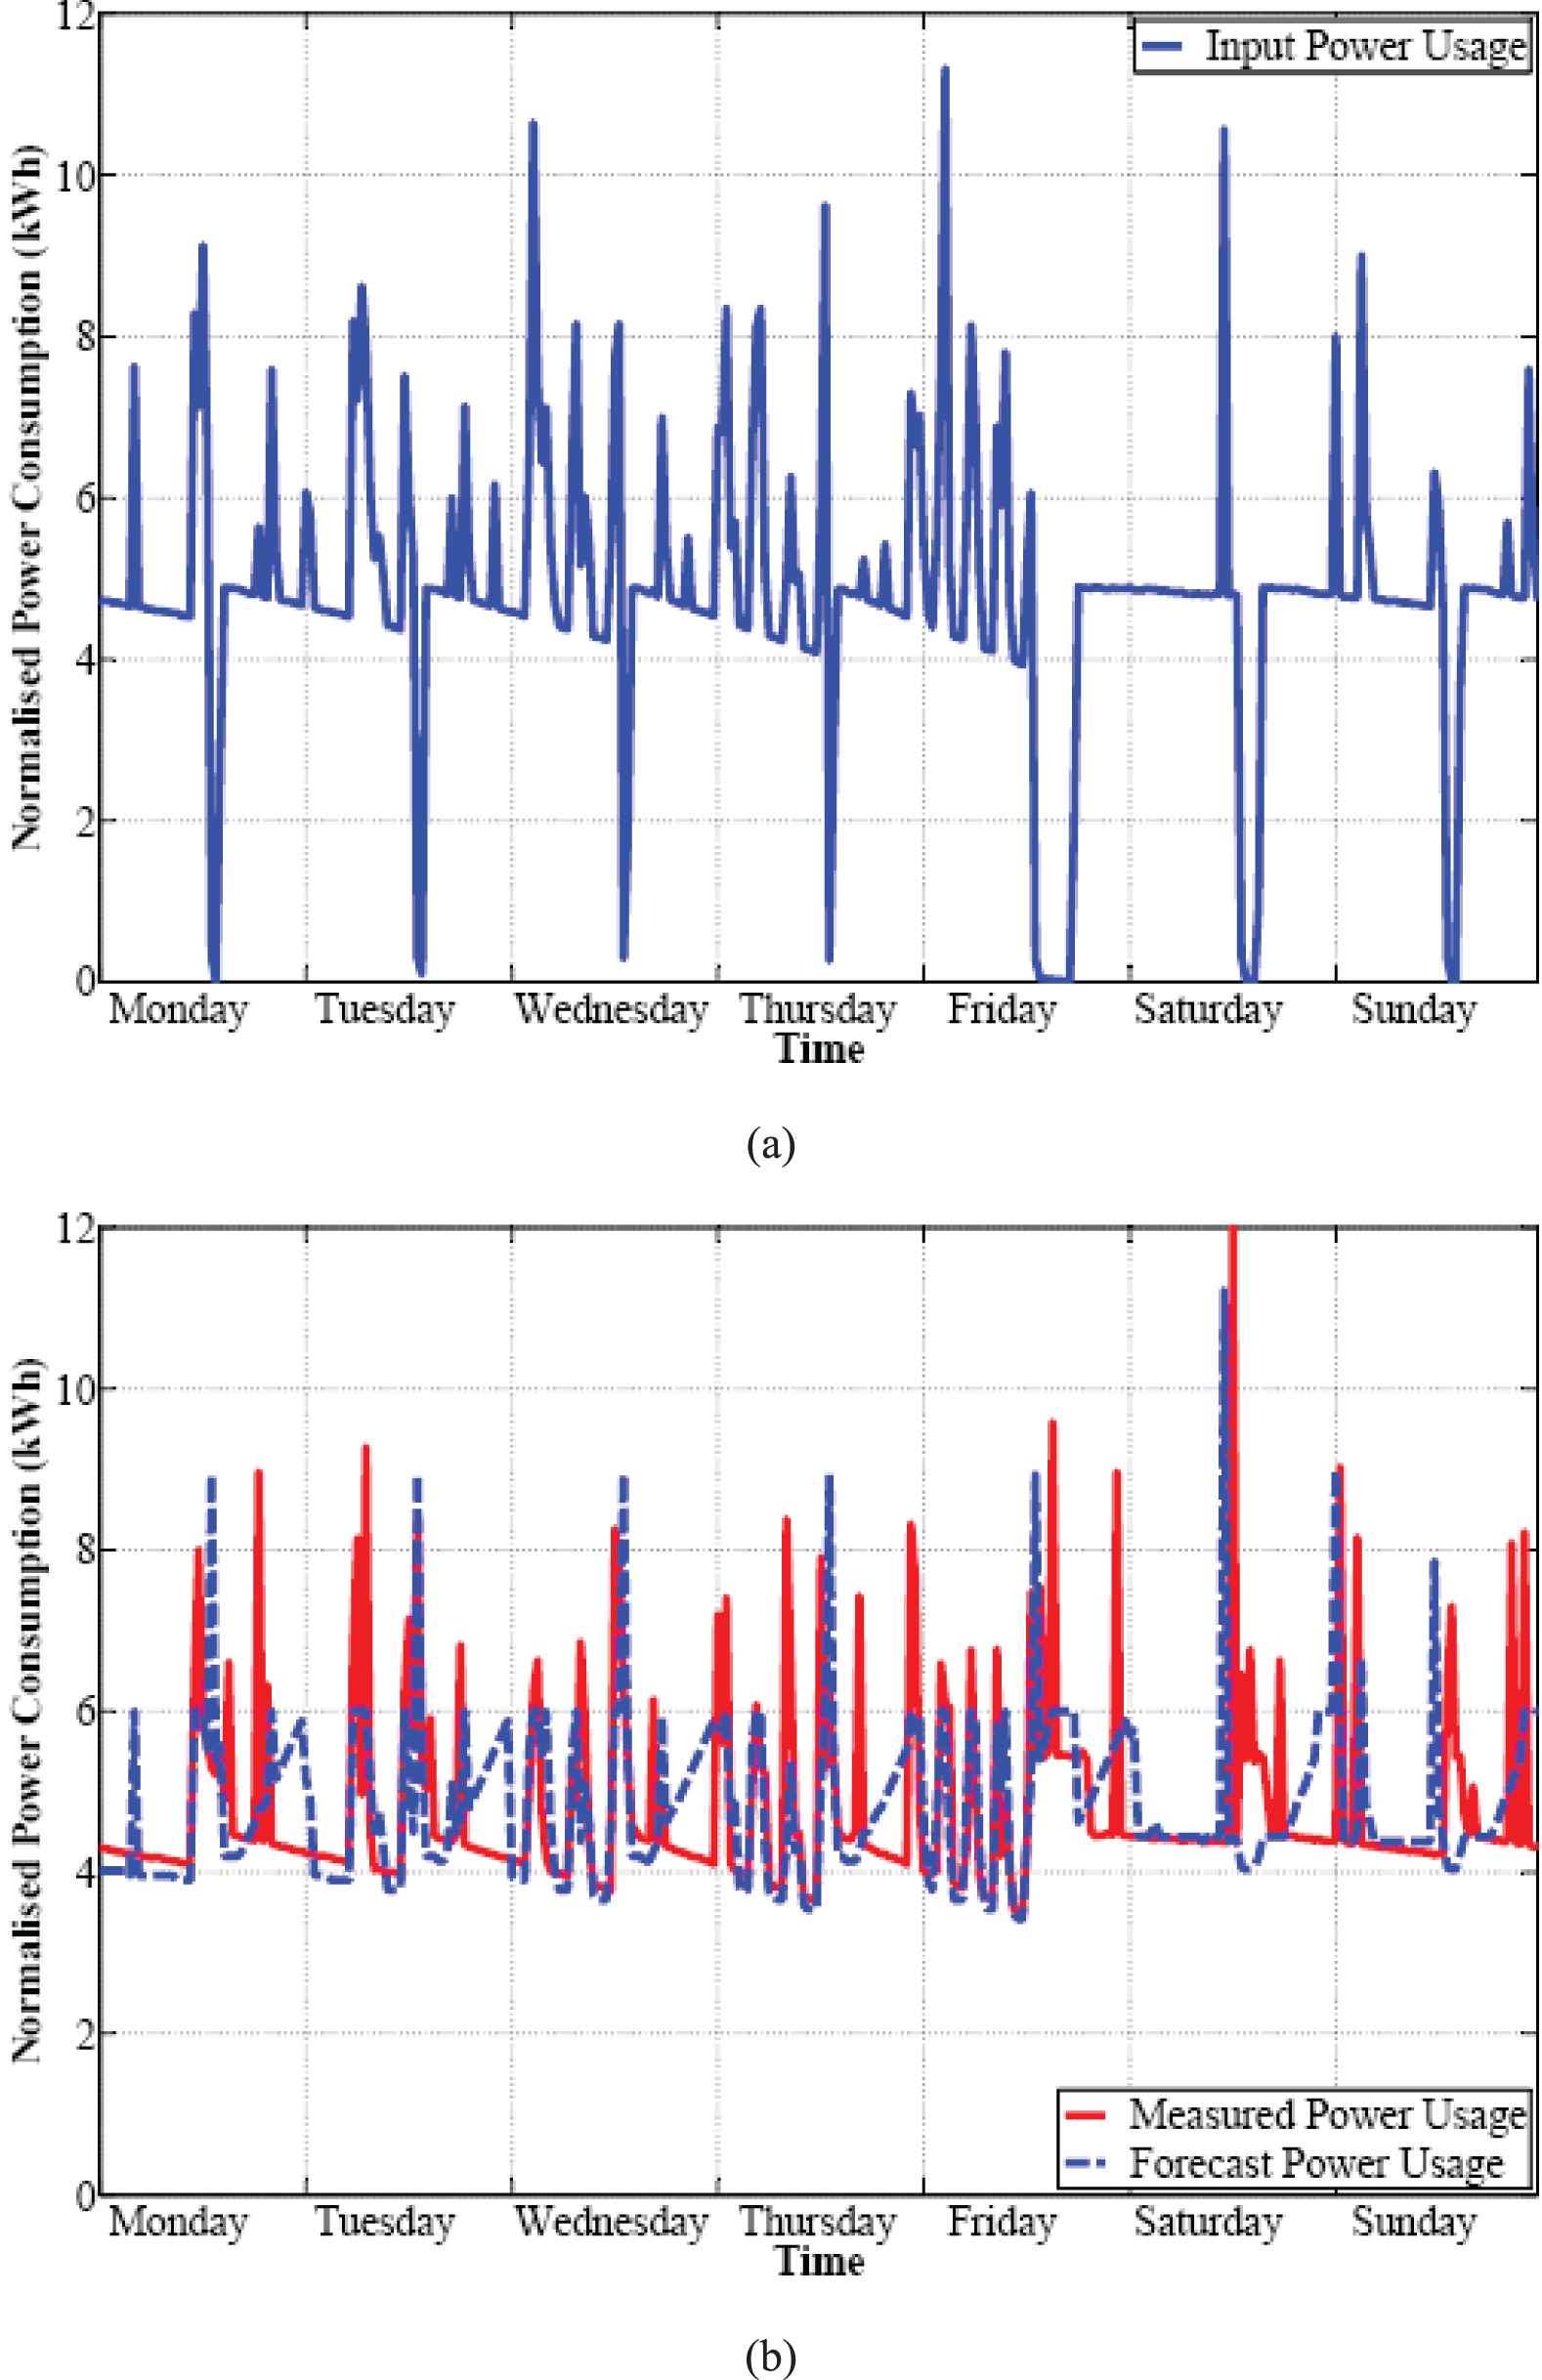
Load profile data is measured using a digital power meter. A single plug point is used, with the load being a computer and the power meter (to provide the base load) and a coffee machine as the variable (nonstochastic) load. The load could be said to be nonstochastic since the use of the coffee machine varied from day to day as well as at different times during the day.
Data input to the proposed Fuzzy-MJO load forecasting model is presented in Figure 12(a). The full results of this test can be seen in Table 10. A graphical summary of the week-long forecast can be seen in Figure 12(b).
(a) Input to the proposed Fuzzy-modified Jaya optimization (MJO) load forecasting algorithm. (b) Full-week forecast for a single plug point with a variable load.
| Before MJO |
After MJO |
|||
|---|---|---|---|---|
| Epeak (%) | Etotal (%) | Epeak (%) | Etotal (%) | |
| Monday | 2.37 | 23.63 | 0.31 | 0.30 |
| Tuesday | 6.82 | 21.84 | 3.57 | 0.49 |
| Wednesday | 15.51 | 26.49 | 8.24 | 3.28 |
| Thursday | 15.29 | 22.83 | 6.69 | 3.15 |
| Friday | 0.48 | 1.24 | 6.74 | 0.45 |
| Week Average | 8.09 | 19.21 | 5.11 | 1.53 |
| Saturday | 9.01 | 16.06 | 6.50 | 0.63 |
| Sunday | 8.31 | 18.50 | 0.33 | 1.06 |
| Weekend Average | 8.66 | 17.28 | 3.42 | 0.85 |
| Average | 8.25 | 18.66 | 4.63 | 1.34 |
Load forecasting results for a single plug point with a variable load, before and after the modified Jaya optimization (MJO) algorithm was implemented.
The mean peak power error through one week is 4.63% and the mean total power error is 1.34% for the fuzzy-MJO load forecast after the MJO algorithm is implemented. Then this result is compared to the results from before the MJO algorithm implementation (Epeak—8.25 % and Etotal—18.66 %), it is clear to note that an improvement due to the MJO algorithm by factors of 1.78 and 13.96 for Epeak and Etotal respectively is shown.
4. RESULT ANALYSIS OF FIVE TEST CASES
A summary of the full-week forecasts for each of the case studies is shown in Table 11. It illustrates a consolidated view of the performance criteria (before and after implementation of the MJO algorithm) as well as the MJO algorithm improvement factors.
| Before MJO |
After MJO |
MJOimprove |
||||
|---|---|---|---|---|---|---|
| Epeak (%) | Etotal (%) | Epeak (%) | Etotal (%) | Epeak | Etotal | |
| Case 1 | 7.60 | 4.6 | 0.90 | 0.08 | 8.44 | 57.75 |
| Case 2 | 4.19 | 5.00 | 2.01 | 0.32 | 2.08 | 15.63 |
| Case 3 | 14.5 | 9.10 | 2.53 | 3.37 | 5.76 | 2.71 |
| Case 4 | 1.49 | 0.96 | 0.42 | 0.20 | 3.55 | 4.74 |
| Case 5 | 8.25 | 18.66 | 4.63 | 1.34 | 1.78 | 13.93 |
| Average | 7.22 | 7.67 | 2.10 | 1.06 | 4.32 | 18.95 |
Overall average results for the week-ahead forecast for each of the five case studies, showing the results for before and after the modified Jaya optimization (MJO) algorithm was implemented as well as the MJO improvement factor.
As can be seen in Table 11 above, the average peak energy error before the MJO algorithm was implemented was 7.22%. This was reduced to 2.10% after implementing the MJO algorithm, indicating an improvement factor of 4.32 times.
This implies that, on average across the five case studies, the MJO algorithm hybrid fuzzy load forecasting algorithm reduced the errors by approximately four times when compared to the fuzzy load forecasting algorithm only.
The same inferences can be made for the total energy error. The error before the MJO algorithm was implemented was 7.67%. This was reduced to 1.06% after implementing the MJO algorithm. Thus an improvement factor of 18.95 times was observed.
By analyzing the results abovementioned the followed observations are made with respect to the load profiles, the load forecasting algorithm and the corresponding errors (performance criteria):
Week and weekend load profiles are very similar for the Ho Chi Minh City and the First Campus load.
B-1 Building Residence and the single plug point had a more discernable difference between the week and weekend load profiles.
B-3 Building had the most distinct difference between the week and weekend load profile.
The proposed method seems rather susceptible to abrupt variations in the load.
Both defined errors are high in case remarkable differences are detected from the tested week data and the algorithm input week data.
The peak energy error is influenced mostly via variations in the energy consumption profile than the total error.
Due to the definition of the performance criteria, a surplus or deficit in peak forecast and total energy usage forecast could not be distinguished based on the numerical value only.
The computation time for the load forecasting algorithm is, on average, less than two seconds. However, the MJO algorithm computation time is approximately two hours when implemented using a 4.00 GHz CPU with 4GB RAM. This illustrates the need to operate the load forecasting algorithm in “real-time,” while the MJO algorithm needs to be implemented separately before integrating the results into the system.
Although the errors varied substantially, the proposed Fuzzy-MJO load forecast method is proved to obtain well operation. The MJO algorithm takes an increased calculation time when compared to the actual fuzzy load forecasting calculation time due to the number of variables, population size and the maximum number of generations. However, due to the improvement exhibited on the performance criteria, it is still highly recommended for use in the overall algorithm.
Furthermore, as to show the superiority of the Fuzzy-MJO algorithm proposed in this manuscript compared to the latest other algorithms, the load profile data used in Case 4, acquired from the installed power meters for the B-3 building, on the First Campus at the University, normalized and shown in Figure 11(a), is applied to load forecasting test and to compare between the proposed Fuzzy-MJO algorithm with the other recent algorithms (including predictive weighted neural network introduced by Lang et al. in [18] and Ant hybrid Colony–Fuzzy algorithm proposed by Luy in [27]). Table 12 presents the comparative load forecasting results between proposed Fuzzy-MJO with these other recent algorithms.
| Predictive Weighted NN |
Ant Colony–Fuzzy |
Proposed Fuzzy-MJO |
||||
|---|---|---|---|---|---|---|
| (Lang et al. [18]) |
(Luy et al. [27]) |
|||||
| Epeak (%) | Etotal (%) | Epeak (%) | Etotal (%) | Epeak (%) | Etotal (%) | |
| Monday | 0.21 | 0.31 | 0.19 | 0.11 | 0.18 | 0.11 |
| Tuesday | 0.24 | 0.33 | 0.21 | 0.24 | 0.18 | 0.24 |
| Wednesday | 0.22 | 0.27 | 0.22 | 0.31 | 0.18 | 0.03 |
| Thursday | 0.23 | 0.35 | 0.19 | 0.22 | 0.18 | 0.02 |
| Friday | 0.21 | 0.44 | 0.24 | 0.62 | 0.20 | 0.94 |
| Week Average | 0.22 | 0.34 | 0.21 | 0.32 | 0.19 | 0.27 |
| Saturday | 0.99 | 0.05 | 1.01 | 0.07 | 0.99 | 0.03 |
| Sunday | 1.09 | 0.11 | 1.07 | 0.03 | 1.01 | 0.01 |
| Weekend Average | 1.05 | 0.08 | 1.04 | 0.05 | 1.00 | 0.02 |
| Average | 0.52 | 0.26 | 0.47 | 0.25 | 0.42 | 0.20 |
Load forecasting results for a wing of a single story of the B-3 building at the University, between the proposed Fuzzy-modified Jaya optimization (MJO) and other recent algorithms.
The comparative load forecasting results presented in Table 12 clearly demonstrate the superiority and the performance of proposed Fuzzy-MJO in comparison with recent modern load forecast algorithms.
In summary, data from one week prior to the test as the input is found to yield the most accurate results, by a factor of 1.4 times in comparison with the other test cases. Using this knowledge, the proposed Fuzzy-MJO algorithm is tested on five different test cases. They are the Ho Chi Minh City in Vietnam, First campus at the HCM City University of Technology-VNU HCM, B-1 Building student residence at the University and B-3 building at the University, as well as a single plug point with a variable load. The fuzzy load forecast algorithm indicated favorable results using the a priori knowledge for configuration. However, the MJO algorithm has indicated a marked improvement to the results.
The most impressive improvement is observed for the Ho Chi Minh City case, showing an improvement of 8.44 and 57.75 times for the peak and total power errors. The lowest improvement factors relate to the B-3 building at the University case, still showing an improvement of 3.55 and 4.75 times for each of the above errors respectively. This is due to the load forecasting algorithm being designed for the B-3 building at the University case data originally.
The average peak energy error for all the presented cases, before implementing the MJO algorithm, is 7.22%. This is reduced to 2.10%, thus showing an improvement of 4.32 times. The average total energy error, before implementing the MJO algorithm, is 7.67%. Implementing the MJO algorithm reduces this error to 1.06% indicating an improvement of 18.95 times.
5. CONCLUSIONS
A novel hybrid Fuzzy-MJO load forecasting algorithm is developed, fulfilling assumptions and constraints, in MATLAB® platform combining the fuzzy logic toolbox and optimization MJO algorithm to generate the desired subsystems to make up the algorithm. The inputs to the algorithm include the week/weekend day-time and the historical energy consumption. The performance criteria for the proposed technique are defined to be the peak and the total power errors, both in a 24-hour cycle. Due to the computation time of the MJO algorithm (approximately half an hours), the optimization loop could not be operated in real-time. Thus the fuzzy logic-based load forecaster computed the forecast in approximately two seconds and thus could be operated in real-time if required. Moreover, the comparative load forecasting results between proposed Fuzzy-MJO with the latest other algorithms are shown to prove the superiority of the algorithm proposed.
CONFLICT OF INTEREST
There is not any conflict of interest in this study.
AUTHORS' CONTRIBUTIONS
The sole author does all of this paper.
ACKNOWLEDGMENTS
This research is funded by Vietnam National University of Ho Chi Minh City (VNU-HCM) under grant number B2020-20-04. We acknowledge the support of time and facilities from Ho Chi Minh City University of Technology (HCMUT), VNU-HCM for this study.
REFERENCES
Cite this article
TY  - JOUR
AU  - Ho Pham Huy Anh
PY  - 2020
DA  - 2020/06/29
TI  - Fuzzy Load Forecast with Optimized Parametric Adjustment Using Jaya Optimization Algorithm
JO  - International Journal of Computational Intelligence Systems
SP  - 875
EP  - 892
VL  - 13
IS  - 1
SN  - 1875-6883
UR  - https://doi.org/10.2991/ijcis.d.200617.002
DO  - 10.2991/ijcis.d.200617.002
ID  - Anh2020
ER  -