
Who Is the Designer? ARC-100 Database and Benchmark on Architecture Classification
 , Shih-Yuan Wang2, Sze-Teng Liong3, *, , Chieh-En Huang3, Yi-Chen Hsieh3, Hsiang-Yu Wang3, Wen-Hung Lin3, , Y. S. Gan4
- DOI
- 10.2991/ijcis.d.200824.001How to use a DOI?
- Keywords
- Architecture; Building; Classification; Segmentation; CNN
- Abstract
Architecture is about evolution, there exist many types of architectural styles that depend on the geography, traditions, and culture of the particular regions. An architectural designer may have a similar preference in creating the new architectural building, which can be easily recognized from the physical attributes and characteristics. This paper performs an architect classification based on the outward appearance of the building. An architecture database with 100 images (ARC-100) that have balanced class distribution is constructed. Among the architectural buildings, the best performance is 71% for 5-class classification. Convolutional neural networks (CNNs) have demonstrated breakthrough performance on various classification tasks in recent studies, and even outperform human experts in specific tasks. Thus, for the baseline evaluation, multiple pretrained CNN models are employed with slight modifications. Prior to the feature extraction and classification processes, the removal of background noise is performed using two approaches: manually and automatically. The former approach requires high human intervention, while the latter utilizes the cutting-edge object segmentation technology, namely mask regional convolutional neural network (R-CNN). The illustration of the experiment training progress and the confusion matrix are reported, to allow further interpretation and analysis for the model trained. Notably, this is the first work that performs automatic classification based on architectural styles. This framework can be used to improve the cultural understanding and practices in providing education for holistic development and enhance the learning experience and progressions from an aesthetic perspective.
- Copyright
- © 2020 The Authors. Published by Atlantis Press B.V.
- Open Access
- This is an open access article distributed under the CC BY-NC 4.0 license (http://creativecommons.org/licenses/by-nc/4.0/).
1. INTRODUCTION
The facade in architecture often provides clues to perceive the designer's experience as it can reflect one's logical, originative, and mathematical thinking. In previous research works, there are many findings discussed in identifying the buildings on maps or pictures. In contrast, there is relatively few analysis that is focused on subtle and detailed building recognition. There are several designs for buildings and facades, such as skyscrapers, housing, temples, industrial, and factory buildings, as shown in Figure 1. Some architects are inspired by existing buildings or product and it can be the main base for them to extend their creativity to develop novel architectural concepts and design innovative solutions. Nonetheless, an architect may have idiomatic style when designing a facade, such as the elements of stone, wood, timber, brick, and glass. Some of the world-renowned designers' architectural works are easily identifiable for their unique applications of materials and details.
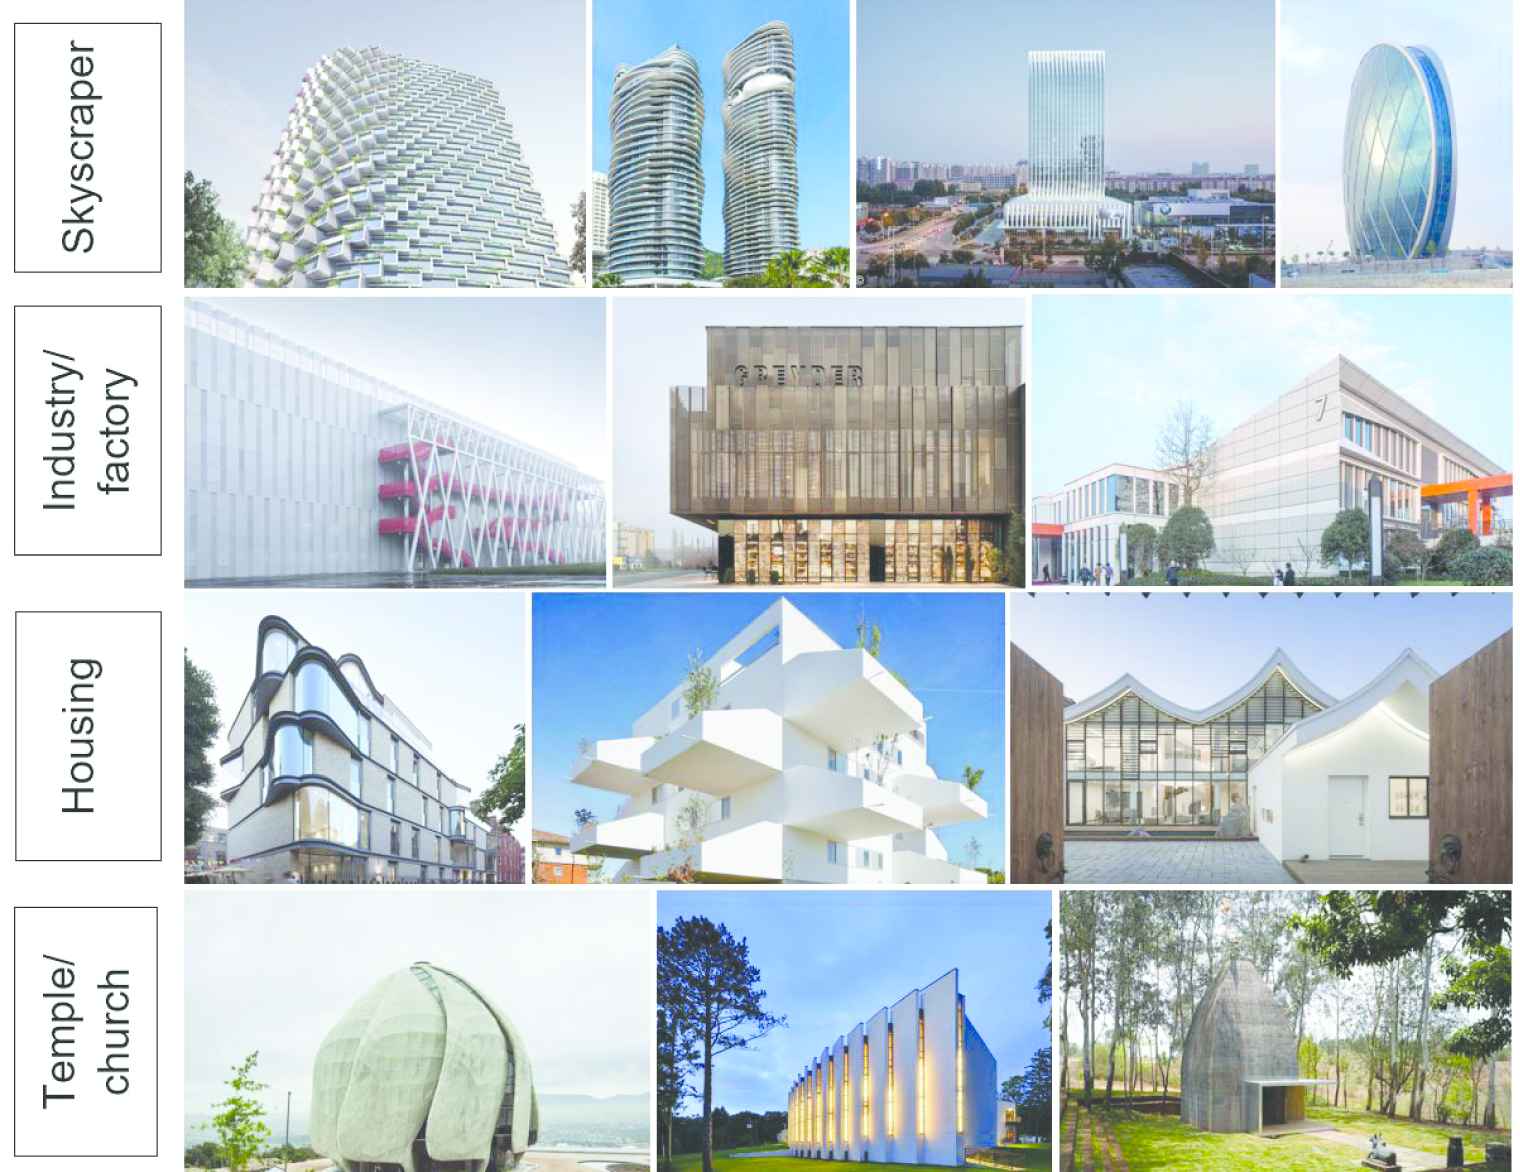
Example of the buildings and facades.
To date, most of the works focus to examine the architecture style classification of the building facade. For instance, Xu et al. [1] released an architectural style dataset comprised of ~5000 images from 25 classes. The styles include Baroque, Colonial, Gothic, Romanesque, Queen Anne, Greek Revival, Russian Revival, etc. The authors perform the architecture style classification by first utilizing deformable part-based models (DPMs) [2] to identify the local features of the image. Then, they propose multinomial latent logistic regression (MLLR) which is a probability-based solution to handle the multi-class problem. The classification accuracy reported is 46% for the 25-class images and 69% for 10 classes architecture style recognition. To distinguish the style of the buildings, it is relatively easy to differentiate, primarily characterized by its unique architectural elements. For instance, the Gothic style buildings contain rose windows. Besides, since this is one of the pioneer works that performs architecture style classification, feature extraction based on deep learning-related techniques are not presented.
Two years later, Peng and Chen [3] carried out the architectural style classification using the dataset established by [1]. However, the objective of this paper [3] is to investigate whether CNN-based approaches are effective in eight different abstract tasks. Among one of the tasks is the architectural style classification. As a result, the classification performances obtained are higher which is capable to attain 53% and 71% accuracies for 25 classes and 10 classes architectural styles, respectively. Specifically, one of the pretrained CNNs were directly employed, viz, AlexNet [4], and the parameters (i.e., weights and biases) in the CNN structure were fine-tuned. In addition, they also try to train the CNN parameters from scratch, which is to randomize the parameters and learn the new features in the desired dataset. However, it is significantly underperformed (i.e., 12% and 21% for 25 classes and 10 classes, respectively).
Shalunts [5] did an analysis to recognize three types of architectural styles, namely Romanesque, Gothic, and Baroque. Succinctly, the classification process consists of three main steps:
A SIFT [6] image descriptor is utilized to extract features.
Visual codebooks are built by learning from the features encoded.
A k-means unsupervised classifier is employed to group the features.
As a result, a classification rate of 80.54% is achieved for the 3-class architectural style recognition. This result is reasonable because higher accuracy can be exhibited with a lower number of output classes. Basically, the three styles could be differentiated based on the window features. For instance, the window design of Romanesque is either single, double, or triple round arch; Baroque is either triangular, segmental pediments, or balustrade; and Gothic is pointed arch or rose windows.
On the other hand, Jiang et al. [7] propose a method to focus on the weak-style images, which is the data that is easy to be misclassified. Those images are always suffered from the “spread out” phenomena as they are sometimes diffused and overlap with other classes. In brief, the analysis presented in this work is similar to that of [3], as multitasks (i.e., fashion, architecture, and manga) are investigated. Particularly for architectural style recognition, the best result obtained is 60% for the 10-class classification. Although the method did not outperform the state-of-the-art, it achieves promising performance for the classification tasks of fashion style [8] and manga style [9].
Peng et al. [10] suggest to first partition the input image to several patches to describe the local features using the pre-trained CNN (i.e., AlexNet). The classification result reported is the highest compared to previously mentioned papers, which is 75% for a 10-class style recognition. On another note, the same authors [11] introduce to utilize the features after fine-tuning the parameters with the input dataset using AlexNet architecture. The classifier used to distinguish the architectural features is a linear support vector machine (SVM) [12]. However, the classification accuracy reaches 71% for 10-class data. Nonetheless, deep learning architecture had been demonstrated its robustness in capturing the discriminant features. There are many more well-developed pretrained CNNs that can be evaluated to enhance the classification performance. The example of the CNNs are SqueezeNet [13], ShuffleNet [14], DenseNet-201 [15], Xception [16], MobileNet-v2 [17], and Inception [18].
To the best of our knowledge, there is no study investigating architect classification based on the facade. This kind of automatic classification system promotes educational and cultural understanding, especially the topics related to art, science, history, and technology. Besides, it can improve the learning experience and progressions in aesthetic insights. In addition, owing to the emergence of artificial intelligence and successfully increased reliance on algorithms for a variety of applications, this paper presents thorough experiments by employing several well-established CNN-based methods. In this article, four objectives are set and briefly described as follows:
Proposal of a new architecture database, namely “ARC-100,” that comprises 100 images from five architects. All the images are publicly searchable online. Note that, this is the first attempt to perform this type of classification task.
Implementation of a series of preprocessing techniques on the images to enhance the data quality prior to the feature extraction process.
Modification of several state-of-the-art pretrained neural networks particularly in input size to capture meaningful features in performing the classification task.
Comprehensive experimentation on the dataset to verify a smaller input data is capable to achieve promising results.
The remaining of the paper is organized as follows: Section 2 describes the details of the database collected and the procedure of the proposed algorithm. Section 3 reports and analyzes the experimental results. Lastly, the conclusion of this work is described in Section 4.
2. METHOD PROPOSED AND EXPERIMENT SETUP
The flowchart to conduct the architect classification is shown in Figure 2, which includes
Dataset collection—to download a sizeable amount of data that contains 20 frontal views of architecture buildings from five architects.
Image preprocessing—to suppress undesired noises by enriching the image information content.
Deep learning model training—to select CNN models and perform parameters (i.e., weights and biases) training and fine-tuning.
Image prediction—to categorize the architect class based on the features extracted in the previous step. The detailed process of the proposed scheme is elaborated in the following subsections.
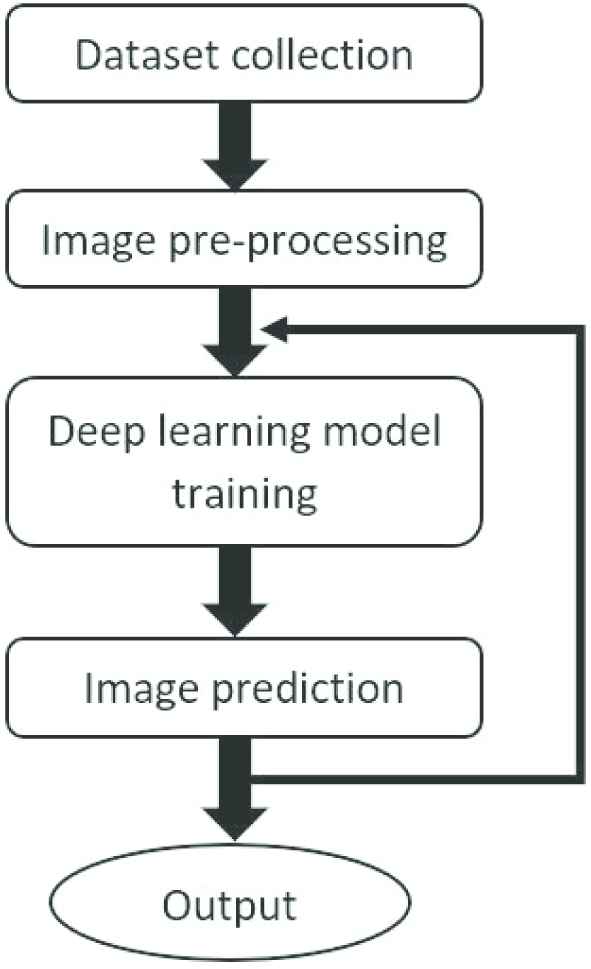
Flowchart of the proposed architecture classification framework.
2.1. Dataset Collection
Many famous architects gained international attention and their artworks can draw in millions of visitors each year. Typically, architects do not involve in many architectural projects. The reason being is that it may be incredibly challenging to create original work. Furthermore, after sketching out the design ideas, the refinement and detailing processes require commitment from the entire team. The team meetings and discussions are about every material and tool to implement the architectural model, which continuously demand the knowledge regarding the latest building technologies, building techniques, and even rules and regulations of construction.
This paper aims to develop a new database that contains sufficient samples for algorithm evaluation. In total, there are five architects selected each of them consists of 20 architecture images as the experimental dataset. The sample images of the dataset are illustrated in Figure 3. The architects are Frank Lloyd Wright, Ieoh Ming Pei, Frank Owen Gehry, Zaha Mohammad Hadid, and Bjarke Ingels.
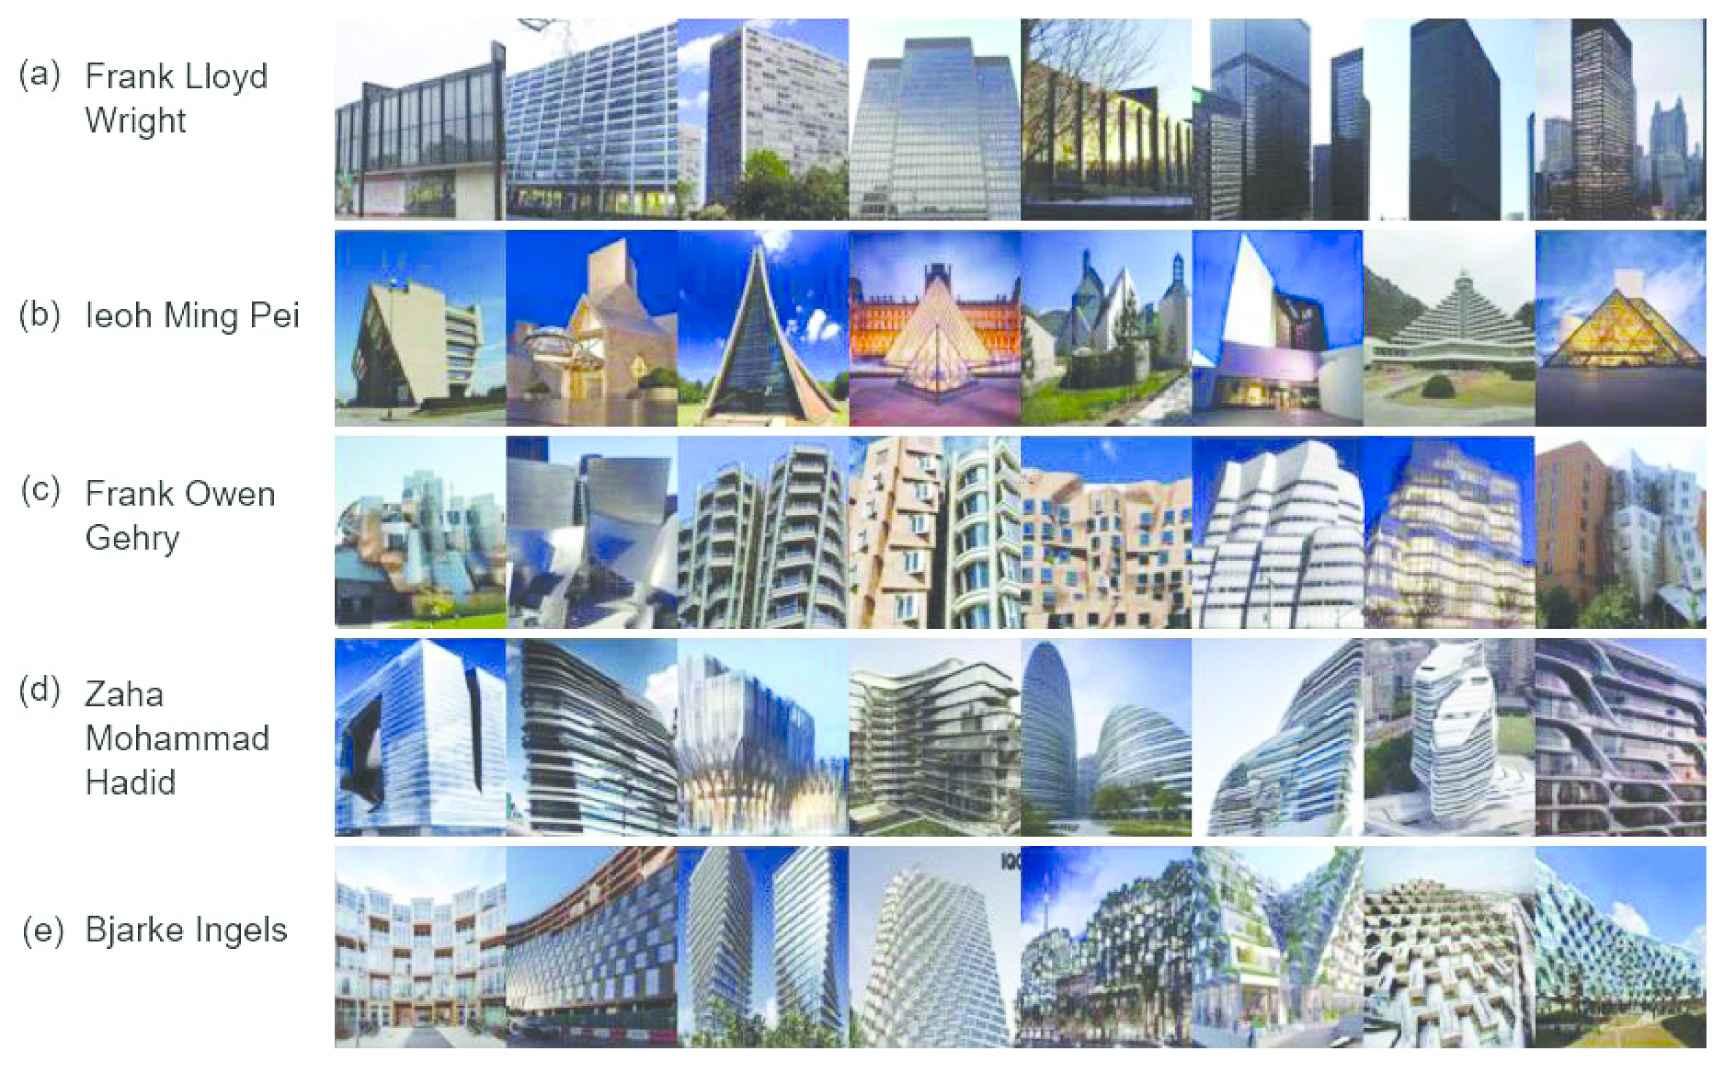
The samples images collected from five architects.
Frank Lloyd Wright (1890–1978)
He believes that the architectural structure needs to be coordinated with human nature and its environment. This kind of architectural philosophy is called the “organic architecture.” One of his most famous buildings is “Fallingwater” and it had been attracted worldwide attention. Notably, his projects are also hailed as “the best all-time work of American architecture.”
Ieoh Ming Pei (1917–2019)
He is a Chinese-American architect and is known as “the last master of high modernist architecture.” His ambitious project is undoubtedly the design of the association between the structure and the natural space concept. “Let the light do the design” becomes the famous saying of I. M. Pei. His design works are mainly public buildings, cultural, and educational buildings, and are classified as modernist buildings. He makes good use of steel, concrete, glass, and stone. His works include the National Gallery of Art East Building, Pyramide du Louvre, Bank of China Tower, and The Luce Chapel.
Frank Owen Gehry (1929 to current)
He is an architect of American postmodernism and deconstruction. He won the Pritzker Architecture Prize (the architecture's version of the Oscar) in 1989. His famous works include the Bilbao Guggenheim Museum in Bilbao, Spain, and the Massachusetts Institute of Technology, Maria Stata Center, Louis Vuitton Foundation. He is also known as the use of building materials adventurously, emphasizing the three-dimensional aesthetic.
Zaha Mohammad Hadid (1950–2016)
She is the first female architect to receive the Pritzker Architecture Prize in 2004 and the Stirling Prize, in 2010 and 2011. Her style is based on the use of curves and thus is described as the “Queen of the curve.” She utilizes bold and unconventional forms throughout her designs, creating unprecedented buildings and fashion.
Bjarke Ingels (1974 to current)
He is one of the most influential Danish architects in the 20th century. In 2005, he founded the BIG (Bjarke Ingels Group), a construction team named after him. He is known for its anti-traditional architectural concepts and incorporates natural elements into the architectural design. His design incorporates ideas for sustainable development and sociological concepts that are often integrated into the environment. For example, one of his skyscraper designs in Shenzhen consumes 30% less electricity by playing with a dress-like facade to maximize the daylight.
2.2. Image Preprocessing
Note that, there are no restrictions in the previous data acquisition stage, in terms of pose, lighting, and background. Therefore, the images should undergo a series of preprocessing techniques to achieve image enhancement and noise reduction. The preprocessing steps include manual cropping, resizing, and building segmentation. Basically, cropping is an operation to improve the visual quality. Most importantly, it identifies the image saliency such that the desired content can be optimally captured. However, this kind of cropping task involves considerable costs, human interventions, and efforts, which are inevitable. After cropping the images, a resize operation is applied in order to standardize the image sizes as well as to reduce the computation time. Specifically, the image is fixed to 400 × 400 × 3 resolution. The output for the cropping and resizing operations performed on an image are illustrated in Figure 4(a) and 4(b), respectively.
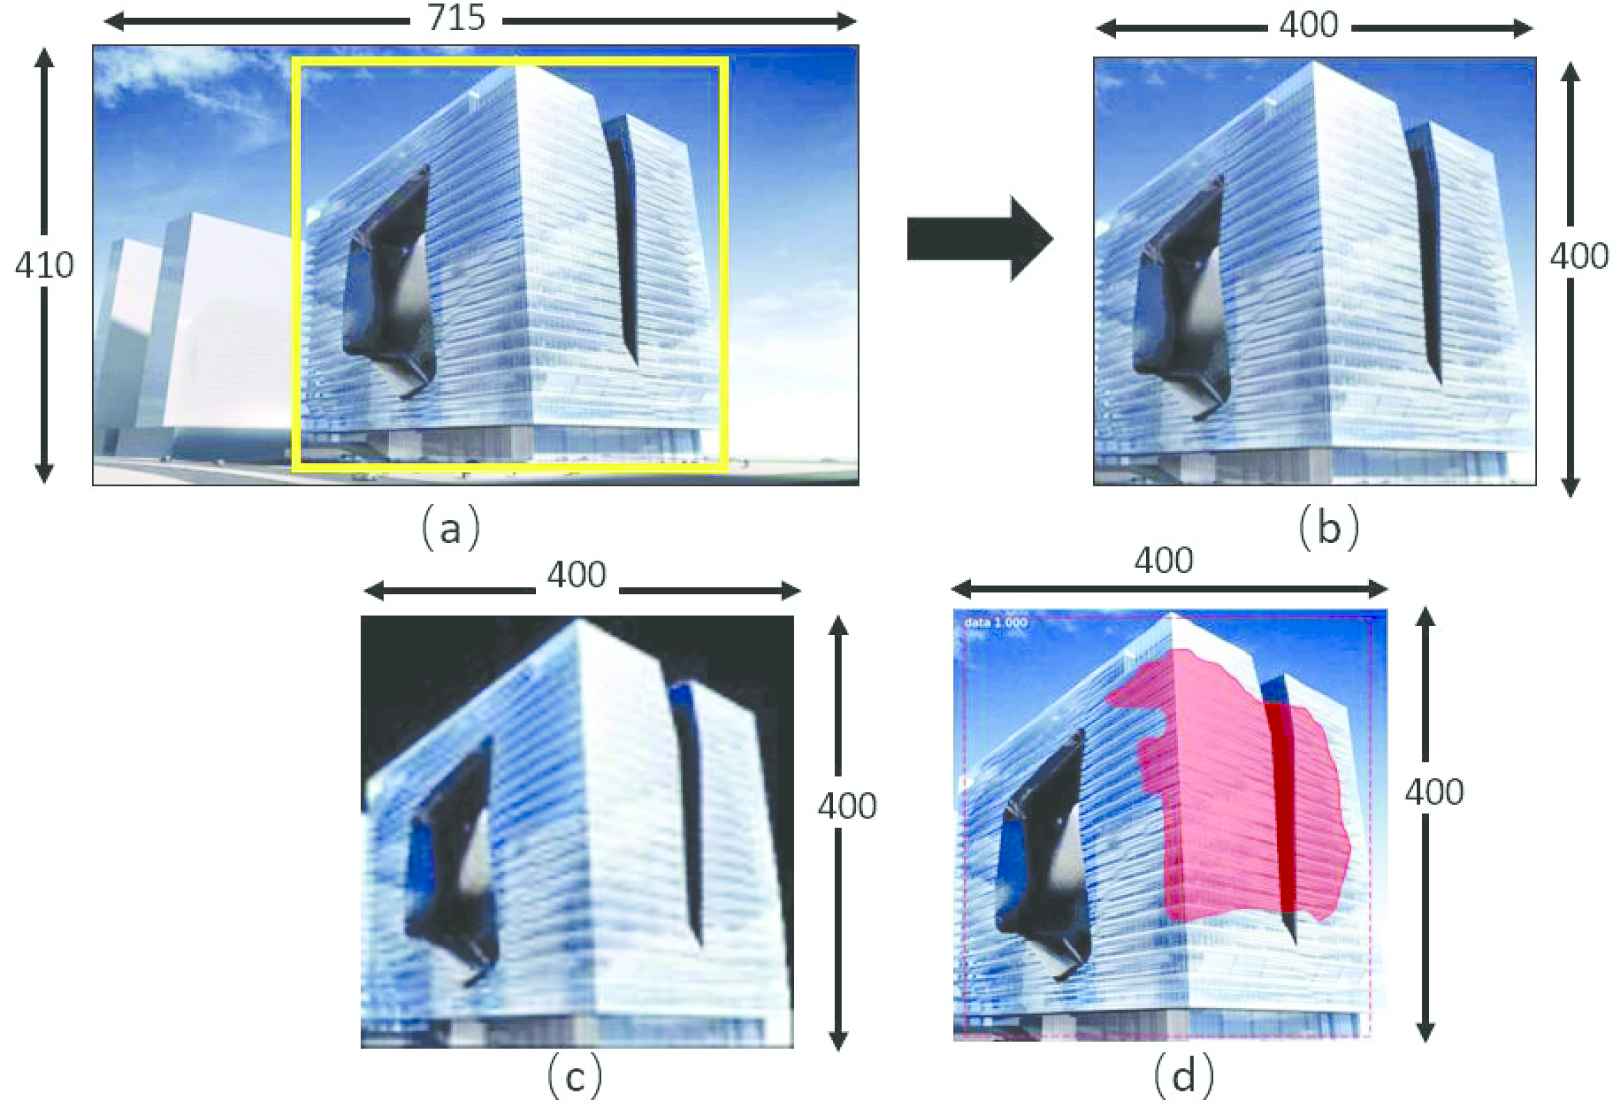
Preprocessing of an image: (a) original data; (b) cropped and resized; (c) manually building segmentation; and (d) automatic building segmentation using mask regional convolutional neural network (R-CNN) approach.
Then, a background removal step is applied to extract the shape of the buildings. Concretely, two approaches are performed: manually and automatically building segmentation. As the name implies, the manual work refers to the segment and labels an image by hand. However, this process may be unreliable due to human error and inconsistency from personal judgment. In contrast, the automatic task is coped with the ability to self-recognize the area of interest and segments the image into regions, that correspond to the spatial extent of objects on the image. The examples of the manual and automatic building segmented images are illustrated in Figure 4(c) and 4(d), respectively.
Concisely, for the automatic segmentation task, a Mask regional convolutional neural network (R-CNN) [19] instance segmentation technique is employed. It is one of the latest methods that can generate a bounding box around the object and a mask in the pixel level of the object. Succinctly, Mask R-CNN is built based on a feature pyramid network (FPN) [20] and a ResNet-101 [21] backbone architecture. In addition, Mask R-CNN had been achieving superior performance for the instance segmentation of biomedical images [22] (to predict the bounding boxes of the individual nuclei from a clustered nuclei), food and products [23] (to detect the ham object location and its boundary's coordinate), traffic understanding [24] (to detect and localize anomalies in traffic scenes), and others.
2.3. Deep Learning Model Training and Testing
AlexNet [4] has been used as a benchmark feature descriptor in many classification tasks. It was initially created by Alex Krizhevsky in 2012 to compete in the “ImageNet Large-Scale Visual Recognition Challenge (ILSVRC)” which consists of roughly one million images from 1000 categories. The network comprises multiple convolutions, max pooling, dropout, rectified linear unit (ReLU) activations, and fully connected layers. In general, the convolution operation generates a new set of matrices by multiplying the image data by a filter matrix. The pooling is a downsampling operation to reduce the input size and form a compact representation. ReLU sets all the negative pixel values in the input image to zeros, while all positive elements remain unchanged. The structure of the modified AlexNet is illustrated in Figure 5 and the detailed parameters for each layer are reported in Table 1. Particularly, the layers that did the modification are the input layer and the last fully connected layer (i.e., Fully Connected 8), where the input layer is modified from the original size of 227 × 227 × 3 to 400 × 400 × 3 to cope with the resized images, whereas the output layer is modified from the original size of 1000 × 1 to 5 × 1, as there are five classes of classification types.
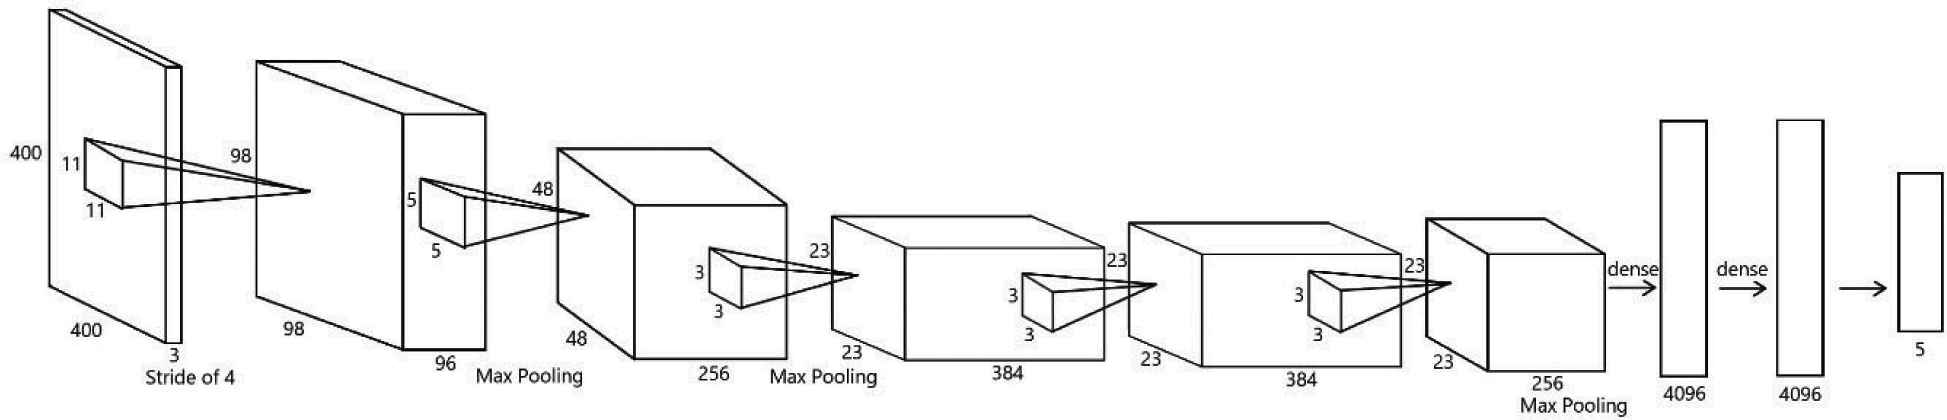
The structure of the modified AlexNet architecture.
| Layer | Operation | Filter/Pool Size | # Filter | Stride | Padding | Channel/Element | Percentage | Output Size |
|---|---|---|---|---|---|---|---|---|
| Input | – | – | – | – | – | – | – | 400 × 400 × 3 |
| 1 | Convolution 1 | 11 × 11 × 3 | 96 | [4, 4] | [0, 0, 0, 0] | – | – | 98 × 98 × 96 |
| ReLU 1 | – | – | – | – | – | – | 98 × 98 × 96 | |
| Normalization 1 | – | – | – | – | 5 | – | 98 × 98 × 96 | |
| Pooling 1 | 3 × 3 | – | [2, 2] | [0, 0, 0, 0] | – | – | 48 × 48 × 96 | |
| 2 | Convolution 2 | 5 × 5 × 48 | 256 | [1, 1] | [2, 2, 2, 2] | – | – | 48 × 48 × 256 |
| ReLU 2 | – | – | – | – | – | – | 48 × 48 × 256 | |
| Normalization 2 | – | – | – | – | 5 | – | 48 × 48 × 256 | |
| Pooling 2 | 3 × 3 | – | [2, 2] | [0, 0, 0, 0] | – | – | 23 × 23 × 256 | |
| 3 | Convolution 3 | 3 × 3 × 256 | 384 | [1, 1] | [1, 1, 1, 1] | – | – | 23 × 23 × 384 |
| ReLU 3 | – | – | – | – | – | – | 23 × 23 × 384 | |
| 4 | Convolution 4 | 3 × 3 × 192 | 384 | [1, 1] | [1, 1, 1, 1] | – | – | 23 × 23 × 384 |
| ReLU 4 | – | – | – | – | – | – | 23 × 23 × 384 | |
| 5 | Convolution 5 | 3 × 3 × 192 | 256 | [1, 1] | [1, 1, 1, 1] | – | – | 23 × 23 × 256 |
| ReLU 5 | – | – | – | – | – | – | 23 × 23 × 256 | |
| Pooling 5 | 3 × 3 | – | [2, 2] | [2, 2, 2, 2] | – | – | 11 × 11 × 256 | |
| 6 | Fully Connected 6 | 4096 × 6400 | – | – | – | – | – | 4096 × 1 |
| ReLU 6 | – | – | – | – | – | – | 4096 × 1 | |
| Dropout 6 | – | – | – | – | – | 50 | 4096 × 1 | |
| 7 | Fully Connected 7 | 4096 × 4096 | – | – | – | – | – | 4096 × 1 |
| ReLU 7 | – | – | – | – | – | – | 4096 × 1 | |
| Dropout 7 | – | – | – | – | – | 50 | 4096 × 1 | |
| 8 | Fully Connected 8 | 2 × 4096 | – | – | – | – | – | 5 × 1 |
| Output | – | – | – | – | – | – | – | 5 × 1 |
The modified AlexNet structure for architecture classification.
After the great success of AlexNet, many new variants of CNNs had been proposed to achieve a similar classification task. For instance, the winners of ILSVRC for the year 2014, 2015, 2016 are VGG-16 [25], ResNet-152 [21], and GoogleNet-v4, respectively. On another note, plenty of the pretrained neural networks are publicly accessible that can improve scientific reproducibility. The networks include SqueezeNet [13], ShuffleNet [14], DenseNet-201 [15], Xception [16], MobileNet-v2 [17], and Inception [18]. Thus, the abovementioned networks are directly employed in architecture recognition experiments herein.
In total, there are 100 images in the dataset. During the experiment, a 10-fold cross-validation strategy is exploited to randomly partition the dataset into 10 equal-sized parts. For each fold, the dataset allocates 90% as the training data and the remaining 10% are the test data. For each fold, the model is fit using the training data and the particular model is evaluated using that defined portion of test data. This procedure is repeated ten times with each of the data used exactly once as the test data. Finally, the classification results for all the predicted data are averaged to form the resultant classification rate. To fine-tune the parameters (i.e., weights and biases) in the neural network, a range of [350, 500] with an interval of 25 epochs is examined. The training progress at every iteration is portrayed in Figure 6. It is noticed that the loss rate is relatively high when the epoch = 350. However, the loss rate has approached to 0 when epoch = 550, which denotes that the parameters in the neural network have been optimally trained.
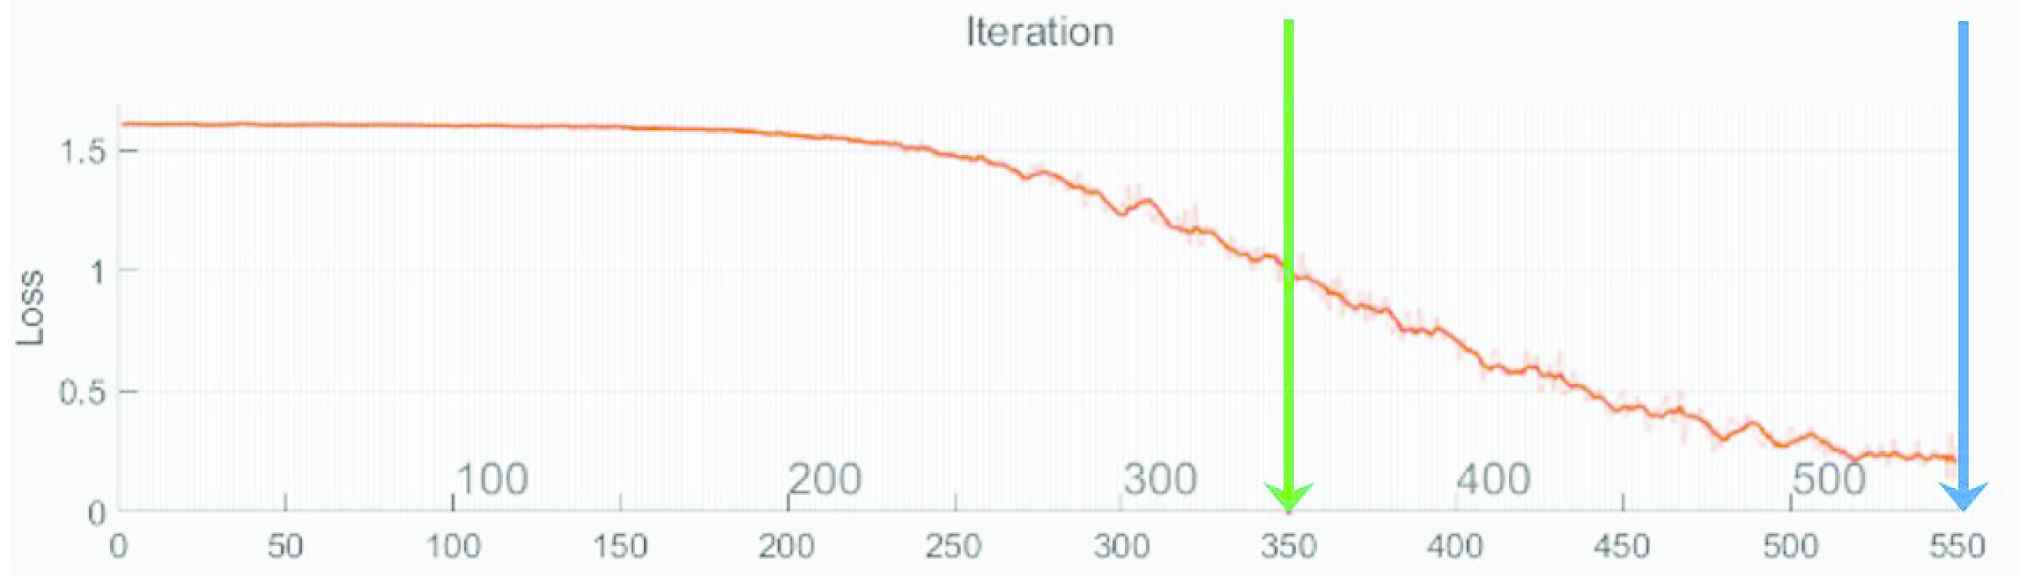
The loss rate indicates the training progress. The epoch range is set from 350 (green line) to 550 (blue line).
3. RESULTS AND DISCUSSION
Tables 2 and 3 show the F1-score and accuracy results obtained by the modified SqueezNet approach, respectively. There are three types of input sizes evaluated in this experiment, viz., 400 × 400, 200 × 200, and 100 × 100. For each input size, the same experiment is repeated for three times with the initial weights and biases are set randomly. For Table 3, the best results of image sizes in the 400 × 400, 200 × 200, and 100 × 100 are 61%, 66%, and 67%, respectively. Thus, it can be concluded that the smaller the input image size, the better the accuracy can be attained. In addition, the computation time taken to train the model is lower.
| Input size |
||||||||||
|---|---|---|---|---|---|---|---|---|---|---|
| 400×400 |
200×200 |
100×100 |
||||||||
| 1 | 2 | 3 | 1 | 2 | 3 | 1 | 2 | 3 | ||
| Epoch | 350 | 53 | 52 | 49 | 58 | 56 | 57 | 64 | 60 | 60 |
| 375 | 49 | 36 | 45 | 66 | 56 | 49 | 61 | 57 | 66 | |
| 400 | 47 | 56 | 43 | 58 | 57 | 53 | 63 | 63 | 58 | |
| 425 | 49 | 49 | 52 | 57 | 61 | 63 | 68 | 65 | 61 | |
| 450 | 54 | 57 | 47 | 62 | 61 | 58 | 57 | 60 | 61 | |
| 475 | 49 | 49 | 52 | 61 | 58 | 63 | 63 | 61 | 64 | |
| 500 | 44 | 45 | 47 | 64 | 55 | 58 | 61 | 62 | 57 | |
| 525 | 54 | 45 | 51 | 62 | 56 | 50 | 58 | 57 | 57 | |
| 550 | 54 | 46 | 62 | 55 | 46 | 45 | 57 | 65 | 65 | |
*Bold indicate the highest performance value
5-class recognition performance in terms of F1-score (%) when employing SqueezeNet and without any building segmentation.
| Input size |
||||||||||
|---|---|---|---|---|---|---|---|---|---|---|
| 400×400 |
200×200 |
100×100 |
||||||||
| 1 | 2 | 3 | 1 | 2 | 3 | 1 | 2 | 3 | ||
| Epoch | 350 | 53 | 51 | 49 | 58 | 56 | 57 | 64 | 60 | 60 |
| 375 | 49 | 37 | 45 | 66 | 56 | 49 | 61 | 56 | 65 | |
| 400 | 47 | 57 | 44 | 58 | 57 | 53 | 63 | 62 | 58 | |
| 425 | 49 | 49 | 51 | 57 | 61 | 63 | 67 | 65 | 61 | |
| 450 | 54 | 57 | 47 | 61 | 60 | 58 | 57 | 60 | 62 | |
| 475 | 49 | 49 | 51 | 61 | 58 | 63 | 64 | 61 | 63 | |
| 500 | 44 | 45 | 46 | 63 | 55 | 58 | 61 | 62 | 57 | |
| 525 | 54 | 45 | 51 | 62 | 56 | 50 | 58 | 57 | 57 | |
| 550 | 54 | 46 | 61 | 55 | 46 | 44 | 57 | 65 | 64 | |
*Bold indicate the highest performance value
5-class recognition performance in terms of accuracy (%) when employing SqueezeNet and without any building segmentation.
Consequently, the effect of utilizing other types of pretrained neural networks for the feature extraction process is investigated together with a manual building segmentation process as the preprocessing method. All the input images are first fixed to 100 × 100 before performing the feature extraction. The dataset is evaluated on fourteen different pretrained networks and the classification result is tabulated in Table 4. Among the networks, SqueezeNet produces the highest result, viz., 71%. AlexNet ranked the second (i.e., 68%) and the third is ResNet-18 (i.e., 67%). Thus, the top three networks are selected to further examine the impact when segmenting the building using the automatic approach (i.e., Mask R-CNN).
| Pretrained Networks | Acc (%) | Epoch | Depth | Parameter (Mil) |
|---|---|---|---|---|
| AlexNet [4] | 68 | 525 | 8 | 23.3 |
| GoogLeNet [26] | 65 | 300 | 22 | 5.7 |
| SqueezeNet [13] | 71 | 500 | 18 | 0.7 |
| ShuffleNet [14] | 36 | 400 | 50 | 0.9 |
| DenseNet-201 [15] | 59 | 525 | 201 | 9.3 |
| Inception-v3 [18] | 31 | 450 | 48 | 12.1 |
| MobileNet-v2 [17] | 42 | 375 | 53 | 0.9 |
| ResNet-18 [21] | 67 | 475 | 18 | 6.3 |
| ResNet-50 [21] | 58 | 500 | 50 | 12.5 |
| ResNet-101 [21] | 62 | 475 | 101 | 24.2 |
| VGG-16 [25] | 27 | 525 | 16 | 75.6 |
| VGG-19 [25] | 27 | 400 | 19 | 83.3 |
| Xception [16] | 36 | 550 | 71 | 10.5 |
| Inception-ResNet-v2 [27] | 35 | 500 | 164 | 26.4 |
*Bold indicate the highest performance value
Classification performance for when employing a variety of pretrained neural networks for manual instance segmentation images.
The comparison of having the input images without the building segmentation, manual segmentation, and Mask R-CNN segmentation is reported in Table 5. It can be observed that the highest classification rate (i.e., 71%) is generated when employing SqueezeNet with manual building segmentation as a preprocessing method. In overall, the manual segmentation achieves the best performance in all the three networks, compared to without segmentation and with Mask R-CNN segmentation cases. Although the manual segmentation can lead to the best result, it should be reminded that this preprocessing method requires massive labor efforts. For the scenario with Mask R-CNN segmentation in AlexNet, it can obtain the same accuracy (i.e., 68%) as the manual segmentation. One of the possible solutions to improve the Mask R-CNN instance segmentation performance is to train more images so that the network is capable to learn the discriminative features and thus produces a higher recognition rate.
| Building Segmentation |
|||
|---|---|---|---|
| Pretrained Networks | No | Manual (By Hand) | Automatic (Mask R-CNN) |
| AlexNet | 66 | 68 | 68 |
| SqueezeNet | 67 | 71 | 65 |
| ResNet-18 | 65 | 67 | 59 |
*Bold indicate the highest performance value
Classification accuracies (%) comparison when the top three networks are utilized.
To illustrate the classification performance for each class, the confusion matrix for the scenario with the highest classification rate (i.e., 71% when epoch = 500, input size = 100 × 100 and with manual building segmentation) is shown in Table 6. It is observed that the class of I. M. Pei in the confusion matrix is always performed poorer than other classes. To further analyze and understand the reason for such phenomena, the activation output is visualized and compared, particularly for the classes I. M. Pei (always poor results) and Frank Wright (always better results). Figure 7 shows the example of the activation after passing through the first convolutional layer in SqueezeNet. It can be seen that in the image for the Frank Wright class (Figure 7 (a)), it generates regular and meaningful vertical and diagonal lines. On the other hand, for I. M. Pei class (Figure 7 (b)), it produces some irregular patterns. Therefore, it is convincing to state that the Frank Wright class is capable to capture the structure of the architecture and thus has a higher potential to lead to a better recognition rate.
| Predicted |
||||||
|---|---|---|---|---|---|---|
| Wright | Pei | Gehry | Hadid | Ingles | ||
| Actual | Wright | 18 | 1 | 0 | 0 | 1 |
| Pei | 0 | 11 | 2 | 3 | 4 | |
| Gehry | 1 | 0 | 17 | 2 | 0 | |
| Hadid | 0 | 4 | 2 | 12 | 2 | |
| Ingles | 1 | 2 | 0 | 4 | 13 | |
*Bold indicate the highest performance value
Confusion matrix for the recognition task when epoch = 500, input size = 100 × 100, and with manual building segmentation. The classes types are Wright: Frank Lloyd Wright; Pei:, I.M. Pei; Gehry: Frank Owen Gehry; Hadid: Zaha Mohammad Hadid, and; Ingles: Bjarke Ingles.
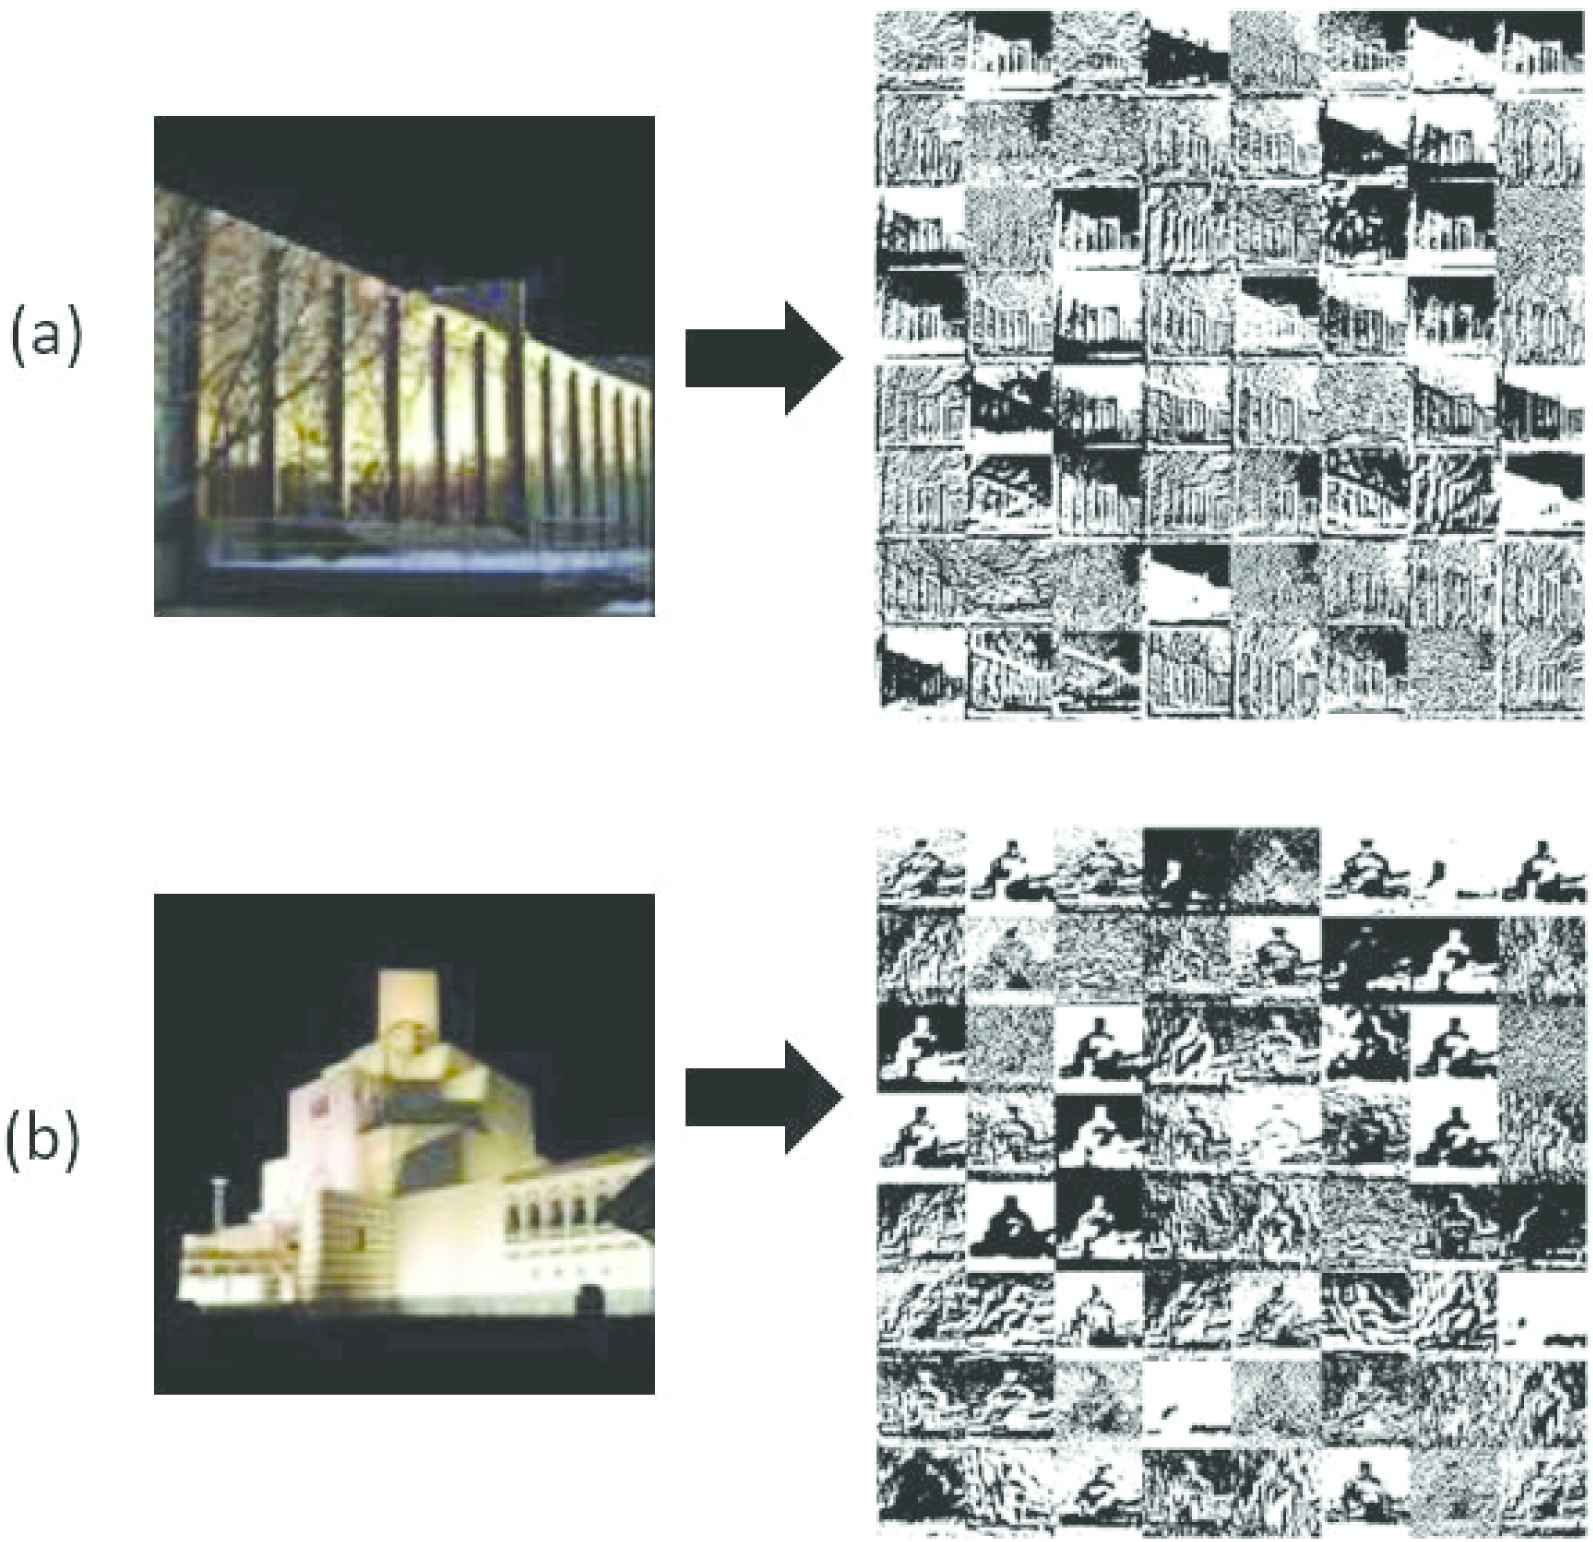
Example of the activation maps after passing through the first convolution layer for (a) Frank Wright and (b) I. M. Pei.
Previous experiments demonstrated that the method proposed is capable to achieve accuracy of 71% as the experiments are designed such that the data is balanced, whereby the number of the training sample for all classes is equivalent, viz, 20 images for each class. An investigation is carried out to observe the classification performance when the data is imbalanced. First, a random sampling method is performed to exhibit a different distribution of training/testing data. To have a fair comparison, three experimental runs are conducted to illustrate the relationship between the variety of the input data selection to the classification result. Concisely, the first experimental run is shown in Table 7 # 1 column, the number of training data selected for the classes of Frank Lloyd Wright, I.M. Pei, Frank Owen Gehry, Zaha Mohammad Hadid, and Bjarke Ingles is 4, 19, 5, 6, and 2, respectively. The remaining data will be served as the testing data. The corresponding classification results are shown in Table 8 # 1 column. As indicated, the highest accuracy achieved is 33% and the lowest is 23%, implying that the performance has some gap to the balanced case (i.e., 71%). Similarly, for the experimental runs # 2 and # 3 repeat the same processes. It is observed that for experimental run # 3, the average results exhibited are better than that of the other two runs. This is because its training/testing split is relatively balanced and less biased for each class. Concretely, there are only 2 training samples for the Bjarke Ingles class for experimental run # 1 and 1 training sample for the I.M. Pei class for experimental run # 2. Thus, as future studies, the classifier stage can be redesigned and improved to handle this data imbalance issue.
| Training/Testing Splitting |
|||
|---|---|---|---|
| Class | 1 | 2 | 3 |
| Wright | 4/16 | 11/9 | 12/8 |
| Pei | 19/1 | 1/19 | 6/14 |
| Gehry | 5/15 | 17/3 | 6/14 |
| Hadid | 6/14 | 9/11 | 15/5 |
| Ingles | 2/18 | 14/6 | 10/10 |
The training/testing data splitting for each class, where Wright: Frank Lloyd Wright; Pei:, I.M. Pei; Gehry: Frank Owen Gehry; Hadid: Zaha Mohammad Hadid; and Ingles: Bjarke Ingles.
| SqueezeNet |
|||
|---|---|---|---|
| Epoch | 1 | 2 | 3 |
| 325 | 31 | 33 | 51 |
| 350 | 31 | 31 | 49 |
| 375 | 33 | 31 | 45 |
| 400 | 23 | 31 | 45 |
| 425 | 33 | 35 | 39 |
| 450 | 33 | 29 | 47 |
| 475 | 30 | 31 | 47 |
| 500 | 27 | 36 | 37 |
| 525 | 23 | 33 | 39 |
| 550 | 28 | 33 | 43 |
*Bold indicate the highest performance value
Classification accuracies (%) when training data are imbalanced. The training/testing data splitting is shown in Table 7.
4. CONCLUSION
In conclusion, this paper presents a new dataset, namely ARC-100, which is comprised of 100 images from five popular architects. A series of preprocessing techniques are carried out before extracting the features using multiple pretrained neural networks. The preprocessing methods include cropping, resizing, and segmentation. The effect of two types of building segmentation approaches is particularly focused on herein, viz, manually and automatically. Succinctly, the best performance when applying Mask R-CNN as the automatic segmentation method is 68% for 5-class classification. Furthermore, it has been demonstrated that segmentation as a preprocessing technique always performs better. On the other hand, when using the manual building segmentation by hand, the classification accuracy attained is 71%.
In addition, the experiments show that scaling the input images to a smaller input size (i.e., 100 × 100) produces higher results compared to that of 200 × 200 and 400 × 400 ones. As future works, the automatic building segmentation methods can be improved by feeding more input images to the Mask R-CNN model so that the model has a higher capability to recognize the shape of buildings. In addition, in order to enhance the image quality, other types of preprocessing methods can be examined, such as the Gaussian blur, mirroring, and contrasting. Apart from the softmax classifier utilizing in all the pretrained neural networks, different classification methods can be exploited, such as SVM, KNN, decision tree, random forest. Many factors are affecting the effectiveness of the algorithm and it is also worth trying the impact for a different combination of features. This is because there is no one algorithm works best for every problem. Also, architects often use architectural graphic standards or online resources as a reference handbook for the design of floor plans in relation to various functions of architecture. The further works of this research not only establishes a database on architect classification but also based on this data develop a method to automatically catalog architectural programs through the analysis of different configurations of floor plans.
CONFLICT OF INTEREST
The authors declare that they have no competing interests.
AUTHORS' CONTRIBUTIONS
All authors contributed to the work. All authors read and approved the final manuscript.
ACKNOWLEDGMENTS
This work was funded by Ministry of Science and Technology (MOST), Taiwan (Grant Number: MOST 109-2221-E-035-065-MY2, MOST 108-2218-E-009 -054 -MY2, MOST 108-2218-E-035 -007-, MOST 108-2218-E-227-002-). The authors would also like to thank Yu-Ting Sheng for her assistance in the sample preparation and image acquisition processes.
REFERENCES
Cite this article
TY  - JOUR
AU  - Yen-Chang Huang
AU  - Shih-Yuan Wang
AU  - Sze-Teng Liong
AU  - Chieh-En Huang
AU  - Yi-Chen Hsieh
AU  - Hsiang-Yu Wang
AU  - Wen-Hung Lin
AU  - Y. S. Gan
PY  - 2020
DA  - 2020/09/02
TI  - Who Is the Designer? ARC-100 Database and Benchmark on Architecture Classification
JO  - International Journal of Computational Intelligence Systems
SP  - 1305
EP  - 1314
VL  - 13
IS  - 1
SN  - 1875-6883
UR  - https://doi.org/10.2991/ijcis.d.200824.001
DO  - 10.2991/ijcis.d.200824.001
ID  - Huang2020
ER  -