
Markov Decision Model of Emergency Medical Supply Scheduling in Public Health Emergencies of Infectious Diseases
 , Keyu Zhu*
- DOI
- 10.2991/ijcis.d.210222.002How to use a DOI?
- Keywords
- Infectious disease public health emergencies; Emergency medical supplies; Material dispatch; Markov decision model
- Abstract
In this paper, a Markov decision process (MDP) model was established to study emergency medical material scheduling strategies for public health emergencies such as COVID-19. Within the constraints of dispatchable supplies, the priority of each medical node complicates the problem of deciding which hospital node supplies to respond to. The model assumes that the probability of events in the initial time period is in line with the Poisson distribution and that the location and priority of each hospital node is known when the material demand is initiated. The priority of hospital nodes is divided into four categories: critical, urgent, priority, and routine. There are several patients with different priorities in a hospital node: critical illness, severe illness, and mild illness. The priority of the hospital node is determined by the overall situation of the hospital patients. The MDP model established in this paper gives how to dispatch limited emergency medical supplies in the dispatching center to make the service rate of the whole system the best. The efficiency of the dispatching center in responding to the material needs of the hospital node depends on the constraints of the number and response time of different priority patients at the node. The maximum effect iterative dynamic model was simulated by simulation experiment and compared with the simulation effect under general conditions, so as to observe whether the model improved the system service rate.
- Copyright
- © 2021 The Authors. Published by Atlantis Press B.V.
- Open Access
- This is an open access article distributed under the CC BY-NC 4.0 license (http://creativecommons.org/licenses/by-nc/4.0/).
1. INTRODUCTION
Public health emergencies refer to the sudden occurrence of major infectious diseases, food and occupational poisoning outbreaks, and other events that seriously affect public health. The term “emergency medical supplies” refers to all kinds of medical supplies that the government and society need to take emergency measures to protect lives and carry out rescues in emergencies. Due to the uncertainty of public health emergencies and the technical requirements of emergency medical supplies, the sudden shortage of a large number of specific types of emergency medical supplies often brings great difficulties to epidemic prevention and treatment [1].
Therefore, dispatching and allocating limited emergency medical supplies under sudden public health events is a special emergency material dispatch problem. The dispatch scheme of emergency medical supplies has a significant impact on controlling the development situation of medical events. According to the Chinese government's emergency plan for public health emergencies, the government's rules follow the principle of on-demand dispatch and distribution in the allocation of emergency supplies. This principle is fair but considering that the sudden public health events of infectious diseases such as COVID-19 virus are characterized by rapid spread, a wide range of infections, and great difficulty in prevention and control [2]. This scheduling principle is not effective in controlling the spread of the disease. In addition, the consumption of emergency medical supplies in the early stage of public health emergencies of infectious diseases is substantial. In the distribution of emergency supplies after disasters, there is an imbalance between supply and demand [3] because most emergency supplies are nondurable goods. It is difficult to maintain many stocks for them before the occurrence of low-probability disasters [4]. A timely supply of medical supplies is the key to rescuing patients and controlling the epidemic. In this case, it is imperative to allocate the limited resources reasonably to achieve better results. There are many studies on the allocation of emergency supplies, focusing on different aspects. Overall, the model goals [5–8] generally consider the maximization of the demand satisfaction rate, the minimization of emergency time, and the minimization of cost. The primary purpose is to reduce the cost of rescue as much as possible. However, for public health emergencies, such as infectious diseases, the most important thing is to control the epidemic quickly and ensure people's lives to the greatest extent. Cost is not the core of our concern at this time. Making the best use of limited materials and controlling the epidemic's spread effectively is the most critical problem. Therefore, this paper regards service rate maximization as the realization goal of our model, and the principle of material scheduling is based on the maximization of system efficiency. In the existing research on emergency management, most scholars consider completing one-time scheduling of emergency materials after emergencies [9,10]. This scheduling scheme is reasonable in general material scheduling but unreasonable for emergency medical materials under public health emergencies. Since the demand and material type constantly changes according to the variation in the epidemic situation, this paper applies a Markov decision model to study the continuous scheduling of emergency medical materials under public health emergencies.
Markov decision processes (MDP) are the optimal decision process of stochastic dynamic systems based on Markov process theory. The Markov property refers to the property that the probability law of the future development of a stochastic process has nothing to do with the history before observation. Bandara et al. [11] studied the optimal scheduling strategy in an emergency medical service (EMS) system and developed an MDP model to dispatch ambulances to patients optimally. They use the single-valued method to transform the initially developed continuous-time MDP into the equivalent discrete-time MDP and correctly consider the optimal decision-making strategy of each discrete-time element. The optimal scheduling strategy in EMS systems is studied while paying attention to the urgency of emergency calls. Based on their research, this paper divides the continuous-time Markov decision model into an equivalent continuous discrete-time Markov decision model. According to the existing research experience, adopting a dynamic allocation model has apparent advantages in solving short-term shortages of consumption emergency materials. Keneall et al. [12] developed a MDP model to study the air military medical evacuation dispatch policy in a combat environment. They classified casualties into three priority levels: emergency, priority, and routine. Multiple casualties can occur in one casualty event, and the casualty event with the highest priority determines the priority of the casualty event. Thus, we divided the priority of patients in designated hospitals into three categories: critical illness, severe illness, and mild illness. At the same time, considering the priority of the designated hospital, the number of three types of patients, the required materials, and the position away from the dispatching center determine the hospital's priority. Simultaneously, they take the sum of the probability of Poisson distribution and the service rate of the region as the transition rate of the Markov decision model of the region. Based on them, we make improvements. Since the service rate in this paper is the service rate of the total system, the goal of the model is to maximize the system service rate. When the system service rate is poor, the epidemic situation will be more severe, and the number of hospitals that demand supplies will increase, so that the probability of the event will increase.
Based on the above research, this paper puts forward a Markov scheduling model, providing Markov decision-making scheduling for emergency medical materials under sudden public health events of infectious diseases and divides continuous MDP into equivalent discrete MDP. The model classifies patients and hospitals. By maximizing the system efficiency, the service rate of the system is enhanced. According to previous scholars, the transition probability is improved to be more in line with our research background.
2. LITERATURE REVIEW
In this section, we discuss the three most relevant literatures studied in this paper. They are (1) Emergent public health events, (2) Emergency material dispatch, and (3) Markov decision-making processes.
2.1. Emergent Public Health Event
The studies on public health emergencies are as follows: Zhu L et al. [13] approximately simulated the process of disaster diffusion by using infectious disease model. Aiming at major public health emergencies, Li Nan and others put forward the theory of “public opinion communication” with the government, media, and the public as the main body, and constructed the control mechanism of “public opinion communication” based on susceptible exposed infectious recovered (SEIR) infectious disease model. Liu et al. [15] discussed the location and personnel allocation of integrated temporary facilities for postdisaster humanitarian medical services, and provided an iterative method to obtain Pareto optimization. Yu Jiying et al. [16] gave the layout model of emergency service facilities in infectious public health emergencies. Liu et al. [17] study how to effectively isolate patients when public health events similar to infectious diseases occur, in order to further control the epidemic situation. Garza et al. [18] apply lean thinking and constraint theory in peacetime scenarios to improve the operational efficiency of EMSs. Syahrir and Vanany [19] built a model to predict the number of drugs that hospitals have to provide when public health outbreaks occur in Indonesia in order to ensure the supply of drugs. He and Liu [20] based on the spread characteristics of the epidemic, pay attention to the distribution of single-variety medical materials, predict the medical needs of each region, and apply linear programming method to promote allocation decision-making. Hu Xiaowei [21] in view of the unreasonable dispatching of emergency medical materials and the low transfer efficiency of distribution centers in COVID-19 epidemic prevention and control, Hu Xiaowei redesigned the dispatching and distribution system of urban emergency medical materials under major public health emergencies, and gave the classification method of emergency medical materials.
2.2. Emergency Material Scheduling
Tian Jun [22] describes the demand for emergency materials with the help of triangular fuzzy numbers in fuzzy mathematics, simulates the real dynamic road network traffic condition by using continuous speed time dependence function, and establishes a multi-objective mathematical model for dynamic scheduling of emergency materials distribution. By designing the particle swarm optimization algorithm, using the “discrete-continuous vector hybrid coding\” scheme and the weighted integrated fitness function guidance mechanism, combined with the continuously updated position and speed operation strategy, a fast and efficient algorithm for solving this kind of optimization model with the combination of discrete and continuous variables is established, which provides an effective and reliable method for the dynamic scheduling of material distribution under emergency conditions. Considering the problem of demand allocation and network allocation of emergency materials under fuzzy demand, Wang Hai-jun [23] establishes a network flow model aiming at minimizing the total distribution time. By using the gravity model algorithm and convex combination algorithm based on bilateral constraints, through the interactive iteration of the results of demand allocation and network flow allocation, the optimal demand allocation, path and network flow under the minimum total distribution time are obtained. Zhan Sha-lei et al. [24,25] use Bayesian analysis method to update the demand with historical experience data to establish the optimal material allocation time model. Guo Zixue [26] in order to improve the ability of rapid response to the demand for emergency materials, based on the characteristics of the emergency material scheduling problem, triangular fuzzy numbers are introduced to describe the uncertain attributes of emergency dispatching. The time minimization fuzzy optimization model of emergency material scheduling problem under triangular fuzzy information environment is established, and its equivalent fuzzy chance constrained programming model is given. Explore the deterministic transformation method of the model when the parameter is triangular fuzzy number, and verify the effectiveness of the transformation method through empirical case analysis. He Tilong [27] and others studied the scheduling problem of emergency materials from multiple rescue points to multiple demand points based on three kinds of road damage: feasible, repairable, and impassable. An optimal objective function is established, which takes into account the minimum total loading time and the lowest cost in the process of transportation, and the improved moth flaming swarm intelligent algorithm is used to solve the optimal emergency material scheduling scheme. Wang Hai-jun et al. [28] studied the dynamic supply of emergency materials for multimodal transport under the condition of uncertain supply and demand in the three-level emergency materials distribution network. In order to solve the problem of fairness and efficiency of material distribution in existing models, Zhou et al. [29] proposed a multi-objective dynamic scheduling model of emergency materials with matching supply and demand. Wang and Sun [30] also proposed a multi-stage dynamic scheduling model for emergency materials, but its research is different from the traditional method, using absolute shortage of materials to quantify fairness.
2.3. Markov Decision-Making Process
Zhan Sha-lei et al. [31] used MDP to establish a dynamic distribution model of emergency supplies for the dynamic distribution of emergency supplies in the environment of unbalanced supply and demand under typhoon disaster. According to the existing research experience, the dynamic distribution model has obvious advantages to solve the problem of short time supply shortage of expendable emergency supplies. Zhan Sha-lei et al. [31] for the dynamic allocation of emergency materials under typhoon disasters and the imbalance between supply and demand, the dynamic allocation model of emergency materials is established by using MDP. Regnier [32] successfully applied Markov decision-making method to weather forecast, hurricane path tracking, predisaster evacuation, and so on. Li Haonan [33] uses MDP to solve the problem of route selection in multi-mode traffic networks. Through a comprehensive analysis of the factors that affect travelers' travel choice, a path decision model based on Markov decision method is constructed, an algorithm is designed, and an example is given to verify the feasibility of the proposed model and algorithm. Yang Feng [34] in view of the situation that the demand for emergency rescue materials in urban emergencies changes with the evolution of the accident, the demand for emergency rescue materials is designed as MDP, and a dynamic material allocation strategy is proposed. The decision-making model of rescue material demand is constructed and then optimized by flower pollination algorithm. Deng Xiaoping [35] based on the longitudinal kinematic characteristics of the following vehicle and the pilot vehicle, the MDP of the vehicle following process is established. Combined with the minimum safe distance model, an efficient, comfortable, and safe vehicle following decision algorithm is designed. Liang Feng [36] aims to maximize the profit of hospital inspection equipment, establishes a finite time domain MDP model, and combines the dynamic programming theory to obtain the optimal reservation scheduling strategy of the system. Considering the different quality of service parameters between different mobile terminals, Ning et al. [37] regards the vertical handoff decision problem as a MDP, establishes an incentive function with the goal of maximizing the expected total return and minimizing the average handoff times, evaluates the service quality of each link, and obtains a stable and deterministic handoff decision strategy. Talluri and Van Ryzin [38] and others take customer selection behavior as the research background, construct the MDP model, take the nested allocation strategy as the optimal strategy, and prove that the model and the estimation process are effective. Schütz [39] aiming at the problem of examination resource allocation among different types of patients, a continuous-time MDP, is established to consider the randomness of equipment service time and the unpunctual factors of some patients, and the optimization goal is to obtain the maximum benefit for the hospital, which is solved by the method of approximate dynamic programming. Zhuang and Li [40] uses the MDP model to study how to distribute multiple examination equipment among the three types of patients in order to maximize benefits on the day of service.
3. MDP MODEL OF EMERGENCY MEDICAL SUPPLIES DISPATCHING
In this section, the MDP model and the required parameters and related model components are described. Finally, the optimal equation of the MDP for medical material scheduling in this paper is given.
3.1. Model Description
The materials that can be raised in a certain period under sudden public health events are limited; that is, the materials that can be dispatched by the model in a specific time are limited. According to the time required for dispatching materials, the system time is discretized and divided into segments with time length D, which are represented by
A specific amount of time is needed for the system to receive and respond to the requirements of a node hospital, which is defined as the response time
After the dispatching center responds to the nodes with requirements, the transport team returns to the dispatching center to complete a service.
3.2. Model Formulation
This section introduces the MDP model formula used to determine the emergency medical material dispatching strategy under the public health emergencies of infectious diseases. The MDP model is designed to determine how to conduct material scheduling in the case of limited materials for requests in a given node network to maximize the response efficiency of the node network. We make it a general dispatching principle that the dispatching center distributes the material needs of nodes according to the order in which material requests are made.
For the model in this article, the following parameters need to be provided.
h represents the classification of patients,
The model assumes whether the reaction is based on the response level of the node, the material scheduling situation, and the distance between the node's hospital and the dispatching center. We have considered that the assumption of an exponential distribution of node event arrival probability is unreasonable. Computational experiments by Jarvis [41] show that the behavior of the system we are modeling is relatively insensitive to the shape of the service time distribution. Gross and Harris [42] also provide well-known insensitive results. McLay and Mayorga [43] performed simulation analysis to compare the use of exponentially distributed service times with more realistic service times. They found that the assumption of index service time did not significantly affect the optimal strategy. Considering that our model is quite different from theirs, our model has a feedback mechanism; that is, the response effect in the last period affect the event arrival probability of the system in the next period, so we include the response effect, namely, the service efficiency, in the calculation of the event arrival probability. The service rate refers to the ratio between the efficiency obtained by the system in
The MDP model components are described as follows:
State-space:
State-space table:
| State | Setting |
|---|---|
Action space: The action of whether to respond is indicated by
The model allows nodes that have not been processed in the previous period to join in this stage.
State transition probability matrix
The
Priority: The hospital response level
Efficiency: When the dispatching center responds to the material request put forward by node
When the material demand proposed by node
We define
We add a penalty item to the effect of each node to ensure that some node hospitals in the system do not turn into worse situations. When the total time from node
Transition state:
Optimality equation
4. DATA SIMULATION EXPERIMENT
In this section, we apply the MDP model developed in the previous section to Wuhan city under lockdown management due to the COVID-19 epidemic.
4.1. Model Parameters
We set up an application scenario for the model and provided an emergency medical supply scheduling scheme for the designated hospitals that treated patients in Wuhan, closed during the novel coronavirus pneumonia epidemic. City closure management means that to do an excellent job in preventing and controlling pneumonia in novel coronavirus and effectively cut off the route of virus transmission. Since 10:00 on January 23, the city bus, subway, ferry, and long-distance passenger transport in Wuhan have been suspended. Without special reasons, citizens cannot leave Wuhan, and there is a temporary closure of the airport and railway station from Han. According to the government documents of Wuhan Municipal Government and the epidemic prevention and control department, during the epidemic prevention and control period, designated hospitals in Wuhan mainly treated patients with novel coronavirus were divided into five batches, among which the fourth and fifth batches were specially treated for suspected cases transferred from the previous three batches of designated hospitals. Therefore, the system only carries out simulation on 24 hospitals in the first three batches. On January 27, the press conference of the Wuhan epidemic situation said that fundraising was unified and centralized, and donations were only accepted through provincial and municipal Red Cross Societies. Therefore, the Wuhan Red Cross Society was taken as the systematic material dispatching center.
Twenty-four designated hospitals are numbered, and the numbering sequence is listed in Table 1 below.
| Hospital | Wuhan Hankou hospital | Wuhan red cross hospital | Wuhan Seventh Hospital | Wuhan No.4 hospital west yard area | Wuhan Ninth Hospital | Wuhan Wuchang hospital |
| i | 1 | 2 | 3 | 4 | 5 | 6 |
| Hospital | Wuhan No.5 Hospital | Central hospital of wuhan Houhu Campus | Wuhan No.3 Hospital Guanggu Campus | Wuhan WISCO Second Hospital | Huazhong University of Science and Technology Affiliated tongji hospital Sino-French New City Campus | Wuhan union medical college hospital west area |
| i | 7 | 8 | 9 | 10 | 11 | 12 |
| Hospital | Hubei provincial people's hospital east yard | Hubei Provincial Hospital of Integrated Traditional Chinese and Western Medicine | Tianyou Hospital Affiliated to Wuhan University of Science and Technology | Wuhan No.6 Hospital | Wuhan traditional Chinese medicine hospital hanyang branch | Wuhan Zijing hospital |
| i | 13 | 14 | 15 | 16 | 17 | 18 |
| Hospital | Hubei liuqier combination of Chinese traditional and western medicine orthopedics hospital | Wuhan Xinzhou district traditional Chinese medicine hospital | Wuhan caidian district Maternal and Child Health Hospital | Wuhan huangpi district traditional Chinese medicine hospital | Wuhan qiaoya boai recovery hospital | Wuhan hannan district traditional Chinese medicine hospital |
| i | 19 | 20 | 21 | 22 | 23 | 24 |
Hospital number table.
According to Baidu Map navigation, the shortest driving distance between each designated hospital and the Red Cross Society and the time required for driving at this time are obtained, as displayed in Table 2. As the Wuhan municipal government has carried out road control in the city, it is not affected by traffic factors (traffic lights and jams) in general, so we take the highest driving speed in the shortest route as the simulated average driving speed.
| i | 1 | 2 | 3 | 4 | 5 | 6 | 7 | 8 | 9 | 10 | 11 | 12 |
|---|---|---|---|---|---|---|---|---|---|---|---|---|
| dij/km | 5.7 | 5.3 | 9.4 | 5.1 | 11.9 | 7.7 | 7.7 | 7.6 | 19 | 24.7 | 20.8 | 19.6 |
| Tij/min | 18 | 18 | 22 | 27 | 27 | 18 | 22 | 24 | 47 | 61 | 49 | 53 |
| v | 0.32 | 0.29 | 0.43 | 0.19 | 0.32 | 0.43 | 0.35 | 0.317 | 0.4 | 0.4 | 0.42449 | 0.37 |
| MinTij/min | 9 | 8 | 14 | 8 | 18 | 12 | 12 | 11.97 | 28 | 36 | 31 | 29 |
| 13 | 14 | 15 | 16 | 17 | 18 | 19 | 20 | 21 | 22 | 23 | 24 | |
| dij/km | 27.8 | 4.8 | 11.6 | 3.3 | 13.9 | 5.9 | 12.9 | 65.3 | 30.1 | 37.4 | 31.9 | 43.5 |
| Tij/min | 63 | 17 | 28 | 11 | 34 | 14 | 35 | 95 | 65 | 56 | 72 | 68 |
| v | 0.44 | 0.2824 | 0.32 | 0.32 | 0.41 | 0.42 | 0.37 | 0.69 | 0.32 | 0.67 | 0.44 | 0.64 |
| MinTij/min | 41 | 6.9565 | 17 | 5 | 21 | 9 | 19 | 95 | 44 | 55 | 79 | 63 |
Hospital distance table.
According to official statistics, as of 24:00 on February 10, 2020, Hubei Province reported 31,728 cases of pneumonia in COVID-19, including 18,454 cases in Wuhan, and 974 cases died in the province, with a fatality rate of 3.07%, including 748 cases in Wuhan with a fatality rate of 4.05%. According to the relevant news reports during the epidemic, when all sectors of society donate materials to the Wuhan Red Cross Society, the unloading time of all kinds of materials is usually computed by tons: the unloading time per unit of materials is accumulated, and the unloading time per unit of materials is 10 minutes. The error time is controlled within 0–60 minutes, and random error is made for each point by Python. As the number of patients and materials mentioned above are too large and the scales are not uniform, the data are uniformly processed, the number of people is equivalent to 0–50, and the number of materials is equivalent to a number in m. The materials needed by each designated hospital are within 0–10 m, and the number of materials that can be dispatched within d is 50 m. Scheduling time d is set to 360 minutes (6 hours). Each designated hospital's priority calculation process is not detailed in this section but is directly given in the table.
State transition matrix: The priority of the state transition matrix of the
Designated hospital state transition matrix priority:
The patient state transition matrix priority:
Different priorities of patient treatment immediately affect the following equation:
Different types of patient treatment effects:
Effect of different priorities:
The penalty time in the system is set to 1590 minutes (26.5 hours). From the state transition matrix, the probability of maintaining the original priority is the highest when the hospital that puts forward the urgent medical supplies demand within D is responded, thus, the situation does not noticeably deteriorate if it is not responded within D. Considering the extremely infectious characteristics of the novel coronavirus, and according to relevant news reports, during the epidemic prevention and control period, many hospitals were infected due to the lack of emergency medical materials such as masks and protective clothing, greatly reducing the rescue efficiency of the hospital. We assume that the emergency medical supply-demand of a designated hospital in two consecutive days has never been met, and the treatment situation becomes terrible. The calculation of specific data is based on the calculation equation of response time:
Scheduling time is 360 minutes, maximum driving time is 95 minutes, maximum error time is 60 minutes, and maximum unloading time is 100 minutes, so the longest response time of two consecutive periods is 1230 minutes (28.5 hours), and the demands put forward in the previous stage is processed in the next stage, so A = 1590 minutes (26.5 hours).
4.2. Simulation Results and Optimal Strategy
This section only presents the simulation data of four time periods D and the scheduling results of the model. The number of designated hospitals that put forward material demand in period
| i | 8 | 22 | 2 | 1 | 7 | 4 | 21 | 14 | 15 | 6 |
|---|---|---|---|---|---|---|---|---|---|---|
| order | 1 | 2 | 3 | 4 | 5 | 6 | 7 | 8 | 9 | 10 |
| μi | 3 | 2 | 2 | 1 | 3 | 2 | 1 | 3 | 4 | 2 |
| Mi | 5 | 9 | 4 | 2 | 7 | 5 | 3 | 8 | 9 | 4 |
| h = 1 | 43 | 29 | 31 | 11 | 6 | 19 | 20 | 10 | 19 | 15 |
| h = 2 | 25 | 5 | 11 | 7 | 9 | 35 | 16 | 16 | 45 | 16 |
| h = 3 | 7 | 24 | 7 | 3 | 44 | 2 | 2 | 32 | 37 | 21 |
Simulation data of
The rescue efficiency, total expected efficiency, and expected response time of 10 designated hospitals on different patients were calculated. As shown in Table 4, the red mark is the expected effect of the designated hospital that has not responded under the maximum efficiency. In contrast, the blue mark is the designated hospital's expected efficiency that has not responded under general efficiency. The service rate under optimal efficiency is defined as
| i | 8 | 22 | 2 | 1 | 7 | 4 | 21 | 14 | 15 | 6 |
|---|---|---|---|---|---|---|---|---|---|---|
| μi | 3 | 2 | 2 | 1 | 3 | 2 | 1 | 3 | 4 | 2 |
| φi | 58.8 | 38.6 | 26 | 5.8 | 77.7 | 30.6 | 9.8 | 68.4 | 143 | 36.6 |
| φe | 46.5 | 32.7 | 20.6 | 4.67 | 70 | 24.7 | 7.72 | 60.36 | 124 | 31.5 |
| φ | 105 | 71.3 | 46.6 | 10.5 | 148 | 55.3 | 17.5 | 128.8 | 267 | 68.1 |
| φm | 21.05 | 7.92 | 11.66 | 5.24 | 21.10 | 11.05 | 5.84 | 16.10 | 29.66 | 17.03 |
Efficiency of
Based on the optimality equation:
In general, the efficiency is 582.89, the materials used and 47 m, the remaining 3 m,
Choice for designated hospitals: 8, 22, 2, 1, 7, 4, 6, 14, 21
The system had a maximum efficiency of 917.93, an optimal efficiency of 860.81,
System choice for designated hospitals, numbers 4, 6, 7, 8, 14, 15, 21, and 22
Two kinds of schemes under the expected response time are calculated, and the response time limit after A comparison shows that the designated hospital's response time was not beyond A. Thus, the system does not penalize the expected efficiency achieved at each designated hospital. The efficiency obtained at this time is the optimal efficiency of the system.
| i | 8 | 22 | 2 | 1 | 7 | 4 | 21 | 14 | 15 | 6 |
|---|---|---|---|---|---|---|---|---|---|---|
| D | 360 | 360 | 360 | 360 | 360 | 360 | 360 | 360 | 360 | 360 |
| Tij | 12 | 55 | 8 | 9 | 12 | 8 | 44 | 7 | 17 | 12 |
| Tε | 53 | 17 | 26 | 13 | 36 | 55 | 46 | 28 | 14 | 35 |
| Tm | 50 | 20 | 70 | 20 | 70 | 50 | 30 | 80 | 90 | 40 |
| Ti | 475 | 452 | 464 | 402 | 478 | 473 | 480 | 475 | 481 | 447 |
Response time of
| i | 15 | 10 | 18 | 17 | 3 | 11 | 14 | 5 | 19 | 7 | 1 | 6 | 16 |
|---|---|---|---|---|---|---|---|---|---|---|---|---|---|
| order | 1 | 1 | 2 | 3 | 4 | 5 | 6 | 7 | 8 | 9 | 10 | 11 | 12 |
| μi | 4 | 2 | 1 | 3 | 2 | 2 | 4 | 4 | 2 | 3 | 3 | 1 | 2 |
| Mi | 9 | 6 | 2 | 6 | 6 | 2 | 9 | 5 | 2 | 9 | 8 | 3 | 9 |
| h = 1 | 19 | 26 | 22 | 2 | 15 | 12 | 49 | 44 | 13 | 14 | 45 | 18 | 46 |
| h = 2 | 45 | 5 | 35 | 10 | 41 | 28 | 26 | 28 | 39 | 1 | 28 | 39 | 28 |
| h = 3 | 37 | 37 | 9 | 44 | 25 | 29 | 39 | 43 | 17 | 42 | 26 | 4 | 17 |
GE Simulation data of
| i | 2 | 1 | 3 | 22 | 4 | 13 | 10 | 15 | 8 | 12 | 16 |
|---|---|---|---|---|---|---|---|---|---|---|---|
| order | 1 | 1 | 1 | 2 | 3 | 4 | 5 | 6 | 7 | 8 | 9 |
| μi | 2 | 1 | 3 | 4 | 2 | 2 | 1 | 2 | 1 | 2 | 1 |
| Mi | 4 | 2 | 6 | 9 | 6 | 7 | 3 | 4 | 5 | 3 | 3 |
| h = 1 | 31 | 11 | 42 | 48 | 10 | 22 | 15 | 31 | 12 | 41 | 24 |
| h = 2 | 11 | 7 | 15 | 29 | 11 | 17 | 10 | 9 | 16 | 13 | 2 |
| h = 3 | 7 | 3 | 48 | 44 | 45 | 40 | 26 | 38 | 35 | 15 | 12 |
OE Simulation data of
Points that have not responded under different internal efficiencies of
| i | 15 | 10 | 18 | 17 | 3 | 11 | 14 | 5 | 19 | 7 | 1 | 6 | 16 |
|---|---|---|---|---|---|---|---|---|---|---|---|---|---|
| μi | 4 | 2 | 1 | 3 | 2 | 2 | 4 | 4 | 2 | 3 | 3 | 1 | 2 |
| φi | 143 | 50.4 | 19.4 | 76.2 | 55.6 | 50.6 | 148 | 154.8 | 45.6 | 72.3 | 91.2 | 17.3 | 52.2 |
| φe | 123.72 | 43.82 | 15.97 | 69.06 | 47.70 | 44.04 | 125.20 | 131.76 | 38.78 | 64.59 | 75.78 | 14.11 | 42.52 |
| φ | 266.92 | 94.22 | 35.37 | 145.26 | 103.30 | 94.64 | 273.60 | 286.56 | 84.38 | 136.89 | 166.98 | 31.41 | 94.72 |
| φm | 29.66 | 15.70 | 17.69 | 24.21 | 17.22 | 47.32 | 30.40 | 57.31 | 42.19 | 15.21 | 20.87 | 10.47 | 10.52 |
GE of
The current material in
The designated hospitals are numbered 15, 10, 18, 17, 3, 11, 14, 5, 19, and 6.
| i | 2 | 1 | 3 | 22 | 4 | 13 | 10 | 15 | 8 | 12 | 16 |
|---|---|---|---|---|---|---|---|---|---|---|---|
| μi | 2 | 1 | 3 | 4 | 2 | 2 | 1 | 2 | 1 | 2 | 1 |
| φi | 26 | 5.8 | 111 | 161 | 55.6 | 59 | 19 | 55.8 | 24.7 | 39.2 | 11.4 |
| φe | 20.62 | 4.67 | 95.13 | 136.84 | 49.70 | 51.46 | 16.56 | 48.14 | 21.78 | 31.78 | 9.38 |
| φ | 46.62 | 10.47 | 205.83 | 298.04 | 105.30 | 110.46 | 35.56 | 103.94 | 46.48 | 70.98 | 20.78 |
| φm | 11.66 | 5.24 | 34.31 | 33.12 | 17.55 | 15.78 | 11.85 | 25.99 | 9.30 | 23.66 | 6.93 |
OE of
The maximum efficiency of the system in
| i | 15 | 10 | 18 | 17 | 3 | 11 | 14 | 5 | 19 | 7 | 1 | 6 | 16 |
|---|---|---|---|---|---|---|---|---|---|---|---|---|---|
| D | 720 | 360 | 360 | 360 | 360 | 360 | 360 | 360 | 360 | 360 | 360 | 360 | 360 |
| Tij | 17 | 36 | 9 | 21 | 14 | 31 | 7 | 18 | 19 | 12 | 9 | 12 | 5 |
| Tε | 90 | 60 | 20 | 60 | 20 | 20 | 50 | 50 | 10 | 90 | 80 | 30 | 30 |
| Tm | 30 | 37 | 9 | 44 | 25 | 29 | 39 | 43 | 17 | 42 | 26 | 14 | 17 |
| Ti | 857 | 493 | 398 | 485 | 419 | 440 | 456 | 471 | 406 | 504 | 475 | 416 | 412 |
GE response time of
| i | 2 | 1 | 3 | 22 | 4 | 13 | 10 | 15 | 8 | 12 | 16 |
|---|---|---|---|---|---|---|---|---|---|---|---|
| D | 720 | 720 | 360 | 360 | 360 | 360 | 360 | 360 | 360 | 360 | 360 |
| Tij | 8 | 9 | 31 | 55 | 18 | 29 | 12 | 36 | 9 | 29 | 12 |
| Tε | 70 | 20 | 60 | 30 | 10 | 70 | 30 | 40 | 50 | 90 | 40 |
| Tm | 5 | 12 | 14 | 8 | 8 | 41 | 36 | 17 | 12 | 15 | 5 |
| Ti | 803 | 761 | 465 | 453 | 396 | 500 | 438 | 453 | 431 | 494 | 417 |
OE response time of
The expected response time of the two schemes is not more than A, and the peak efficiency that the system can obtain is the optimal efficiency of the system.
| i | 7 | 1 | 16 | 6 | 14 | 13 | 12 | 9 | 4 | 21 | 18 | 8 | 20 | 19 |
|---|---|---|---|---|---|---|---|---|---|---|---|---|---|---|
| order | 1 | 1 | 1 | 1 | 2 | 3 | 4 | 5 | 6 | 7 | 8 | 9 | 10 | 11 |
| μi | 3 | 3 | 2 | 4 | 4 | 1 | 2 | 3 | 1 | 2 | 1 | 4 | 3 | 2 |
| Mi | 9 | 8 | 9 | 4 | 5 | 2 | 4 | 4 | 1 | 4 | 3 | 6 | 6 | 3 |
| h = 1 | 14 | 45 | 46 | 2 | 5 | 10 | 26 | 17 | 6 | 40 | 8 | 33 | 11 | 26 |
| h = 2 | 1 | 28 | 28 | 50 | 40 | 6 | 18 | 30 | 10 | 7 | 15 | 25 | 49 | 43 |
| h = 3 | 42 | 26 | 17 | 41 | 50 | 8 | 42 | 42 | 14 | 9 | 12 | 50 | 30 | 11 |
GE Simulation data of
The points that have not responded under different efficiencies of
| i | 1 | 4 | 9 | 16 | 10 | 3 | 2 | 12 | 17 | 7 |
|---|---|---|---|---|---|---|---|---|---|---|
| order | 1 | 1 | 2 | 3 | 4 | 5 | 6 | 7 | 8 | 9 |
| μi | 1 | 2 | 4 | 4 | 3 | 1 | 2 | 4 | 3 | 1 |
| Mi | 2 | 7 | 9 | 8 | 5 | 2 | 5 | 8 | 6 | 3 |
| h = 1 | 11 | 31 | 25 | 38 | 38 | 25 | 20 | 19 | 36 | 2 |
| h = 2 | 7 | 10 | 39 | 33 | 13 | 3 | 41 | 30 | 7 | 7 |
| h = 3 | 3 | 27 | 47 | 41 | 39 | 6 | 11 | 48 | 42 | 13 |
OE Simulation data of
| i | 7 | 1 | 16 | 6 | 14 | 13 | 12 | 9 | 4 | 21 | 18 | 8 | 20 | 19 |
|---|---|---|---|---|---|---|---|---|---|---|---|---|---|---|
| μi | 3 | 3 | 2 | 4 | 4 | 1 | 2 | 3 | 1 | 2 | 1 | 4 | 3 | 2 |
| φi | 72.3 | 91.2 | 52.2 | 144 | 152 | 7.8 | 63.2 | 100.2 | 11.2 | 29.2 | 12.1 | 156 | 95.7 | 47.2 |
| φe | 64.59 | 75.78 | 42.52 | 126.56 | 134.80 | 6.58 | 54.92 | 87.60 | 9.78 | 22.98 | 10.39 | 135.48 | 82.77 | 38.90 |
| φ | 136.89 | 166.98 | 94.72 | 270.16 | 286.80 | 14.38 | 118.12 | 187.80 | 20.98 | 52.18 | 22.49 | 291.88 | 178.47 | 86.10 |
| φm | 15.21 | 20.87 | 10.52 | 67.54 | 57.36 | 7.19 | 29.53 | 46.95 | 20.98 | 13.05 | 7.50 | 48.65 | 29.75 | 28.70 |
GE of
Materials in
The designated hospitals selected for service are numbered 7, 1, 16, 6, 14, 13, 12, 9, 4, 21, and 18.
| i | 1 | 4 | 9 | 16 | 10 | 3 | 2 | 12 | 17 | 7 |
|---|---|---|---|---|---|---|---|---|---|---|
| μi | 1 | 2 | 4 | 4 | 3 | 1 | 2 | 4 | 3 | 1 |
| φi | 5.8 | 45.4 | 161 | 152 | 93 | 8.9 | 43.6 | 147.2 | 90.9 | 9 |
| φe | 4.67 | 38.52 | 139.48 | 129.72 | 79.53 | 7.01 | 36.22 | 128.96 | 78.33 | 8.01 |
| φ | 10.47 | 83.92 | 300.28 | 281.72 | 172.53 | 15.91 | 79.82 | 276.16 | 169.23 | 17.01 |
| φm | 5.24 | 11.99 | 33.36 | 35.22 | 34.51 | 7.96 | 15.96 | 34.52 | 28.21 | 5.67 |
OE of
In
The designated hospitals selected by the service system are numbered 4, 9, 16, 10, 3, 2, 12, 17, and 7, respectively.
| i | 7 | 1 | 16 | 6 | 14 | 13 | 12 | 9 | 4 | 21 | 18 | 8 | 20 | 19 |
|---|---|---|---|---|---|---|---|---|---|---|---|---|---|---|
| D | 720 | 720 | 720 | 360 | 360 | 360 | 360 | 360 | 360 | 360 | 360 | 360 | 360 | 360 |
| Tij | 12 | 9 | 5 | 12 | 7 | 5 | 29 | 28 | 8 | 44 | 9 | 12 | 95 | 19 |
| Tε | 90 | 80 | 30 | 90 | 90 | 20 | 80 | 40 | 50 | 40 | 30 | 60 | 60 | 70 |
| Tm | 38 | 27 | 25 | 55 | 6 | 29 | 26 | 38 | 49 | 42 | 19 | 43 | 28 | 53 |
| Ti | 860 | 836 | 780 | 517 | 463 | 414 | 495 | 466 | 467 | 486 | 418 | 475 | 543 | 502 |
GE response time of
| i | 1 | 4 | 9 | 16 | 10 | 3 | 2 | 12 | 17 | 7 |
|---|---|---|---|---|---|---|---|---|---|---|
| D | 1080 | 360 | 360 | 360 | 360 | 360 | 360 | 360 | 360 | 360 |
| Tij | 9 | 8 | 28 | 5 | 36 | 14 | 8 | 29 | 21 | 12 |
| Tε | 20 | 70 | 90 | 80 | 50 | 20 | 50 | 80 | 60 | 30 |
| Tm | 26 | 27 | 27 | 41 | 39 | 6 | 11 | 48 | 31 | 13 |
| Ti | 1135 | 465 | 505 | 486 | 485 | 400 | 429 | 517 | 472 | 415 |
OE response time of
The expected response time of the two schemes is not more than A, and the ideal efficiency that the system can obtain is the optimal efficiency of the system.
According to the transition rate
| i | 8 | 20 | 19 | 5 | 23 | 10 | 9 | 14 | 1 | 17 | 21 | 18 | 13 | 4 |
|---|---|---|---|---|---|---|---|---|---|---|---|---|---|---|
| order | 1 | 1 | 1 | 1 | 2 | 3 | 4 | 5 | 6 | 7 | 8 | 9 | 10 | 11 |
| μi | 4 | 3 | 2 | 1 | 2 | 2 | 2 | 2 | 4 | 2 | 3 | 2 | 2 | 1 |
| Mi | 6 | 6 | 3 | 3 | 4 | 4 | 5 | 4 | 8 | 2 | 8 | 4 | 5 | 3 |
| h = 1 | 33 | 11 | 26 | 6 | 30 | 32 | 15 | 28 | 32 | 3 | 42 | 50 | 8 | 7 |
| h = 2 | 25 | 49 | 43 | 20 | 13 | 23 | 22 | 25 | 45 | 28 | 11 | 11 | 34 | 37 |
| h = 3 | 50 | 30 | 11 | 3 | 14 | 30 | 19 | 8 | 47 | 23 | 37 | 1 | 18 | 2 |
GE Simulation data of
However, the unresponsive points in
| i | 1 | 7 | 8 | 12 | 4 | 18 | 17 | 3 | 9 | 21 |
|---|---|---|---|---|---|---|---|---|---|---|
| order | 1 | 1 | 1 | 2 | 3 | 4 | 5 | 6 | 7 | 8 |
| μi | 1 | 1 | 3 | 3 | 3 | 2 | 1 | 2 | 4 | 3 |
| Mi | 2 | 3 | 6 | 5 | 6 | 4 | 4 | 5 | 9 | 8 |
| h = 1 | 11 | 2 | 28 | 26 | 50 | 3 | 9 | 28 | 20 | 21 |
| h = 2 | 7 | 7 | 22 | 34 | 17 | 12 | 8 | 17 | 32 | 33 |
| h = 3 | 3 | 13 | 30 | 28 | 20 | 34 | 11 | 37 | 41 | 39 |
OE Simulation data of
| i | 8 | 20 | 19 | 5 | 23 | 10 | 9 | 14 | 1 | 17 | 21 | 18 | 13 | 4 |
|---|---|---|---|---|---|---|---|---|---|---|---|---|---|---|
| μi | 4 | 3 | 2 | 1 | 2 | 2 | 2 | 2 | 4 | 2 | 3 | 2 | 2 | 1 |
| φi | 156 | 95.7 | 47.2 | 8.7 | 33.8 | 56.6 | 38.2 | 34.2 | 174 | 41 | 90.6 | 27.6 | 41.6 | 13.5 |
| φe | 135.48 | 82.77 | 38.90 | 7.22 | 27.78 | 48.06 | 32.68 | 27.70 | 149.40 | 36.00 | 76.95 | 20.42 | 35.80 | 11.15 |
| φ | 291.88 | 178.47 | 86.10 | 15.92 | 61.58 | 104.66 | 70.88 | 61.90 | 323.00 | 77.00 | 167.55 | 48.02 | 77.40 | 24.65 |
| φm | 48.65 | 29.75 | 28.70 | 5.31 | 15.40 | 26.17 | 14.18 | 15.48 | 40.38 | 38.50 | 20.94 | 12.01 | 15.48 | 8.22 |
GE of
The general efficiency of
The designated hospitals selected for service are numbered 8, 20, 19, 5, 23, 10, 9, 14, 1, 17, and 18.
| i | 1 | 7 | 8 | 12 | 4 | 18 | 17 | 3 | 9 | 21 |
|---|---|---|---|---|---|---|---|---|---|---|
| μi | 1 | 1 | 3 | 3 | 3 | 2 | 1 | 2 | 4 | 3 |
| φi | 5.8 | 9 | 81.6 | 88.2 | 75.3 | 42.4 | 9.7 | 58.4 | 136 | 101 |
| φe | 4.67 | 8.01 | 69.66 | 75.06 | 61.35 | 38.12 | 8.32 | 50.38 | 118.64 | 87.39 |
| φ | 10.47 | 17.01 | 151.26 | 163.26 | 136.65 | 80.52 | 18.02 | 108.78 | 255.04 | 188.19 |
| φm | 5.24 | 5.67 | 25.21 | 32.65 | 22.78 | 20.13 | 4.51 | 21.76 | 28.34 | 23.52 |
OE of
The maximum efficiency of the system at
The designated hospitals selected by the service system are numbered 1, 8, 12, 4, 18, 17, 3, 9, and 21.
| i | 8 | 20 | 19 | 5 | 23 | 10 | 9 | 14 | 1 | 17 | 21 | 18 | 13 | 4 |
|---|---|---|---|---|---|---|---|---|---|---|---|---|---|---|
| D | 720 | 720 | 720 | 360 | 360 | 360 | 360 | 360 | 360 | 360 | 360 | 360 | 360 | 360 |
| Tij | 12 | 95 | 19 | 18 | 79 | 36 | 28 | 7 | 9 | 21 | 44 | 9 | 41 | 8 |
| Tε | 60 | 60 | 70 | 30 | 40 | 40 | 50 | 40 | 80 | 20 | 80 | 40 | 50 | 30 |
| Tm | 25 | 37 | 45 | 9 | 52 | 37 | 21 | 38 | 39 | 37 | 4 | 12 | 58 | 8 |
| Ti | 817 | 912 | 854 | 417 | 531 | 473 | 459 | 445 | 488 | 438 | 488 | 421 | 509 | 406 |
GE response time of
| i | 1 | 7 | 8 | 12 | 4 | 18 | 17 | 3 | 9 | 21 |
|---|---|---|---|---|---|---|---|---|---|---|
| D | 1440 | 720 | 360 | 360 | 360 | 360 | 360 | 360 | 360 | 360 |
| Tij | 9 | 12 | 28 | 5 | 21 | 14 | 8 | 29 | 21 | 12 |
| Tε | 20 | 30 | 60 | 50 | 60 | 40 | 40 | 50 | 90 | 80 |
| Tm | 26 | 35 | 10 | 30 | 44 | 12 | 33 | 42 | 36 | 7 |
| Ti | 1495 | 797 | 458 | 445 | 485 | 426 | 441 | 481 | 507 | 459 |
OE response time of
4.3. Discussion of Simulation Result
The result analysis shows that when the optimal strategy is applied to the medical material scheduling system, the response to the material request of the designated hospital is mainly determined by the priority of the designated hospital and the efficiency of the material unit. By comparing the simulation data of the four stages, it can be seen that when the optimal strategy is applied to the medical material scheduling system, the service rate of the system in the four stages is much higher than that in general. Under the optimal strategy, the service rate of the system in four stages is close to one, which basically meets the overall material demand of the system at the current stage, while the maximum service rate under the general strategy is only 0.83, as shown in Figure 1. Although there are designated hospitals under the optimal strategy, their response time is much longer than other designated hospitals. The model added a time constraint based on optimal efficiency to avoid the rapid deterioration of the epidemic situation in such designated hospitals due to the lack of timely services. In the fourth stage of the simulation experiment, we had this situation, and our optimal strategy solved it well.
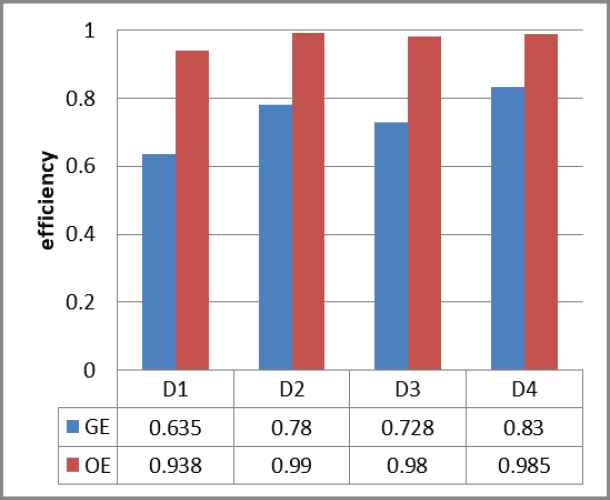
Comparison of efficiency.
We found that even though the optimal point strategy was adjusted to meet the time constraints, the service rate of the adjusted system did not decrease much before the adjustment, still reaching 0.985, proving. our model as a whole can significantly improve the service efficiency of the system.
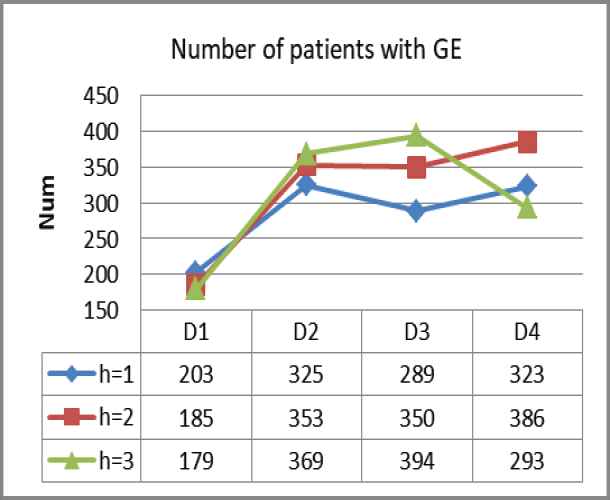
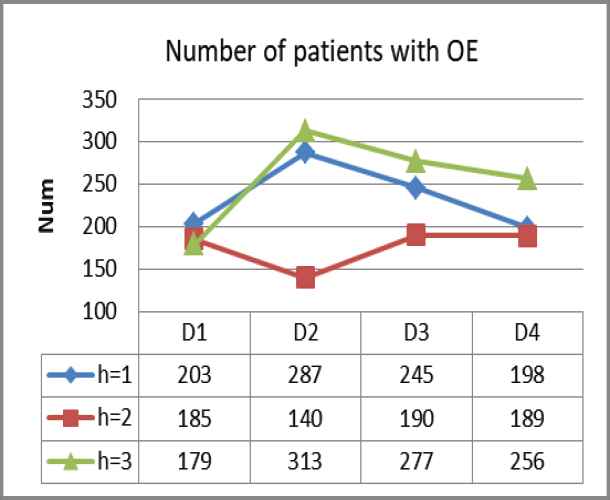
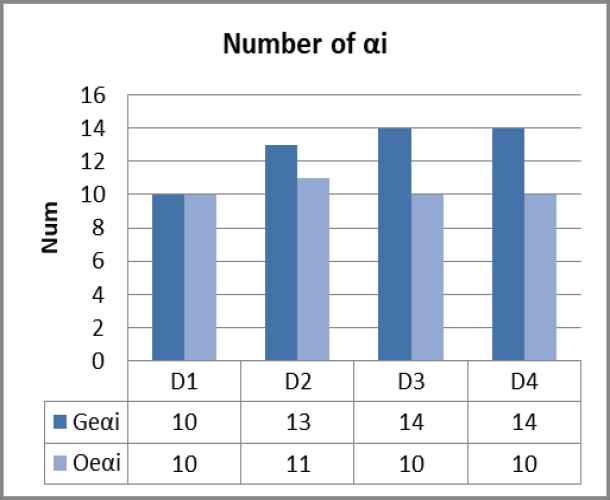
Figures 2–4 refers to the incident probability under service rate adjustment. For each stage of the system with two different material scheduling strategies, the number of designated hospitals that the system needs to respond to is
Quantitative trend
Quantitative trend
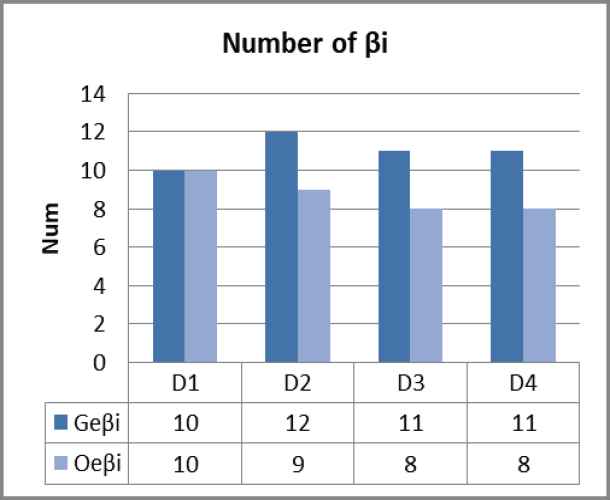
Number of patients under GE.
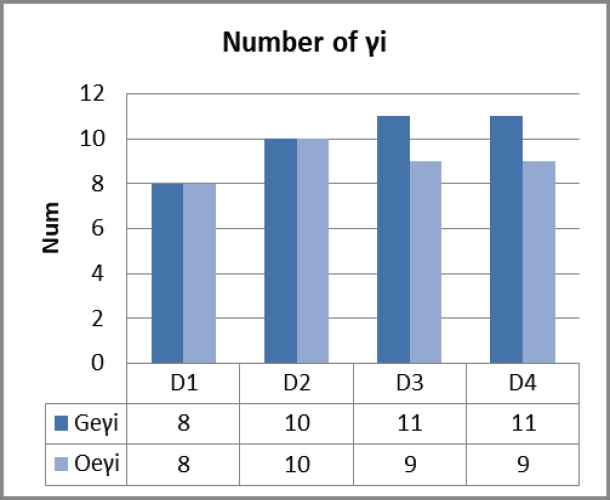
Number of patients with Optimal Efficiency (OE).
5. CONCLUSIONS
In recent years, large-scale public health emergencies such as infectious diseases have frequently occurred worldwide, seriously threatening people's lives and severely challenging the emergency management systems of all countries in the world. The timely supply of medical materials is essential to control the epidemic situation, among which emergency medical materials are the most important. Therefore, this paper proposes a Markov decision model for emergency medical material scheduling under public health emergencies such as infectious diseases, which discretizes the time of material scheduling continuously, describes the efficiency of medical material scheduling in a single period in detail, and finally obtains an optimality equation that maximizes the material efficiency of the whole system through iteration.
We applied the model to the scene of epidemic prevention and control in Wuhan and simulated the emergency medical material dispatching data of 24 designated hospitals in Wuhan under the condition of city closure management. According to the experimental data changes and results, our Markov decision model in the four stages dramatically improves the service rate of the emergency medical material scheduling system compared with the general material scheduling strategy. The total number of patients with three different priorities in each stage decreased significantly. Moreover, the number of designated hospitals that put forward material demand has also been considerably reduced, meaning our Markov decision model is effective in controlling the development of the epidemic in Wuhan and reducing the scale of infected people.
In the early stage of the epidemic outbreak, Wuhan closed the city promptly and controlled urban road traffic. City closure management has a remarkable effect in cutting off the virus's spread and curbing the epidemic's proliferation. Traffic control has brought great convenience to the government to allocate materials uniformly, reflected in the early stage of simulation data experiments. Our driving time is substantially lowered in the experiment, and there is no need to consider various traffic obstacles. This result shows that when similar public health emergencies such as infectious diseases occur, the government can take similar measures to curb the epidemic's spread. From the experimental results, the general material scheduling strategy cannot control the development of the epidemic situation in Wuhan, which shows that the material scheduling in such cases does not apply the principle of distribution according to needs but should adopt a dynamic scheduling strategy similar to the Markov decision model according to the development of events.
The main contributions of this paper are described as follows: we transform continuous MDP into equivalent continuous-discrete MDP. Our model prioritizes patients and hospitals, considers the state transitions of patients and hospitals at different stages, and gives state transition matrices, making the efficiency iteration of our model more detailed and reasonable. Based on previous scholars and the research content of this paper, we adjusted the utilization rate of service in the event occurrence probability (transition rate). There are also many shortcomings in this paper. First, the designated hospitals in Wuhan are put forward in five batches, and the situations in other provinces and cities are given in batches in accordance with those in Wuhan. This paper does not consider the problems of different batches between such hospitals, and the default system initially has the nodes of the first three batches of hospitals. We did not give the basis for the priority evaluation of the response of designated hospitals in detail but simply considered the number, distance, materials, and other factors of three patient types. Our simulation experiment is only a simple numerical simulation, and the simulation time stage is also less, and the amount of data is not large enough; We did not discuss the different kinds of medical supplies that were dispatched. These shortcomings provide directions for our future research, such as combining deep learning methods in the simulation stage of the model to make the results more accurate. Combined with the problem of hospitals opening in batches, we consider adding a certain number of designated hospitals in different stages of efficiency iteration. In the application of the model, it is used to dispatch and distribute complex medical materials. In summary, this paper proposes the Markov decision model of emergency medical supplies under the public health emergencies of infectious diseases, which is suitable for the outbreak of public emergencies of infectious diseases, without considering the restrictions of personnel circulation and vehicle traffic in a closed environment. This method can make more efficient use of emergency medical supplies, improve the system's service rate, and effectively control the development of the epidemic.
CONFLICTS OF INTEREST
The authors declare no conflicts of interest.
AUTHORS' CONTRIBUTIONS
Xiaojia Wang, Zhizhen Liang, Keyu Zhu contributed to the conception of the study; Zhizhen Liang performed simulation experiment; Xiaojia Wang contributed significantly to the model; Xiaojia Wang, Zhizhen Liang performed the data analyses and wrote the manuscript; Keyu Zhu helped perform the analysis with constructive discussions.
ACKNOWLEDGMENTS
This work was supported by a grant from the Key Disease of Diabetes Mellitus Study Center at the National Chinese Medicine Clinical Research Base, the China Scholarship Council, the National Natural Science Foundation of China Grant No. U2001201, 61876055, 71101041, and the National Statistics Research Projects Grant No. 2013LZ07, and National Steering Committee for Graduate Education of Chinese Medicine and Traditional Chinese Medicine Grant No. 20190723-FJ-B39.
REFERENCES
Cite this article
TY  - JOUR
AU  - Xiaojia Wang
AU  - Zhizhen Liang
AU  - Keyu Zhu
PY  - 2021
DA  - 2021/03/12
TI  - Markov Decision Model of Emergency Medical Supply Scheduling in Public Health Emergencies of Infectious Diseases
JO  - International Journal of Computational Intelligence Systems
SP  - 1155
EP  - 1169
VL  - 14
IS  - 1
SN  - 1875-6883
UR  - https://doi.org/10.2991/ijcis.d.210222.002
DO  - 10.2991/ijcis.d.210222.002
ID  - Wang2021
ER  -