
Water-Energy-Food Nexus and Eco-Sustainability: A Three-Stage Dual-Boundary Network DEA Model for Evaluating Jiangsu Province in China
 , Guo Wei3, , Lihong Wang2
- DOI
- 10.2991/ijcis.d.210423.005How to use a DOI?
- Keywords
- Water–energy–food nexus; Eco-sustainability; Coupling effect; Efficiency assessment; Network DEA (NDEA)
- Abstract
The water–energy–food (W-E-F) nexus approach has become the basis for a host of many methods addressing the security of global resources, whose methods are often nonparametric, due to the complex and indefinable relationship among the three. In this work, the nonparametric evaluation method data envelopment analysis (DEA) is further extended to a three-stage dual-boundary network model (TD-NDEA) for dealing with the “black box” problem in W-E-F Nexus. In the empirical study, the TD-NDEA method is applied to assess the efficiencies of W-E-F nexus in 13 selected cities of Jiangsu Province in China, where W-E-F nexus is innovatively decomposed into three stages, “W-E,” “WE-F,” and “WEF.” External factors such as labor force, urbanization, and economy are included in the assessment. On this basis, environmental governance and policy interventions are utilized as indicators of eco-sustainability to reshape the third stage as “WEF-Eco.” It is perceived from the numeric analysis that (i) regional disparities in the efficiencies of W-E-F nexus expand significantly; (ii) compared with the labor force, urbanization, and economy are more remarkable toward influencing the efficiencies; and (iii) ecological sustainable planning plays an effective role in reducing regional heterogeneity and speeding up the process of regional coordination. Based upon the findings, relevant policy recommendations are carefully designed.
- Copyright
- © 2021 The Authors. Published by Atlantis Press B.V.
- Open Access
- This is an open access article distributed under the CC BY-NC 4.0 license (http://creativecommons.org/licenses/by-nc/4.0/).
1. INTRODUCTION
As the three basic resources for maintaining human production activities, the internal connections of water, energy, and food are inseparable. The constraint of any one of the three resources may limit the availability of the other two, and this relation is described as the water–energy–food (W-E-F) nexus [1,2]. On the one hand, the total amount of water resources restricts the allocation of water for industry and agriculture, and the supply of industrial energy supports processes such as the collection, transmission, and purification of water resources, and the trade among agricultural food also forms a virtual water flow. On the other hand, energy can provide mechanical power for food production, and food products can also be used as raw materials for biofuels.
However, the population growth and economic development are exposing water, energy, and food resources to problems of growing demand and limited supply. In addition, extreme climate change and degradation of the ecological environment are also reshaping the conditions for W-E-F nexus interactions. Located in the eastern coast of mainland China, Jiangsu Province has a permanent population of 80.507 million in 2018 according to the “Jiangsu Statistical Yearbook 2019.” As a strong economic province (10.32% of the national GDP), it is a large energy-consuming province (8.96% of the national total energy consumption) and a major food-producing region (5.46% of the national total grain output) as well. Its high population density (751 people per square km, ranked 4th among all the provinces in China) and urbanization (69.61%, compared to 59.58% nationwide) brings it a huge demand for water, energy, and food resources. Moreover, the province's eco-environment status index (66.2 of maximum 100) shows that its eco-environment pressure is still high. For more descriptions, see Section 4.1.
Along with the wide international interest in the research of W-E-F nexus, research papers regarding this field are increasing sharply. They primarily focused on exploring the interrelationship of WE, W-F, and E-F on a global, national, or regional scale, or quantitatively evaluating the coupling effects of W-E-F nexus. However, there are rare studies on the scale of cities, where W-E-F nexus functions on a relatively small scale [3]. Under the background of prominent resource and environmental constraints, taking 13 cities in Jiangsu Province as objects, assessing and analyzing the functional behavior and mutual adaptation mechanism between W-E-F nexus and eco-sustainability could play an exemplary role in promoting sustainable planning on a larger scale.
Data envelopment analysis (DEA), as a nonparametric method, is used to measure the relative efficiency of the decision-making units (DMUs). Different from parametric methods (mathematical statistics methods in econometrics), DEA uses mathematical programming as a tool and does not have statistical characteristics. There are complex and changeable internal relationships among water, energy, and food. It is difficult to assume the specific form of the function through the parameter method. The DEA method eliminates the need to determine the explicit expression of this relationship, only the observed values of input and output are sufficient to calculate the efficiency value, thereby avoiding the problems caused by incorrect assumptions of the function form. Therefore, the nonparametric DEA algorithm is chosen as the reliability evaluation algorithm for W-E-F Nexus research.
In this paper, traditional DEA is extended to a three-stage dual-boundary network DEA (TD-NDEA) model from the dual frontier DEA model and the network DEA (NDEA) model for evaluating the different stages of W-E-F nexus and the performance of eco-sustainability. For the 13 selected cities in the case study, the overall efficiency is calculated based on optimistic and pessimistic efficiency, the heterogeneity between different cities is analyzed, and the regional coevolution process is evaluated. The main innovations of this paper are as follows:
Traditional network DEA model is extended to the dual-boundary network DEA model for assessing the W-E-F nexus and eco-sustainability, and the overall efficiency is calculated separately between W-E-F nexus and W-E-F nexus involving eco-sustainability.
The “black box” of the traditional overall evaluation of the W-E-F nexus is broken down into three stages, W-E, WE-F, and WEF. Meanwhile, external factors such as labor force, urbanization, and economy are included in the evaluation.
Considering data availability, factors concerning environmental governance and policy interventions are selected as indicators of eco-sustainability, reconstructing the third stage as WEF-Eco. By comparing the efficiency differences of the new stage WEF-Eco with the original stage WEF, the interaction between W-E-F nexus and eco-sustainability, and the effectiveness of policies are assessed.
Based on two three-stage models, the overall efficiency values of W-E-F nexus and W-E-F nexus involving eco-sustainability are sorted separately to analyze regional heterogeneity and synergy.
A case study of 13 cities in a specific province (Jiangsu Province in China) is conducted, with calculations and visualizations.
The remaining sections are structured as follows. A review of research methods for W-E-F nexus and the current status of Network DEA (NDEA) model research are presented in Section 2, followed by a discussion of gaps in literature. Section 3 contains the construction of a three-stage dual-boundary network DEA (TD-NDEA) model based on W-E-F nexus. Section 4 is the empirical study for the 13 selected cities from Jiangsu Province in China, where comprehensive indicators of W-E-F nexus and eco-sustainability are investigated, and two types of efficiency assessments and analysis of temporal-spatial differences are performed. In Section 5, based on the findings from the case study, the main conclusion is drawn, and study limitations and future prospects are provided.
2. LITERATURE REVIEW
2.1. Methods and Tools for W-E-F Nexus Modeling
Since the Bonn conference in 2011 promoted the W-E-F relationship approach to international sustainable development discussions, the W-E-F nexus has attracted worldwide attention [4,5]. Abundant works have been published, focusing on the quantitative modeling analysis or evaluation of W-E-F nexus on a global, national, basin, and city scale.
Zhang et al. [6] summarized nexus research questions into three themes: internal relationship analysis, external impact analysis, and nexus system evaluation. And eight nexus modeling approaches were generalized, including multidisciplinary and diversified methods and tools, which can be roughly divided into three categories, namely quantification of resource-environment footprint, evaluation and system simulation, and optimization decision-making [7,8].
Among them, the evaluation and system simulation methods can be generally further divided into three categories: comprehensive index system (IS), system dynamics (SD), and network analysis (NA). For instance, Guan [9] constructed a hierarchical evaluation IS from the perspective of food security and assessed the food security capabilities of various provinces. Li et al. [10] used SD to simulate Beijing's W-E-F interacted systems and predict the trends. Duan and Chen [11] employed NA to study the global dependence of countries on water and energy trade.
2.2. DEA, NDEA, and Optimistic–Pessimistic DEA Model
The DEA method is used to evaluate the relative effectiveness of the DMUs based on multiple inputs and multiple outputs. It was first proposed by Charnes et al. [12] and a Charnes-Cooper-Rhodes (CCR) model was constructed in their paper. Later, Banker et al. [13] proposed the Banker-Charnes-Cooper (BCC) model. Since then, DEA has been continuously developed. Villanueva-Cantillo and Munoz-Marquez [14] presented a methodology based on Monte Carlo simulations and bootstrapping for calculating the critical values of relevance measures in variable selection methods in DEA. Chen et al. [15] developed several models to deal with the challenge in DEA that how to evaluate the performance of DMUs with fixed-sum outputs by considering all feasible equilibrium efficient frontiers. Zhang et al. [16] introduce one special performance evaluation criterion for the EV. In recent years, DEA has been widely used to measure environmental efficiency, such as assessing energy and carbon dioxide emissions efficiency in major economies [17]. Akbarian [18] proposed a new method, which is to calculate the overall profit Malmquist productivity index (MPI) under uncertain information. It has also been used to calculate various other efficiencies. Kedo and Luka [19] analyzed small food and drink producers from selected countries in the European Union and estimate their financial efficiency using raw financial variables instead of financial ratios. Ibrahim et al. [20] considered indicators that were composite of the interconnections to estimate socioecological system (SES) efficiency, and employed the nonparametric benchmarking order-α model, from DEA, to estimate SES efficiency and alleviate possible intricacies.
Because traditional DEA only regards decision making unit as a whole “black box” to calculate efficiency, it gradually fails to meet the needs of social problems research. Among diverse advanced models evolved from DEA, the network DEA (NDEA) model can be used to consider more internal information to measure the overall system efficiency as well as the efficiency of each subsystem [21]. Hundreds of works that discuss network DEA have been published since Charnes et al. [22]. Some researchers develop models to measure efficiencies under specified conditions. Fare and Grosskopf [23] first applied network DEA to the calculation of organizational efficiency. Kao and Hwang [24] modified the traditional DEA model by considering the sequence relationship of the two sub-processes in the entire process, decomposing the efficiency of the entire process into the product of the efficiency of the two subprocesses, and proposed a two-stage network DEA model and applied it to nonlife insurance companies in Taiwan. Tone and Tsutsui [25] believe that one of the shortcomings of the traditional DEA model is that it ignores intermediate products or link activities. A slacks-based network DEA model, called Network SBM is proposed, that can deal with intermediate products formally. Cook et al. [26] extended the NDEA model to study the internal interaction of the DMUs, measure the efficiency of systems with serial and parallel architectures, and calculate the optimistic efficiency. Some examine the properties possessed by certain models, like Lim and Zhu [27] developed an axiomatic derivation of some two-stage NDEA models focusing on the basic two-stage serial process structure. And others apply existing models to solve real-world problems, like Yu and Lin [28] adopted NDEA to evaluate the service effectiveness and technical effectiveness of the railway network. Kalantary and Saen [29] introduced an NDEA model to assess the sustainability of supply chains in multiple periods. Yu et al. [30] examined innovation performance of high-tech companies in China. Chang et al. [31] developed a nested dynamic network DEA models to fully and simultaneously measure the multi-period efficiency of a portfolio and its comprised financial assets.
The classic DEA model is compared with the “optimal” unit to obtain relative efficiency, that is, when the output remains the same, the input can be reduced in proportion to the maximum extent. This efficiency is the optimistic efficiency which located on the effective front surface when the efficiency value is 1. Moreover, another approach is proposed that measures the performances of DMUs from the pessimistic view [32]. In the input-oriented model, pessimistic efficiency is the maximum extent that input can increase proportionally while output remains the same. That is, the efficiency value obtained by comparing with the “worst” decision-making unit. When the efficiency value is 1, it is on the invalid frontier. The dual frontier data envelopment method is a measurement method that considers both optimistic and pessimistic efficiency. The dual frontier is composed of valid frontiers and invalid frontiers. Wang et al. [33] proposed geometric average efficiency, which combined optimistic and pessimistic efficiency for comprehensive analysis, that improved the dual-frontier data envelopment method. At present, compared with the traditional DEA method, the dual frontier data envelopment method has not been widely used. For example, Wang and Chin [34] used the dual frontier data envelopment method to select high-tech industries. Wang and Lan [35] used the dual frontier data envelopment method to measure the MPI. Zhou et al. [36] used a method considering the optimistic–pessimistic attitude of decision makers to solute a novel dynamic network DEA model. Assani et al. [37] introduced a double frontier approach to integrate both optimistic and pessimistic scale efficiencies' viewpoints in one single scale efficiency term, which will be more realistic and has benchmarking preferences. Amirteimoori et al. [38] analyzed the efficiency in the two-stage fuzzy DEA from both optimistic and pessimistic viewpoints.
To sum up, we can find that network DEA is more scientific in the production process with multiple subsystems. Using network DEA model to measure its efficiency can be closer to the real situation, and it is also helpful for managers to take more targeted measures to improve the overall operation efficiency. Therefore, this paper makes improvement on the basis of network DEA method.
2.3. Gaps in Literature
Literature review in Sections 2.1 and 2.2 shows that although the concept development of W-E-F nexus is becoming more mature, the focus of the research methods used is quite different because of the different centrality of their nexus relationship research. For instance, Zaman et al. [39] employed a panel random effect model to examine the non-linear relationship between W-E-F resources and air pollutants in a panel of 19 selected SSA countries. Landa-Cansigno et al. [40] evaluated the metabolism-based performance of a number of centralized and decentralized water reuse strategies and their impact on integrated urban water systems (UWS) based on the nexus of water-energy-pollution.
Overall, among all the methods concerning evaluation, the most widely used is still the indicator system (IS) method. It regards W-E-F as an integrated system, weighs the indicators, and calculates the coupling degree and coupling coordination degree of integrated systems. This method makes the W-E-F nexus a “black box,” that is, the “W-E-F nexus” is considered as a whole, and it is difficult to further analyze the coupling degree of its internal subsystems [25,41].
At present, there are fewer studies on applying DEA method to the evaluation of W-E-F nexus's efficiency. Zhang and Xu [42] evaluated the W-F and WF-E coupling efficiency in different regions of China from the static and dynamic perspectives based on the traditional BCC, CCR model, and Malmquist index model. Han et al. [43] applied the multiplicative environmental DEA (ME-DEA) model to evaluate the efficiency of W-E-F nexus of 30 provinces in China from 2005 to 2017 and analyzed its coupling effect. However, when the evaluation is performed based on the traditional DEA model, it still cannot effectively deal with the “black box” problem. In comparison, the network DEA (NDEA) model, which can incorporate more internal information, is sufficiently superior in evaluating the W-E-F nexus. This paper, for the first time, applies the network DEA (NDEA) model to the efficiency evaluation of W-E-F nexus, and builds a three-stage dual-boundary network DEA (TD-NDEA) model based on the dual frontier theory. Under this model, the “black box” of the W-E-F nexus will be decomposed and some external factors will also be incorporated in the assessment. In addition, this paper will select relevant indicators for assessing eco-sustainability, to reshape the third stage as WEF-Eco, and compare policy impacts and efficiency differences. Meanwhile, the regional heterogeneity and synergy of the case study object (Jiangsu Province) will be analyzed from the temporal-spatial dimensions.
These new attempts will promote the study of the mutual adaptation mechanism between W-E-F nexus and ecological sustainability in socioeconomic systems in the context of prominent resource and environmental constraints, thereby promoting integrated management and providing a more powerful theoretical reference.
3. PROPOSED MODEL
3.1. Network Structure
According to the dual frontier theory of Wang and Chin [34], the optimistic efficiency is used to evaluate the DMUs with a given high-efficiency frontier, which is the best relative efficiency, while the pessimistic efficiency is taken to evaluate the DMUs with a given low-efficiency boundary, which is the worst relative efficiency. The traditional DEA model is used to evaluate the optimistic efficiency of the DMUs only [44]. Optimistic and pessimistic efficiency models have different measurement methods and analysis angles, so the ranking results of efficiency are mostly different. Compared with the traditional DEA efficiency, the models which considering both optimistic and pessimistic efficiency increase the objectivity and reliability of conclusions. Therefore, it is more accurate to evaluate the overall efficiency based on dual-boundary.
Meanwhile, as mentioned in Section 2.2, Cook et al. [26] extended the NDEA model to study the internal interaction of the DMUs and measure the efficiency of systems with serial and parallel architectures. Li et al. [45] extended the network DEA model which take all the output of the previous stage as the input of the next stage (Liang et al. [46]), and considered the two-stage network DEA model of additional investment. Yu et al. [30] also used similar structures to solve practical problems. This model has strong applicability and certain advantages in studying the efficiency evaluation of W-E-F nexus.
Hence, before constructing a dual-boundary efficiency calculation model, based on the NDEA model of Cook et al. [26], firstly, this paper constructs a three-stage network structure of W-E-F nexus, as shown in Figure 1, including “W-E,” “WE-F,” and “WEF” respectively.
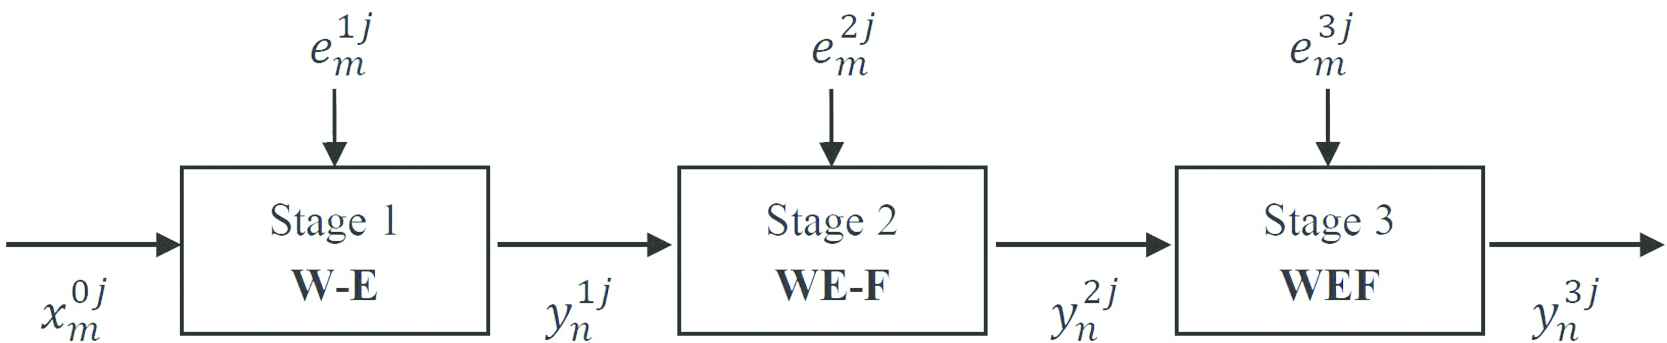
The 3-stage network structure of W-E-F nexus.
Using this network structure, the “W-E-F nexus” is not regarded as a whole any more. To explore the specific coupling relationship by measuring the efficiencies values of different stages, water resources is supposed as the basic resources in the first stage, that is, the input-output efficiency of water-energy (W-E) can be measured in Stage 1. And then, by gradually adding indicators, when it comes to Stage 2, the input–output efficiency of water&energy-food (WE-F) can be measured (contains stage 1). Some more comprehensive indicators concerning external factors can be added progressively as well.
Now, suppose given a set of J DMUs, j = 1, 2, …, J. Let p represent the three stages, p = 1, 2, 3. Let M0 represent the number of initial inputs to enter the first stage, and Mp (p = 1, 2, 3) the number of external inputs to enter the stage p. Np (p = 1, 2, 3) is the number of output variables leaving the pth stage. For convenience, symbols used in this paper are arranged in Table 1.
| Notations | Definitions |
|---|---|
| The mth initial input (m = 1, …, M0) of DMUj that enters the first stage | |
| The mth external input (m = 1, …, Mp) of DMUj that enters the pth stage (p = 1, 2, 3) | |
| The nth outputs (n = 1, …, Np) of DMUj that leaves the pth stage (p = 1, 2, 3) | |
| The weight of |
|
| The weight of |
|
| The weight of |
|
| ρj | The optimistic efficiency of DMUj |
| The pessimistic efficiency of DMUj | |
| θj | The overall efficiency of DMUj |
The planning and control components.
3.2. Efficiency Scores
In the NDEA model proposed by Cook et al. [26], the optimistic efficiency value is calculated based on the dual frontier theory developed by Wang and Chin [34]. This paper uses the same method to calculate the optimistic efficiency of the three-stage network structure of W-E-F nexus. First, the efficiency values of the three stages should be weighted, where the efficiency value of each stage is the ratio of the weighted output to the weighted input of the stage, and the weighted value of each stage is the ratio of the “weighted input of the stage” and the “weighted input of all stages.” Then, the formula for calculating the optimistic efficiency of DMUj is presented as follows:
The numerator represents the total output of the three stages, the denominator is the sum of the initial input of the first stage, the “external input” of the three stages, and the output of the first two stages (called “new input”). When it comes to the third stage, the outputs of the first and second stages are both counted as “new inputs.”
Considering the process depicted in Figure 3 in Section 4.2, we use it as an example to illustrate the sub-stage efficiency and weighting plan more clearly.
First, the stage efficiencies can be expressed as follows:
Note that the total (weighted) input across all components is given by the sum of the denominators of ρ1 through ρ3, namely,
Now express the ωp as
With this, the overall network efficiency ratio is given by
The above formula is converted using the Charnes-Cooper transformation in DEA theory, so that the target value of ρj is obtained under the corresponding constraints. Therefore, the optimization model for calculating the optimistic efficiency of the kth DMU is shown in Model (2):
When
Similarly, Badiedede et al. [44] extended the method proposed by Cook et al. [26] based on the theory of Wang and Chin [34], and proposed a calculation method for the pessimistic efficiency in the NDEA model. This paper will use an extended method to calculate the pessimistic efficiency under the three-stage network structure of the W-E-F nexus. The optimization model for calculating the pessimistic efficiency of the kth DMU is shown in Model (3):
When
4. CASE STUDY OF JIANGSU PROVINCE
4.1. Overview of the Area
Due to differences in the level of economic development, resource endowments, space, and climate, it is necessary for provinces and cities to formulate effective measures tailored to their local conditions. As a typical region with developed economy and scarce resources in China, Jiangsu Province was selected by us as the research object, and we will explore it from a smaller city perspective.
The 13 selected cities in Jiangsu, China are Nanjing, Wuxi, Changzhou, Suzhou, Zhenjiang, Nantong, Yangzhou, Taizhou, Xuzhou, Lianyungang, Huai'an, Yancheng, and Suqian, and they will be used as the specific examples for assessing W-E-F nexus and eco-sustainability.
Jiangsu Province, located on the eastern coast of mainland China, is among the front-runners in China in terms of per capita GDP, comprehensive competitiveness, regional development and livelihood Index (DLI). Meanwhile, its high population density (751 people per square km, ranked 4th among all the provinces in China) and urbanization (69.61%, compared to 59.58% nationwide) expose it to huge water, energy, and food demand issues. According to the “Jiangsu Statistical Yearbook 2019,” in 2018, the total water resources of Jiangsu Province was 37.84 billion m3, the average water production modulus was 371,000 m3/km2, and the total water consumption was 46.02 billion m3. Regional differences in water resources still need to be continuously coordinated. At the same time, as a major energy-consuming province, primary energy production in 2017 was 27.104 million tons of standard coal, while the total energy consumption was 314.304 million tons of standard coal, of which industrial energy consumption accounted for about 75%. In addition, as the main grain production area, the total sown area of crops in Jiangsu Province reaches 7520.23 thousand hectares, and the sown area of grain crops accounts for 72.82%, forcing the land space to carry a large load.
Moreover, according to the data released by the Department of Ecology and Environment of Jiangsu Province, from the weighted calculations of the biological abundance index, vegetation cover index, water network density index, land degradation index, and environmental quality index, the resulting eco-environment status index has fluctuated around 65 (maximum 100) for ten years, which means that the province's ecological environment continues under pressure.
In the following sections, indicators of W-E-F nexus and W-E-F nexus involving eco-sustainability will be comprehensively elaborated. For the 13 selected cities in Jiangsu Province, efficiency evaluation and temporal-spatial analysis will be performed by region and by sector.
4.2. Data and Variables
As mentioned in Section 2.3, there are limited studies on applying DEA method to evaluate the efficiency of W-E-F nexus. Based on the relevant literature analysis of the selection of the indicators, previous relevant literature has been checked as comprehensive as possible. Indicators related to water resources mostly includes “Total water use,” “Total water resources,” “Irrigable cultivated area,” etc. Indicators related to energy resources mostly includes “Total energy consumption,” “Total energy production,” “Fixed industrial investment,” etc. Indicators related to food mostly includes “Grain yield,” “Number of agricultural employees,” “Intermediate consumption of agriculture, forestry, animal, husbandry, and fishery,” etc. And when considering more internal or external factors related to W-E-F nexus, other indicators as well are mostly included, like “Total population at year-end,” “Real capital stock,” “Real gross Regional Product (GDP),” etc.
Hence, according to the three-stage network structure of the W-E-F nexus constructed in Section 3, for the case of Jiangsu Province, this paper further revised and added evaluation indicators which were mainly used in Zhang and Xu [42], Han et al. [43]. Incorporating the scientificity and availability of indicator data, this paper selects evaluation indicators for the three stages W-E, WE-F, and WEF respectively, as summarized ultimately in Table 2.
| Stage | Variable | Unit | Notation |
|---|---|---|---|
| Total water resources | 100 million cubic meters | ||
| Industrial assets | 100 million yuan | ||
| W-E | Industrial water consumption | 10,000 tons | |
| Number of industrial employees | 10,000 people | ||
| Energy Production | 10,000 tons of standard coal | ||
| Agricultural machinery power | 10,000 kilowatts | ||
| WE-F | Application of agricultural fertilizer | 10,000 tons | |
| Number of agricultural employees | 10,000 people | ||
| Grain yield | 10,000 tons | ||
| WEF | Urbanization | % | |
| Daily sewage treatment capacity | 10,000 tons | ||
| WEF WEF-Eco | Daily harmless chemical plant processing capacity | Ton | |
| Environment protection budget expenditure | 100 million yuan | ||
| Gross domestic product (GDP) | 100 million yuan |
Selected variables.
Energy development requires water, and the purification and dispatch of water resources also requires energy. Food production is inseparable from water and energy in every link from irrigation to distribution. The three are interdependent and closely linked. As the unity of production and consumption, human beings are the main body of the sustainable development system and the ultimate goal of optimizing resource allocation and improving the ecological environment. Therefore, the paper incorporated “people” as the core element into each stage of “W-E-F,” and selected GDP as the final output of the evaluation of W-E-F nexus. “Total water resources” was used as the initial input, “Energy production,” “Grain yield,” and GDP were used as the output of each stage and the “new input” of the next stage. They represent the most direct resource input and output of water, energy and food. At the same time, considering the other external influences of the W-E stage, three indicators related to energy production have been added, including “Industrial assets,” “Industrial water consumption,” “Number of industrial employees.” Then, in the WE-F stage with food output as the output object, three “agricultural” indicators related to the food production process, “Agricultural machinery power,” “Application of agricultural fertilizer,” and “Number of agricultural employees” were added. The indicators represent energy products such as pesticides and fertilizers that are directly consumed in the food production stage. The variables (initial input, external input, and output) involved in the first stage are all calculated as the “new input” of the second stage, which means that the production of food needs to consume water resources. The operation of the consumed water resources requires energy to provide power, such as the electric energy consumed by the electromechanical pump and the diesel consumed by the diesel engine during the drainage and irrigation process. This part can be called the indirect energy consumption of food. At the same time, the processing of energy products such as pesticides and fertilizers used to produce food requires water resources. This part can be called indirect water use for food. Finally, when it comes to the third stage (WEF or WEF-Eco), the variables (initial input, external input, and output) involved in the first and second stages are all calculated as “new input.” The actual input of the third stage is the variable called “new input” and “external input” that enters the third stage.
The difference from the third stage of “WEF” is that, in addition to incorporating external factors such as labor force, urbanization, and economy into the assessment, this paper also uses three indicators of “Daily sewage treatment capacity” (

The 3-stage network structure of W-E-F nexus.
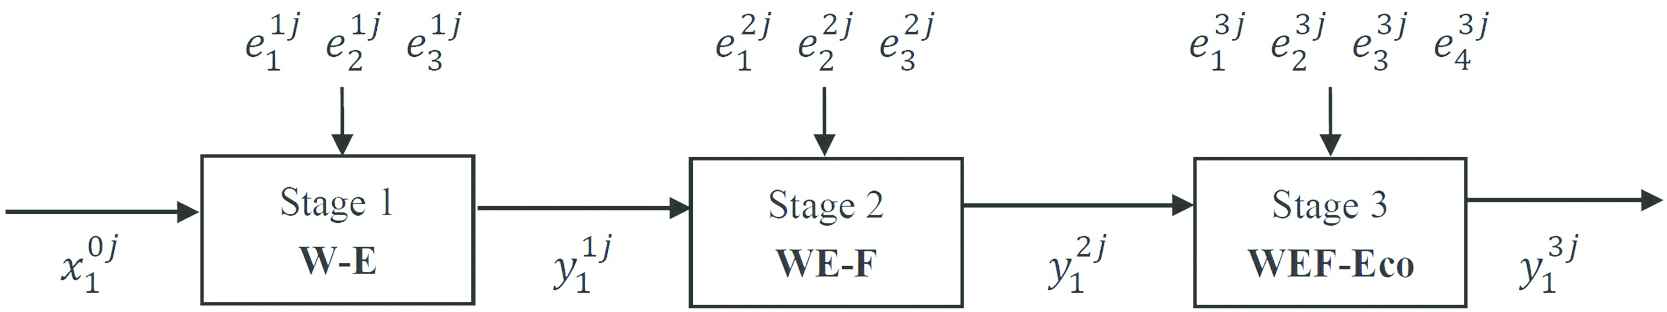
The 3-stage network structure of W-E-F nexus involving eco-sustainability.
The time span of each indicator is from 2008 to 2018, and the data sources are “China Statistical Yearbook,” “Jiangsu Statistical Yearbook,” “Jiangsu Water Resources Bulletin,” and statistical yearbooks of 13 cities.
Among them, the data processing operations on the relevant variables are summarized in Table 3. After data collation and verification, missing or abnormal data accounted for only 0.2% of all data. For this extremely rare data, the results of regression interpolation are used to fill or replace it.
| Variable | Notation | Data Processing |
|---|---|---|
| Industrial water consumption | Use the data of “produced water consumption” | |
| Number of industrial employees | Use the data of “number of employees of secondary industry” | |
| Energy production | Use the total data of “the total gas supply of coal gas, natural gas and liquefied petroleum gas,” and convert the unit into 10,000 tons of standard coal | |
| Number of agricultural employees | Use the data of “number of employees of primary industry” | |
| Industrial assets | Use the consumer price index (CPI) for deflation to eliminate the effects of inflation | |
| Environment protection budget expenditure | ||
| Gross domestic product (GDP) |
Data processing operations on the relevant variables.
4.3. Temporal-Spatial Analysis of the Efficiency
For both network structures, the three-stage dual-boundary network DEA (TD-NDEA) model is applied and programed with MATLAB R2018a to obtain the efficiency of W-E-F nexus and the efficiency of W-E-F nexus to examine eco-sustainability of Jiangsu Province. The following is the analysis of the efficiency from the temporal-spatial dimensions.
4.3.1. Efficiency of the W-E-F nexus
Following the general division method, Jiangsu Province is divided into “the south of Jiangsu” (Nanjing, Wuxi, Changzhou, Suzhou, Zhenjiang), “the central of Jiangsu” (Nantong, Yangzhou, Taizhou), and “the north of Jiangsu” (Xuzhou, Lianyungang, Huai'an, Yancheng, Suqian). The results of the overall efficiency evaluation of W-E-F nexus in the 13 selected cities from 2008 to 2018 are shown in Table 4 below.
| 2008 | 2009 | 2010 | 2011 | 2012 | 2013 | 2014 | 2015 | 2016 | 2017 | 2018 | Average | |
|---|---|---|---|---|---|---|---|---|---|---|---|---|
| South | 0.679 | 0.68 | 0.68 | 0.671 | 0.677 | 0.676 | 0.674 | 0.674 | 0.672 | 0.67 | 0.669 | 0.675 |
| Nanjing | 0.61 | 0.594 | 0.605 | 0.6 | 0.616 | 0.625 | 0.636 | 0.657 | 0.655 | 0.653 | 0.667 | 0.629 |
| Wuxi | 0.776 | 0.769 | 0.759 | 0.752 | 0.764 | 0.751 | 0.721 | 0.708 | 0.702 | 0.712 | 0.713 | 0.739 |
| Changzhou | 0.53 | 0.527 | 0.53 | 0.515 | 0.503 | 0.502 | 0.51 | 0.502 | 0.508 | 0.505 | 0.502 | 0.512 |
| Suzhou | 1.09 | 1.092 | 1.08 | 1.065 | 1.068 | 1.069 | 1.06 | 1.062 | 1.057 | 1.06 | 1.05 | 1.068 |
| Zhenjiang | 0.388 | 0.42 | 0.427 | 0.423 | 0.432 | 0.432 | 0.444 | 0.439 | 0.439 | 0.421 | 0.412 | 0.425 |
| Central | 0.468 | 0.463 | 0.461 | 0.466 | 0.458 | 0.46 | 0.472 | 0.477 | 0.483 | 0.484 | 0.478 | 0.47 |
| Nantong | 0.537 | 0.525 | 0.53 | 0.518 | 0.492 | 0.491 | 0.51 | 0.517 | 0.528 | 0.53 | 0.529 | 0.519 |
| Yangzhou | 0.443 | 0.441 | 0.435 | 0.435 | 0.434 | 0.437 | 0.448 | 0.447 | 0.451 | 0.45 | 0.444 | 0.442 |
| Taizhou | 0.425 | 0.424 | 0.418 | 0.445 | 0.448 | 0.452 | 0.458 | 0.468 | 0.471 | 0.471 | 0.46 | 0.449 |
| North | 0.358 | 0.363 | 0.361 | 0.373 | 0.371 | 0.372 | 0.373 | 0.372 | 0.373 | 0.371 | 0.374 | 0.369 |
| Xuzhou | 0.402 | 0.391 | 0.362 | 0.36 | 0.363 | 0.366 | 0.375 | 0.378 | 0.381 | 0.376 | 0.356 | 0.374 |
| Lianyungang | 0.32 | 0.312 | 0.317 | 0.317 | 0.325 | 0.321 | 0.319 | 0.316 | 0.319 | 0.323 | 0.361 | 0.323 |
| Huai'an | 0.363 | 0.362 | 0.344 | 0.39 | 0.378 | 0.375 | 0.378 | 0.366 | 0.365 | 0.355 | 0.365 | 0.367 |
| Yancheng | 0.403 | 0.426 | 0.449 | 0.447 | 0.449 | 0.449 | 0.449 | 0.439 | 0.441 | 0.437 | 0.446 | 0.44 |
| Suqian | 0.306 | 0.324 | 0.334 | 0.352 | 0.34 | 0.348 | 0.342 | 0.359 | 0.356 | 0.363 | 0.342 | 0.342 |
Efficiency scores of Jiangsu's W-E-F nexus.
From the last column in Table 4, the efficiency of W-E-F nexus in Jiangsu Province from 2008 to 2018 has clear regional heterogeneity, 0.675 for the south, 0.470 for the central, and 0.369 for the north. Among the five cities in the south, except for Suzhou's efficiency (1.068), which is relatively high, the efficiency of each city has fluctuated within the range of 0.4~0.8 over the years. The average efficiency of Changzhou (0.512) and Zhenjiang (0.425) is relatively low. The scores of the three cities in the central areas have fluctuated within the range of 0.4~0.6 over the years, while the scores of the three cities in the north of Jiangsu have fluctuated within the range of 0.3~0.4 over the years.
In order to further research the specific reasons for the above efficiency differences and the internal relationship of the W-E-F nexus, we separately analyzed the efficiency of three stages in the three regions in Jiangsu. In view of the small fluctuations in the efficiency scores of cities in the past 11 years, the data is relatively stable. In the following detailed analysis of regional heterogeneity, the total average score of 11 years was used as the city's efficiency at stage 1, stage 2, stage 3 separately (i.e., such as the calculation method shown as the last column of Table 3). The optimistic efficiency (OE), pessimistic efficiency (PE), and overall efficiency averages of the three stages of the W-E-F nexus in each city during 2008~2018 are summarized in Table 5 below.
| Stage1(W-E) |
Stage2(WE-F) |
Stage3(WEF) |
|||||||
|---|---|---|---|---|---|---|---|---|---|
| OE | PE | Overall | OE | PE | Overall | OE | PE | Overall | |
| South | 0.867 | 10.321 | 0.679 | 0.796 | 1.205 | 0.503 | 0.628 | 1.181 | 0.6 |
| Nanjing | 1 | 13.146 | 0.664 | 0.686 | 1 | 0.426 | 0.589 | 1 | 0.54 |
| Wuxi | 0.803 | 8.615 | 0.626 | 0.712 | 1.09 | 0.452 | 0.919 | 1.173 | 0.757 |
| Changzhou | 0.919 | 9.746 | 0.819 | 0.843 | 1.276 | 0.532 | 0.383 | 1.157 | 0.459 |
| Suzhou | 0.834 | 10.64 | 0.609 | 0.768 | 1.089 | 0.47 | 1 | 1.393 | 0.852 |
| Zhenjiang | 0.779 | 9.458 | 0.676 | 0.974 | 1.568 | 0.635 | 0.25 | 1.18 | 0.39 |
| Central | 0.522 | 3.243 | 0.377 | 0.957 | 1.696 | 0.654 | 0.369 | 1.616 | 0.549 |
| Nantong | 0.269 | 3.141 | 0.237 | 0.871 | 1.378 | 0.562 | 0.494 | 2.089 | 0.718 |
| Yangzhou | 0.528 | 5.001 | 0.427 | 1 | 1.858 | 0.701 | 0.316 | 1.289 | 0.449 |
| Taizhou | 0.77 | 1.588 | 0.467 | 1 | 1.852 | 0.7 | 0.298 | 1.47 | 0.479 |
| North | 0.633 | 4.136 | 0.415 | 0.8 | 1.278 | 0.519 | 0.277 | 1.127 | 0.394 |
| Xuzhou | 0.449 | 4.638 | 0.366 | 0.601 | 1 | 0.398 | 0.432 | 1.483 | 0.554 |
| Lianyungang | 0.528 | 5.063 | 0.419 | 0.757 | 1.181 | 0.485 | 0.184 | 1 | 0.316 |
| Huai'an | 0.636 | 3.871 | 0.39 | 0.921 | 1.442 | 0.59 | 0.231 | 1.001 | 0.342 |
| Yancheng | 0.906 | 3.479 | 0.481 | 0.995 | 1.647 | 0.657 | 0.351 | 1.152 | 0.441 |
| Suqian | 0.647 | 3.63 | 0.423 | 0.728 | 1.117 | 0.463 | 0.187 | 1 | 0.318 |
Efficiency scores of Jiangsu's W-E-F nexus.
In Stage 1 (the W-E efficiency evaluation), each city's distribution of the score is shown in Figure 4. In the south, Nanjing, Zhenjiang, and Changzhou have higher efficiency scores. Although the level of input–output indicators related water and energy is low in Zhenjiang and Changzhou, the coordination of W-E is high. In the central, Yangzhou and Taizhou achieves relatively high levels of “Energy production” with relatively low water and industrial inputs. In the north, Yancheng and Suqian have higher efficiency. Yancheng's “Industrial water consumption” rate is relatively low, thus the coordination of W-E is relatively high. Suqian's level of input–output indicators related water and energy are centered, but the coordination of W-E remains high.
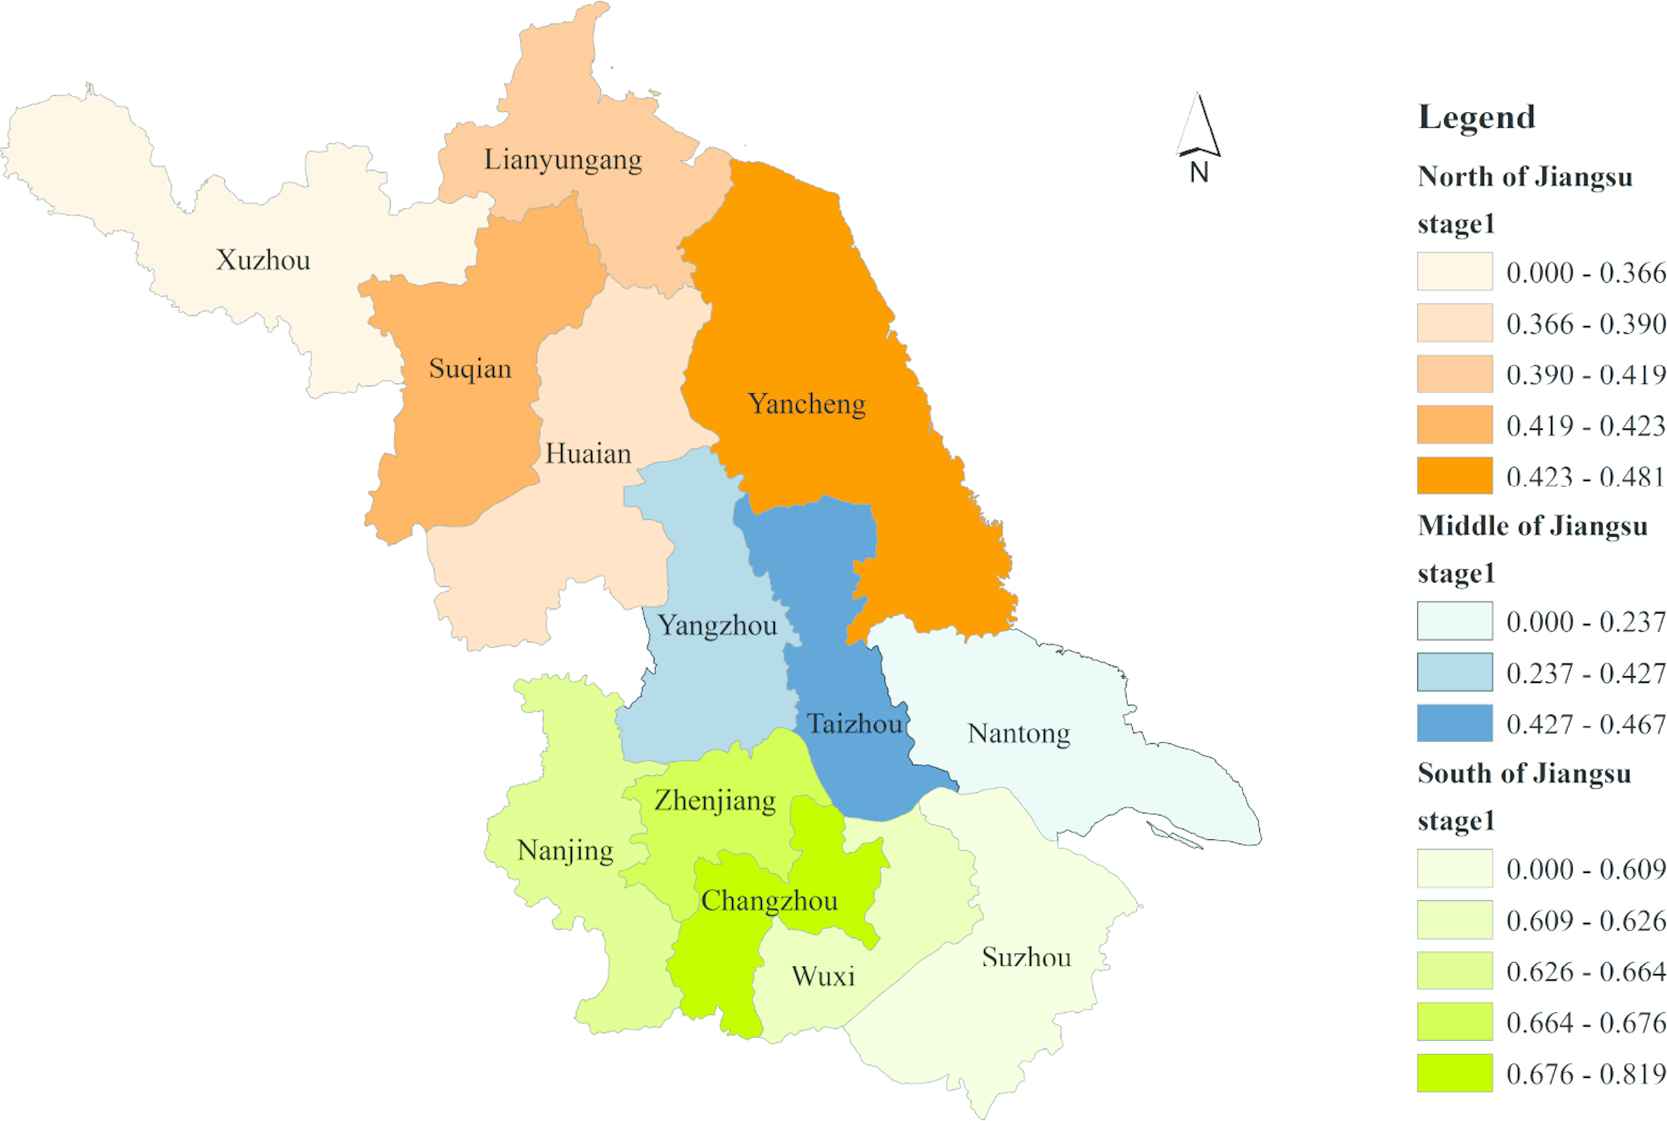
Efficiency scores' spatial distribution of stage1 (W-E).
In Stage 2 (the WE-F efficiency evaluation), each city's distribution of the score is shown in Figure 5. After joining the grain stage, the efficiency in the south declines, while the efficiency in central and northern increases significantly. In the south, Zhenjiang and Changzhou have high-efficiency scores. Although Nanjing's “Agricultural machinery power,” “Number of agricultural employees,” and “Grain yield” are relatively high, the efficiency declines, and Suzhou's efficiency rises. In the central, the efficiency of Yangzhou and Taizhou remains high. In the north, Yancheng maintains a high efficiency, while Suqian's score declines. Although the level of indicators related water, energy, and food are relatively low in Huai'an, the coordination of WE-F is positive.

Efficiency scores' spatial distribution of stage2 (WE-F).
In Stage 3 (the WEF efficiency evaluation), each city's distribution of the score is shown in Figure 6. After adding the factors of the “Urbanization,” the efficiency in the southern increases, while the efficiency in the central and northern declines. In addition, the efficiency of each city in the three regions vary greatly. In the south, the efficiencies of Zhenjiang and Changzhou drops significantly. In the central, Nantong improves the coordination of the WE-F nexus with a relatively high GDP. In the north, the relative levels of Yancheng, Suqian and Huai'an remains stable, and the scores of Xuzhou increase significantly.
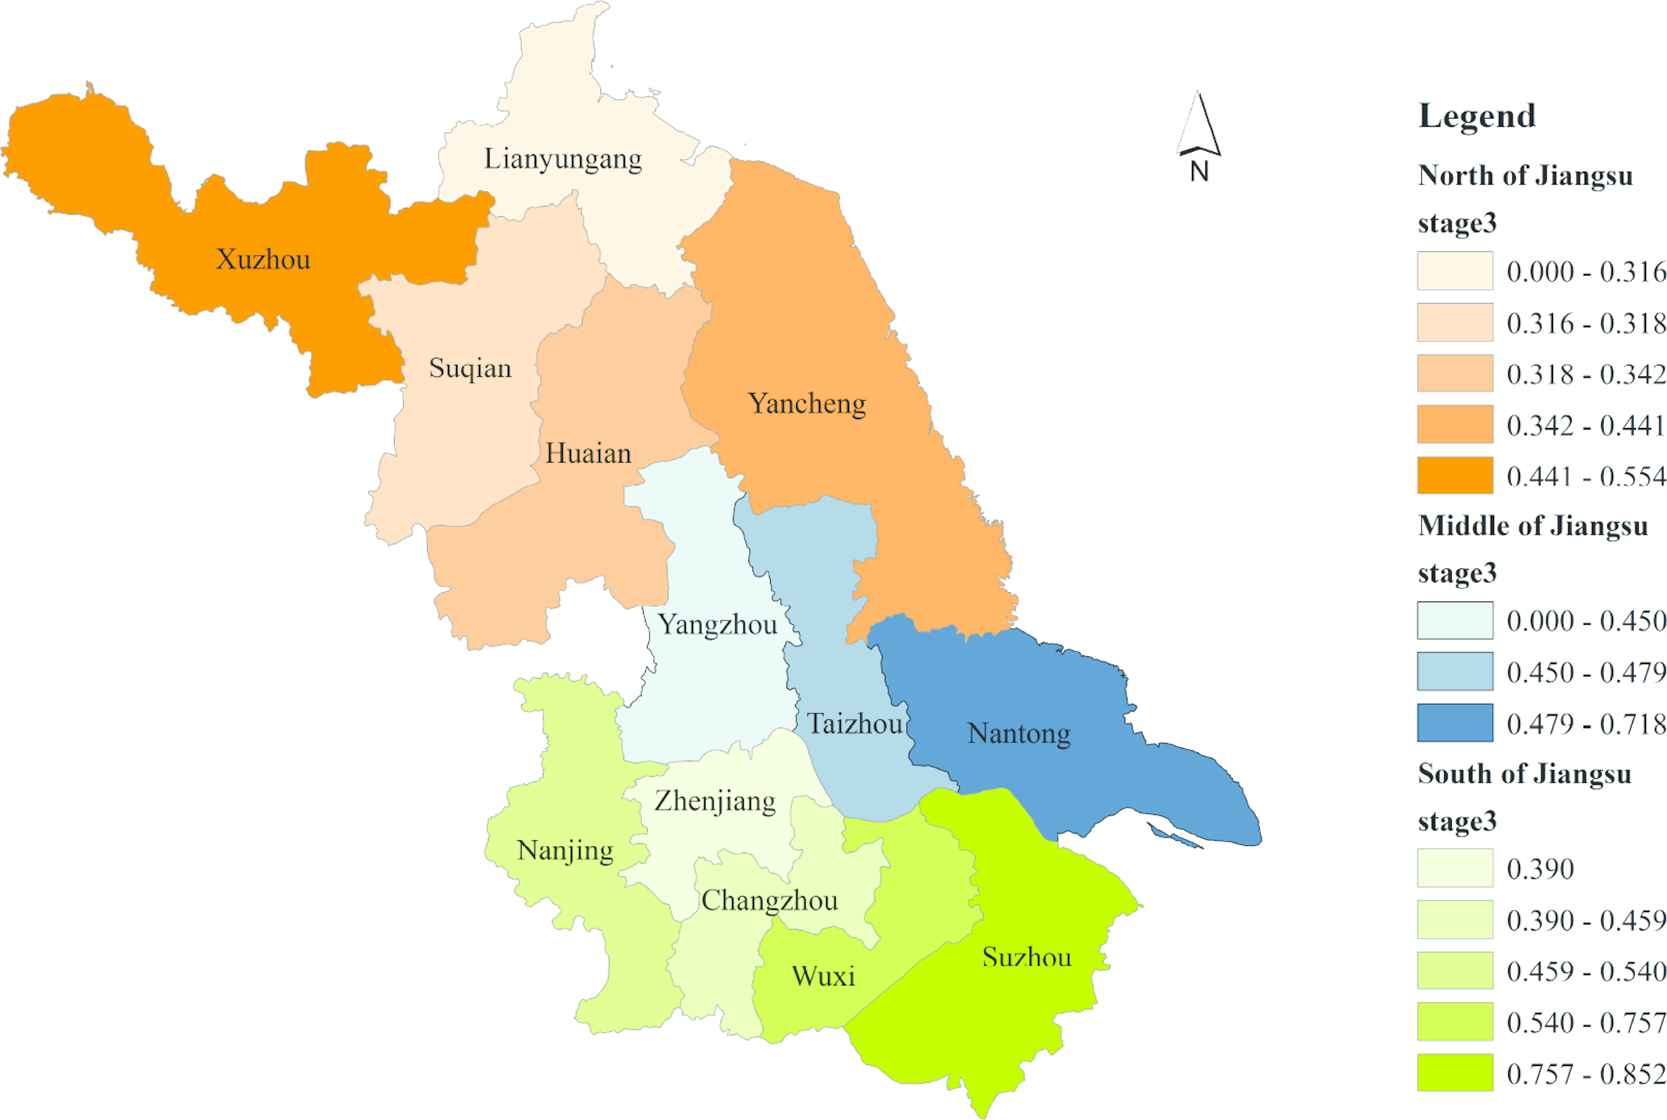
Efficiency scores' spatial distribution of stage3 (WEF).
To sum up, the industrial level of Southern Jiangsu is relatively high, and the coupling efficiency of the W-E stage is at the leading level. The agricultural development in Central and Northern Jiangsu is relatively good, and after joining the grain stage, the coupling efficiency of the WE-F stage improves. Compared with the number of employees, the impact of urbanization and economic development on the efficiency of W-E-F nexus is more remarkable, and it has a positive promotion trend. The three stages decomposed from the model provide an effective way to analyze the internal relationships of the W-E-F nexus in cities of the three major regions of Jiangsu.
4.3.2. Efficiency of the W-E-F nexus considering eco-sustainability
In this section, the second three-stage network structure will be analyzed, that is, the efficiency of W-E-F nexus considering eco-sustainability, so as to study its mutual adaptation mechanism in social and economic systems, and assess regional coevolution. In order to visually compare the results of the two efficiency scores, line charts are drawn below in Figure 7.
The line chart comparison of two efficiency scores.
From the temporal perspective, during 2008~2018, the efficiencies of W-E-F nexus in various cities were relatively stable, with a smaller fluctuation range. However, after adding the indicators regarding eco-sustainability, the fluctuation range became significantly larger. Efficiencies of Nanjing, Wuxi, Nantong, Taizhou, Xuzhou, and Yancheng have displayed significant downward trends in recent years, and the efficiencies of remaining cities have kept stable or increased in recent years.
From the spatial perspective, the efficiency of each city in the south narrowed from a wider range of 0.35~1.15 to a narrowed range of 0.35~0.7. Suzhou and Wuxi got much improved efficiency of W-E-F nexus with relatively leading GDPs, but after adding the indicators related eco-sustainability, the decline of the efficiency turns noticeable. In the central, the efficiencies of the three cities “Nantong, Yangzhou, Taizhou” increased from 0.4~0.55 to 0.5~0.8. The efficiencies of the three cities in the north all improved.
To sum up, as shown in Figure 8, in the south of Jiangsu, except for Zhenjiang and Changzhou, the W-E-F nexus efficiencies of the other three cities, with the eco-sustainability considered, decreases, while the efficiencies of all cities in central and northern Jiangsu increase. As a result, heterogeneity between regions has diminished and coordination has increased. Obviously, the improvement of the efficiency of W-E-F nexus by environmental governance and policy interventions has a positive overall promotion trend. After adding the “Daily sewage treatment capacity” (
The spatial distribution comparison of two efficiency scores.
5. CONCLUSIONS AND SUGGESTIONS
W-E-F nexus's complicated internal mechanism and related external influence factors lead to diverse research methods and tools. The network DEA (NDEA) model, as a derivative model of the non-parametric method DEA, makes it possible to consider more internal information and has sufficient superiority in dealing with the W-E-F nexus. This paper, for the first time, applies it to the efficiency evaluation of W-E-F nexus and builds a three-stage dual-boundary network DEA (TD-NDEA) model based on the dual frontier theory. Using the model, 13 selected cities in Jiangsu Province were chosen for calculating the efficiency of W-E-F nexus and W-E-F nexus involving eco-sustainability, and relevant results were analyzed separately. The main conclusions are outlined below, followed by carefully designed relevant policy recommendations:
The regional heterogeneity of the efficiency regarding Jiangsu's W-E-F nexus is clearly observed, and the overall trend exhibits a pattern of “the south of Jiangsu (0.675) > the central of Jiangsu (0.470) > the north of Jiangsu (0.369).” With its relatively high industrial level, the south of Jiangsu is at the leading level of the efficiency in the W-E stage. After joining the grain stage, the central and the north areas improved their efficiency in the WE-F stage with their relatively good agricultural development.
Regarding the adjustment of industrial layout, the south areas should strive to develop high-quality agriculture based on maintaining the level of industrialization. The central and north areas should, accelerate the development of modern agriculture, and cultivate the manufacturing industry according to the specific advantages of each city, so as to increase the coordination in the W-E stage, and further rationally allocate the proportion of industrial and agricultural water.
Compared with the number of employees in the industry, the impact of the urbanization and the level of economic development on efficiency of W-E-F nexus in Jiangsu Province are more noticeable, and the impact has a positive trend. By virtue of these two factors, Suzhou (0.852) and Wuxi (0.757) in the south, Nantong (0.718) in the central, and Xuzhou (0.554) in the north all improved their efficiency in the third stage.
Regarding the coordination of economic development, the south of Jiangsu should maintain its development speed and degree. The central and north areas should further increase the urbanization, form radiation and joint effects around individual cities with relatively advanced economy, and strengthen regional coordination to promote its efficiency of W-E-F nexus from the outside.
Environmental governance and policy intervention have a positive effect on the improvement of the efficiency of W-E-F nexus in Jiangsu Province. Ecological sustainable development planning accelerates the process of regional synergy. In the south areas, except for Zhenjiang and Changzhou, the efficiency of W-E-F nexus in the remaining three cities decreases, the efficiencies of all cities in the central and north areas increase, heterogeneity is reduced, and coordination is expanded.
Regarding the ecological sustainable development and planning decisions, departments concerning water conservancy, energy, and food resources should adhere to the strategy for maintaining eco-sustainability and reduce environmental pollution, like wastewater and exhaust emissions, solid waste generation, soil damage, etc. In addition to improving the indicators in this paper, it is necessary to continue ecological sustainable development planning based on the ecological environment status index issued by the Department of Ecology and Environment of Jiangsu.
In short, to a certain extent, this paper uses an innovative method to research the efficiency and mechanism of W-E-F nexus and eco-sustainability in Jiangsu Province under the background of prominent resource and environmental constraints. However, it is inevitable that this paper also has certain limitations:
The internal mechanism of W-E-F nexus often involves dynamic interactions, while the model constructed in this paper only considers the static aspects;
Among the external factors of the W-E-F nexus, natural factors such as precipitation and climate change have not been included, that is, the model constructed in this paper assumes that the inputs and outputs are deterministic, and ignores some fuzzy or random uncertain factors, as well as confounding variables.
In view of the above two limitations, further research in the future will focus on optimize by using dynamic models or combing with related theories of uncertainty and fuzzy measures.
CONFLICTS OF INTEREST
The authors declare they have no conflicts of interest.
AUTHORS' CONTRIBUTIONS
The study is guided by Zaiwu Gong and written by all authors. Jianxuan Li: contributed to model construction and made suggestions; Sijing Liu: contributed models and data analysis; Yizhao Zhao: performed the data analysis and wrote the manuscript; Guo Wei: helped perform chapter arrangements and English polish; Lihong Wang: did data query and data analysis.
ACKNOWLEDGMENTS
This work was supported by the National Natural Science Foundation of China (grant numbers 71971121, 71571104), NUIST-UoR International Research Institute, China, Spanish Ministry of Universities(grant number PID2019-103880RB-I00), the Graduate Research and Innovation Projects of Jiangsu Province (grant number KYCX19 1038), the Major Project Plan of Philosophy and Social Sciences Research in Jiangsu Universities (grant number 2018SJZDA038), and the impact of Weather Conditions on the Spread of Large-scale Influenza Virus, China (grant number 2020xtzx001).
REFERENCES
Cite this article
TY  - JOUR
AU  - Jianxuan Li
AU  - Sijing Liu
AU  - Yizhao Zhao
AU  - Zaiwu Gong
AU  - Guo Wei
AU  - Lihong Wang
PY  - 2021
DA  - 2021/05/05
TI  - Water-Energy-Food Nexus and Eco-Sustainability: A Three-Stage Dual-Boundary Network DEA Model for Evaluating Jiangsu Province in China
JO  - International Journal of Computational Intelligence Systems
SP  - 1501
EP  - 1515
VL  - 14
IS  - 1
SN  - 1875-6883
UR  - https://doi.org/10.2991/ijcis.d.210423.005
DO  - 10.2991/ijcis.d.210423.005
ID  - Li2021
ER  -