
Fuzzy Based Image Forensic Tool for Detection and Classification of Image Cloning
- DOI
- 10.1080/18756891.2016.1161364How to use a DOI?
- Keywords
- Image forensics; Cloning detection; Discrete Wavelet Transform (DWT); Discrete Cosine Transform (DCT); Singular Value Decomposition (SVD); Principal Component Analysis (PCA)
- Abstract
With the easy availability of image processing and image editing tools, the cases of forgery have been raised in the last few years. Now days it is very difficult for a viewer and judicial authorities to verify authenticate a digital image. Cloning or copy-move technique is widely used as forgery to conceal the desired object. To hide various type of forgery like Splicing (compositing), cloning (copy-move) etc., various post-forgery techniques like blurring, intensity variation, noise addition etc. are applied. To overcome the mentioned difficulty, a forgery detection tool must comprise of several detection algorithms which work collaboratively to detect all the possible alterations and provide a single decision. This paper presents a universal tool comprising PCA, DWT, DWT-DCT, DWT-DCT-SVD, DFT, DCT, DWT-DCT (QCD) techniques used for reduction, feature vector calculation and thus detecting forgery. Due to varied, erroneous, heterogeneous output of different reduction methods, it is very difficult to recognize the pre-processing done with available various classification systems. A fuzzy inference system has been developed to authenticate, find extend of forgery, parameters of forged area, robustness and accuracy of all the 7 detection tools, and the type of processing done on tempered image. Experimental results have shown that our classification system achieves accuracy of 94.12% as regards subjection to transformations like Blurring, Intensity Variation and Gaussian Noise Addition, JPEG compression, normal forgery (other random transformations). Two different membership functions are taken in this fuzzy system and different if-then rules are defined for classification of different types of pre-processing performed on the image.
- Copyright
- © 2016. the authors. Co-published by Atlantis Press and Taylor & Francis
- Open Access
- This is an open access article under the CC BY-NC license (http://creativecommons.org/licences/by-nc/4.0/).
1. Introduction
Due to technological advancement and free commercial sophisticated technology for image editing, image forgery and tampering is very ubiquitous. All the events are made evident by means of photographs and hence authenticity of these digital images is of great importance as several legislative, technical as well as newscast organizations are dependent on these evidences, proofs and digital testimonies. Identification and verification of alterations performed on images is essential to keep a check on mortification, legal implications, falsification of documents and other undesirable and illegal transformations [1].
There are two broad classifications of image tampering namely cloning and composition. In cloning based image tampering, a small copied portion of image is pasted on the same image at some other location. This type of attack is also known as “copy-cover forgery” because the intention of the forger incorporating this technique is to hide some information of image with the content available in same image. Composition based image tampering comprises of utilizing two or more images to tamper a third image. These types of alterations are also known as “image creation based forgery” [2] Examples of copy-move forgery is shown in Figure 1.
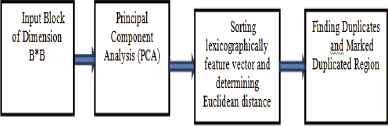
Block Diagram of Forgery Detection Using PCA Based Technique.
Digital Image forgery detection techniques can be classified into two categories: first one is active forgery detection technique which involves watermarking and digital signature based approach to detect possible forgery in the given image. The main disadvantage of this scheme is that it requires special hardware support for additional information i.e. Information required in watermarking. Second is blind detection technique which falls under passive forgery detection, this technique is based on the characteristics available in the image to find the alteration performed. Though blind detection technique is complex but due to its versatility it has found much interest of researchers in the last decade.
There are various research works on Forgery detection mentioned in section 2.1 in past few years which deals with one or two post forgery methods. Moreover exact parameters of the copied object image are also not calculated. Due to use of some specific reduction and feature extraction technique, previously defined works could not even find type of post-processing method used after cloning. Other drawbacks in previous works are drastic changes in accuracy of the system with changes in sizes of blocks which are used as basic blocks on which reduction methods and feature vector is applied. Due to use of different reduction techniques on the given input image, different feature vectors are generated which are lexicographically sorted and also analyzed by different methods as mentioned in section 2.1.
This paper proposes a Nobel system to detect forgery, extent of forgery, parameters of forged area, robustness and accuracy while taking variable sizes of blocks of pixels (including both cases of overlapping and non-overlapping block), type of forgery and post processing which was done on forged image. Detection tool developed in the system is elaborated in section 2.1 and Fuzzy based tool in the system described in section 2.2 gives output decision about what type of forgery and post-processing is present in a forged image. Broadly this system is divided into two part, one which has the responsibility of detecting the forgery and then calculating result matrix of various tools (defined in section 2.1) and the other system is responsible for classification of type forgery or processing done on the image. The classification process is done with Fuzzy system whose input is obtained from the detection tools result matrix. Different reduction methods provide different and random results as compared to each other’s for a specific type of forgery. To handle such varied outputs and decide a global answer fuzzy system proves the most effective. Fuzzy inference system developed is described in 2.2 sections which include different set of if-then rules mentioned in section 2.2.2 which is the core process of classification of different types of preprocessing done on image. Two membership functions are taken in this fuzzy system namely triangular and Gaussian for the reason of maximum area which these membership functions include.
This system overcomes all the above mentioned drawbacks. Proposed system accurately detected forged area in the image and calculated all the parameters mentioned above.
2. Related Work
Many researchers have found interest in detection of digital image forgery through blind detection technique. Detection of image tempering was first analyzed by Fridrich et al [3], they have proposed DCT based block matching algorithm which is proven to improve the computational efficiency of exhaustive search algorithm. Later Popescu et al. [4] proposed similar method which utilizes PCA based dimension reduction method instead of DCT to reduce the dimensionality of the feature vector and hence to reduce the computational complexity as well as computational time. His method has been proven to be better than the prior DCT based algorithm experimentally. Wu Qiong et al. [5] proposed DCT-SVD based method in which the image given is first undergone through two-level DWT. The resulting image is of ¼ dimension of the raw image, which is then passed through SVD based dimension reduction and lexicographic sorting to find the possible match. The aforementioned techniques were aimed at reduction of the computational complexity but the authors have not considered the post-forgery alteration on the image. The easy availability of the editing software has made it quite easy for a forger to conceal the alteration performed through several post processing algorithms including intensity variation, blurring, rotation and noise addition. In this regard Huang et al [6] has proposed improved DCT based image forgery detection system which is capable of to cope up with distortions like blurring, jpeg compression and additive white Gaussian noise. Cao et. al [7] presented circular block based multiple copy-move forgery detection system, their technique is robust to blurring and noise addition as well as it can detect multiple copied portions in the same image. To enhance the efficiency of DWT based approach Muhammad et al [8] proposed undecimated dyadic wavelet transform (DyWT) based blind copy move forgery detection system. DyWT is scale invariant and hence it is robust to attack like scaling. Many other researchers have also worked on copy move forgery detection techniques to improve the computational efficiency, flexibility and robustness of the algorithm including Akbarpour et al. [9], Lynch et al. [10], Zhao et al. [11], Li et al. [12] and ketenci et al. [13]. The above mentioned schemes are useful in improving efficiency and robustness of the system but due to the uncertainty of the field a single method cannot confront all the aforementioned distortions. Additionally, in real time a tampered image may be outcome of more than one image processing tool, As a result, a robust tamper detection technique necessitates that a number of detection techniques should be applied on the image to handle different alterations. The above discussion led to the need of an algorithm which not only manages the instability presented by detection algorithms but also combines the result of different algorithms into a single channel. Hence this paper proposes a “fuzzy logic based approach” to deal with the inaccuracy of different algorithms and to provide a single solution based on the cumulative and cascaded elicitations.
We evaluate the performance forgery detection system with DWT, DCT, PCA, DWT-DCT, DWT-DCT-SVD and DFT based dimension reduction technique and build a fuzzy based classification system to categorize the distortions applied on the image.
3. Methods and Tools
Proposed system uses two major tools, one for detection of forged object in the image and other tool for classification of forgery in the image by Fuzzy logic. Section 2.1 describes structural features of all methods, techniques and algorithms used for detection process.
Section 2.2 elaborates classification process based on fuzzy logic.
3.1. Methods and Tools used in Detection Process
3.1.1. Principal Component Analysis (PCA)
Initially Principal Component Analysis (PCA) is applied on small fixed-size blocks to yield a reduced dimension representation. In a grayscale image consisting of P^2 number of pixels, PCA is applied on small blocks of B^2 pixels (B*B dimension) which are assumed to be very small than actual dimension of forged object of the image. PCA provides robustness and good sensitivity in detecting additive noise and lossy JPEG compression, minor intensity variation, but it doesn’t work for small angular transformations. Block Diagram of forgery detection using PCA based technique is shown in Fig. 1.
Covariance matrix of blocks which are taken as vector ‘a’ is calculated as indicated below and Pb=P−B+1
3.1.2. DWT-DCT
In this method, out of total P^2 pixels, DWT and DCT features of blocks of B^2 non overlapping pixels are calculated and lexicographically sorted to detect forged area. In the first step, DCT of all the B^2 pixels are calculated and coefficients of cosine transform are stored in a matrix. Then in the second step, DWT is calculated to a single level of decomposition and then deriving Eigen vectors for completing the feature matrix. Then this matrix is lexicographically sorted and by determining the closeness of two vectors, forged area is detected. Because of use of non-overlapping block, complexity of sorting was at P*log (P). DWT-DCT method is robust to JPEG compression and additive noises. Block diagram of forgery detection using DWT-DCT based technique is shown in Fig. 2.
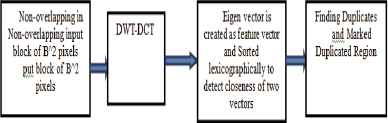
Block Diagram of Forgery Detection Using DWT-DCT Based Technique.
Coefficient matrix after DCT on block having B*B pixels.
3.1.3. Discrete Fourier Transform (DFT)
In this method, 1-D FT of rows of non-overlapping block is calculated and feature vectors are formed by averaging the values of transformed respective columns. DFT method is resistant against Gaussian Blurring or JPEG compression. Overlapping blocks are used to determine 1D and 2D Fourier transform of the block. Block diagram of forgery detection using DFT based technique is shown in Fig. 3.
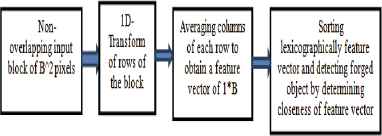
Block Diagram of Forgery Detection Using Discrete Fourier Transform (DFT) Based Technique.
Fourier coefficients are calculated as:-
3.1.4. Discrete Cosine Transform (DCT)
Owing to the nature of copy-move forgery, there must be at least a pair of similar regions in a tampered image, which is the basis of all passive detection algorithms. A natural image, on the contrary, is unlikely to have two large similar regions except for the images that have a large area of smooth region, such as blue sky or green grassland in the image. Hence, the task of passive-blind forensics is to determine whether an image contains large similar regions. Since the shape and size of copied regions are unknown, it is definitely computationally impossible to try to compare every possible pairs of region pixel by pixel. Obviously, it is more effective to divide a forensic image into fixed-sized overlapping blocks and examine whether pairs of blocks are duplicated. The key step is to extract some appropriate and robust features from each block in order to implement an effective detection. Therefore, a good feature can not only represent the whole block, but also has the robustness of common post-processing operations, and what is more, make the detection algorithm have lower computational complexity.
The discussions above draw forth the framework of copy-move forgery detection algorithm, which is also shown in Fig. 4. The whole detection framework is given as follows:
- (1)
Dividing the suspicious image into fixed-size overlapping blocks.
- (2)
Applying 2D-DCT to each block to generate the quantized coefficients by means of quantization.
- (3)
Representing each quantized block by a circle block and extracting appropriate features from each circle block.
- (4)
Searching similar Block Pairs.
- (5)
Sorting lexicographically feature vector and detecting forged object by determining closeness of feature vector
- (6)
Finding correct blocks and output the detection result.
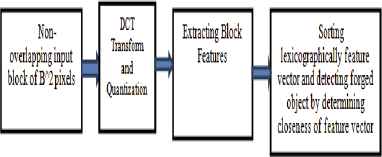
Block Diagram of Forgery Detection Using (DCT) Based Technique.
3.1.5. Singular Value Decomposition (SVD)
In this method small block of dimension B*B is taken (overlapping blocks are taken over the complete gray scale image giving (P−B+1)^2 pixels) and then apply SVD on this block. Output of SVD gives us the feature vector and then forged object could be detected by checking similarity of feature vectors by lexicographically sorting them. SVD is resistant to geometric changes, algebraic changes, scaling rotation, additive noise, Gaussian blurring, lossy JPEG compression. Block diagram of forgery detection using SVD based technique is shown in Fig. 5. Basic theory of SVD can be explained as below:
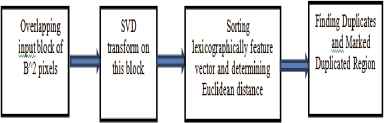
Block Diagram of Forgery Detection Using SVD Based Technique.
Let P be an input image matrix with P ∈ RN×M, SVD of P is defined as
Λ ∈ RM×M is N×M diagonal matrix with the form
3.1.6. DWT and SVD
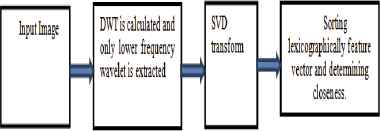
In this method, initially image is passed through DWT algorithm and then SVD is applied only on lower frequency wavelet portion. Then singular value vectors are lexicographically sorted and copied object will be close to the object of which copy was generated. This method is resistant to edge blurring and compression but it deals with large number of blocks as actual image is taken as input. Block diagram of forgery detection using DWT-SVD based technique is shown in Fig. 6.
Block Diagram of Forgery Detection Using DWT And SVD Based Technique.
3.1.7. DCT and SVD
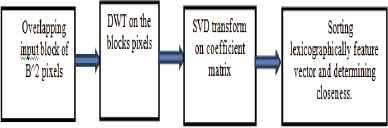
In this tool, overlapping blocks of B*B dimensions are taken from the input image and then 2D-DWT is applied on these blocks to get coefficient and then SVD is applied on the coefficient matrix to give the final feature vector. Feature vector is sorted lexicographically to detect forged object in the image. This method is Robust against Gaussian blurring, AWGN, JPEG compression and their mixed operation. Block diagram of forgery detection using DWT-SVD based technique is shown in Fig. 7.
Block Diagram of Forgery Detection Using DCT And SVD Based Technique.
3.2. Fuzzy System for Classification Process
In most practical cases and situations, a forged or tempered image is outcome of many processing tools. This is the main reason why we have opted for use of multiple tools in detection process. Using various detection tools leads to a problem of varied outputs of each tool. Outputs of each tool are not only heterogeneous but also have varying degree of result depending upon the processing it is looking for in the input tampered image. Whatever results and outputs come from multiple tools, we desire global answer or output which gives decision regarding authenticity of the image. By experimental analysis, it is realized that different tools dissent from each other on a specific tempered image with multiple or single processing. In such cases simply taking classical methods of majority vote or simply binary oring of output of all the tools will not provide reliable and accurate result. It is also logically accepted that for determining the global final output, it would be a very complex, tedious and difficult task to determine a global mathematical theorem which can give final global answer with very high accuracy. It is also evident from experimental data that detection tools defined in section 3.1 do not produce very accurate and reliable output thus there is some degree of uncertainty.
3.2.1. Methodology in Fuzzy system
(A) Fuzzy Sets and Membership Functions
Assume X denotes a universal set and assume another set P such that P ⊆ X. Then characteristic equation of P is denoted as below
Above defined sets are also called crisp sets. In a Fuzzy system, F ⊆ X, there is a generalized characteristic function μF(x) : X → [0, 1] instead of {0,1}. This function is also called membership function which associates each element x ∈ X to a real number ∈ [0, 1]. Suppose there are two sets P, Q and μP, μQ are their respective membership function. Following operations can be defined on these functions:
There are various types of membership functions which includes triangular, trapezoidal, Gaussian, generalized bell etc.
We have used triangular and Gaussian membership function for both input and output. These membership functions are also useful in smoothing input and output.
(B)Fuzzy Inference System
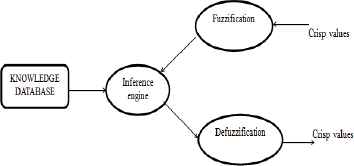
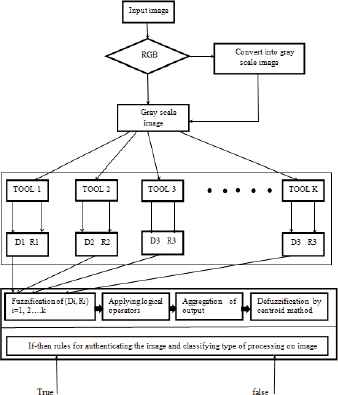
Fuzzy inference system represents the actual working or complete protocol of fuzzy system in classification process. Fuzzy inference system is set of fuzzy rules which convert input into output. More specifically, Fuzzy inference system gets crisp set as input which they convert into fuzzy set before applying If-then rule on them. The output obtained from If-then rules is in fuzzy terms and there is need to convert it into global result. Following four steps explains Fuzzy inference system Block Diagram of Fuzzy inference system is shown in Fig. 8.
- 1.
Fuzzification of input:-In this process, the crisp quantities are converted to fuzzy sets. Each input is assigned a degree of membership corresponding to membership functions of fuzzy sets.
- 2.
Use of fuzzy operators-According to rules of behavior, degree of Fuzzification obtained from the above step is combined. Fuzzy logic operators defined in (5) are used to produce a single value if multiple antecedents are present. This is also called degree of support of the rule.
- 3.
Implication method-Usually there is several rules in a fuzzy system, each of which contributes with its own truncated output set. But there is a need of a single output fuzzy set, thus requiring some kind of aggregation procedure. The most common method of aggregation consists of the max criterion.
- 4.
Defuzzification- The output of previous step is in terms of fuzzy set, but we need an output in crisp set or a global value. For this we have used Centroid method (also called as center of gravity or center of area).
(C) Standardized Output of Tools
Situations when we use multiple tools, there is an important need of standardizing output of each tool in the same format and then processing these standardized output in fuzzy system. Standardized output of each tool is in the format if (D, R). D ∈ [0, 1] is the degree of detection, which gives us the measure of output of tool for the tampering trace, for which the tool is looking in the input image. Value near 1 show that tool is indicating strong presence of tampering in the image (for a single or multiple tampering type which the tool is looking for). R ∈ [0, 1] is termed as reliability of D which indicates measure of confidence on a tool output D. Value of R close to 1 indicates that one can heavily or confidently rely on D of the given tool in decision making. D generally changes from image to image, but in general for value of R or reliability of a forensic tool, we need to know accurate behavior and performance of that tool on various different tampered images with different processing performed on them. Value of R is sometime considered to be constant and sometime derived on the basis of characteristic patterns (size, color, visuals etc.).This is usually done by experimental or theoretical analysis of the respective tool.
(D) Fuzzy Set Assigned to Fuzzy Variables
The output of tools (D, R) represents the input fuzzy variables of fuzzy inference system For value of D close to 1 which shows précised detection of tempering by the tool, fuzzy set ‘high’ is assigned to it, and for lower value of D, fuzzy set ‘low’ is assigned. Same analogy is extended for R i.e. a tool is highly reliable, when we are analyzing an input image, then fuzzy set for R will be ‘high’. On the contrary, if the tool is not reliable, then fuzzy set will be ‘low’. Depending upon If-then rules and interrelation of all the tools, we get the output and we have assigned two fuzzy set to the output. One is ‘high’ and the other is ‘low’. In classification process, for output we have used 4 fuzzy set namely ‘Low’, ‘Medium’, ‘High’, and ‘Highest’. These fuzzy sets are used by the fuzzy system and in the development of If-then rules.
3.2.2. Decision making in Fuzzy system
(a) If-then Statements
Let x1…… xn and y1…… yn be fuzzy variables and let A1…… An and B1…… Bn be fuzzy set.
Then following are If-then terminology used in decision making
IF x1 is A1 AND x2 is A2 AND ………AND xn is An
THEN y1 is B1 AND y2 is B2 AND ………AND yn is Bn
First part of the rule is named antecedent or premise and second part is called consequent or conclusion. Above mentioned rules are also called as madani’s model.
(b) Construction of Standard and Non-Standard Cases
We have to inform our developed fuzzy inference system about expected behavior, trait of tools, and their mutual interdependence. Before developing If-then rules in our fuzzy inference system, we have to develop a table which can categorize the set of output of all the tools into standard (i.e. expected output) and nonstandard output. Under standard output we have two possible cases. Suppose if a tool is capable of detecting a specific processing, finds that kind of tempering in a forged image, then we will say ‘found’. If tampering is not found, which the tool is looking for, then we can say ‘not found’. For non-standard output, first we have to transform it into a standard one.
An example to the formation of these cases:- Suppose we are using two tools T1 and T2, T1 can detect processing P1 with high precision and T2 can detect P2 with high precision, then there arise 4 conditions of found and not-found for these two tools depending upon combination of P1 and P2 on input image.
Case1: only P1 is present
T1 will be able to detect and thus ‘found’ and it will be ‘not-found’ for T2
Case2: only P2 is present
T2 will be able to detect and thus ‘found’ and it will be ‘not-found’ for T1
Case 3: Image is not tampered (i.e. P1 and P2 both absent)
In both the tool cases, it will be not found.
Case 4: Image is not tampered but there is presence of noise, or unreliability, or partially found
Due to presence of above mentioned problems, both tools will be assigned ‘found’.
Case 1, 2, 3 present standard cases while case 4 is a non-standard case. Case 1,2 delineate that output can be classified, hence assume we have named them as ‘true’ and we name case 3 as ‘false’.
(C) Decision Making
Suppose we are considering M number of tools, then there will be an array of size M*1 having elements (D, R) of each tool. This array also represents input fuzzy variables for our proposed fuzzy inference system. For input, we have considered two fuzzy sets, low or high. For output in case1defined in 2.2.2.B, If-then statement will be as followed:-
IF (D1 high ˄ D2 low)
THEN [IF (R1 high ˄ R2 high) THEN
tampering is high
else tampering is low]
IF (D1 high ˄ D2 low)
THEN [IF
THEN
tampering is low]
This can be alternately written as:
IF (D1 high ˄ D2 low) ˄ (R1 high ˄ R2 high)
THEN tampering is high
IF (D1 high ˄ D2 low) ˄
THEN tampering is low
4. Proposed Methodology
Cloning an image with an objective to hide any individual or object in the sight is the most common part of digital image forgery. When this has been done with attention, it may be tough for anyone to diagnose cloning creatively. The variable size of cloned portion makes it computationally unattainable to match all the probable image locations. The threat is even bigger when the forger distorts the image to hide the forgery. Block matching based forgery detection technique [3] is strong forgery detection tool available in the digital image processing literature.
Block Diagram of Fuzzy Inference System.
The idea behind the algorithm is to “divide a PxP image into a number of overlapping and non-overlapping blocks of size B×B which results in (P−B+1) ^2 blocks in total. Feature matrix of size k×b2is constructed by reshaping each block into a row vector of size (k* b2).This feature matrix is then sorted lexicographically which assures that similar feature vectors are sorted adjacent to each other”. The difference between the adjacent pair of row is known as shift vector. “Higher the occurrence of shift vector implies that a portion has been duplicated and the resulting location information of such portions is saved for further processing and decision making.”
It is clear that as the image size increases the computational complexity of the algorithm also increases. A variety of dimension reduction techniques e.g. DWT, DCT, DFT, PCA and SVD are presented in the literature to reduce the computational complexity of the algorithm [3, 4, 5, 6]. DCT and PCA methods are robust to small elementary changes in the image after forgery and noise addition but then failed to provide higher accuracy when drastic changes are made by the forger. DWT provides robustness to Gaussian noise addition but does not perform well when image is manipulated with blurring effect. A single technique is not suitable for all kind of post processing performed on an image, hence a novel and tenable forgery detection and classification system has been proposed in this paper, the proposed technique applies a set of detection algorithms on the given image and comments on the nature of forgery is done with fuzzy based classifier. This section presents the complete terminology of the system. Fig. 9. shows exact flow of our detection system.
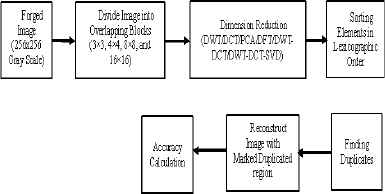
Proposed Forgery Detection System- Flow Graph Representing the Exact Terminology.
Input image is first checked whether it is a RGB image by checking the size of the image. If size (Image, 3) function in MATLAB returns 3, then it depicts input image is RGB image. Then using rgb2gray function, we convert the image into gray scale image. Then images with different post processing’s taken into blocks of different sizes mentioned in table 3 are passed through all the tools mentioned in section 2.1. Table 3 shows accuracy of detection of all these tools for different block sizes. As explained in section 2.2.1, output of these tools will be in terms of (D, R). As already mentioned, these sets define Detection and reliability of the respective tool.
These set will then be passed as input in fuzzy system described in section 2.2. First step in fuzzy system is to convert crisp variables which are (D, R) of each tool and then taking them as fuzzy variables, systems convert it into fuzzy set by the logic defined in section 3.2.1(D). Now these fuzzy set are the input to developed fuzzy inference system which is explained in 3.2.1(B). Output of each tool is then merged by abstract level fusion process i.e. determining partial scores of each tool and then getting binary values which are aggregated to form a global answer. This answer is compared with a threshold value. If the value is greater than threshold value VT, then it is concluded that image is forged or tempered. But if it is less than the threshold value, then it is concluded that it is not tempered. Classification process is formulated with similar analogy as defined in section 3.2. According to the inputs (D,R), one of the fuzzy sets named ‘Low’, ‘Medium’, ‘High’ and ‘Highest’, is assigned to the corresponding tools for the same image. These fuzzy sets depict intensity or degree with which the tool feels presence or absence of a specific tempering. If a tool is highly reliable then we can assign higher degree of fuzzy set to its output i.e. ‘Highest’ if the tool feels that image is forged and that specific processing is present. Similarly ‘Low’ is assigned if the tool shows absence of that processing. These are represented in Table 1 and are obtained by experimental analysis and results. Table 2 shows true and false cases (standard cases) for a single type of processing. Depending upon fuzzy set assigned to the tools, ‘Found’ and ‘Not Found’ are denoted. Process flow for the proposed classification fuzzy based system. is shown in Fig. 10.
IF (D1 high ˄ D2 low)
THEN [IF (R1 high ˄ R2 high) THEN tampering is
Highest
ELSE tampering is High]
If-then rules are formed according to table 1 (for standard cases only) which is obtained by experimental analysis and result. An example for standard and required cases is explained in Table 2.
Process Flow for the Proposed Classification Fuzzy based System.
| PCA | DWT | DWT-DCT | DWT-DCT-SVD | DFT | DCT | Decision |
|---|---|---|---|---|---|---|
| Low | Low | Low | Low | Low | Low | Blurring |
| Medium | Medium | Medium | Medium | Medium | Medium | Gaussian Noise |
| High | High | Highest | High | High | High | Intensity Variation |
| Highest | Highest | High | Highest | Highest | Highest | Normal Forgery |
Rule Set for Proposed Forgery Classification System.
| TOOL | CASE-1 (TRUE) | CASE-2 (FALSE) |
|---|---|---|
| PCA | Not found | Not found |
| DWT | Not found | Found |
| DWT-DCT | Found | Not found |
| DWT-DCT-SVD | Not found | Not found |
| DFT | Not found | Found |
| DCT | Not found | Not found |
Denoting True and False Case (standard cases) for Intensity Variation.
Final output gives us the classification in terms of which post-processing method was applied on the tempered image. Process of classification is explained more clearly in section 5.
Table 1-Output of all the tools for 5 different types of post processing done on the image. First 6 columns give output of all the tools (mentioned in section 2.1) for a tampered image with post processing methods mentioned in column 7. Each row describes the fuzzy set assigned to the tool according to its behavior and output for that specific post processing method mentioned in 7th column. Denoting true and false case (standard cases) for intensity variation. This table shows only one false case, but there are multiple such cases.
4.1. Mathematical Representations of the Proposed Algorithms
- 1.
Given Three dimensional RGB image is first converted to two dimensional image by gray scale conversion formula given in Eq-1
- 2.
The resulting image I is then divided into b sized overlapping blocks generating a total number of (M − b + 1) × (N − b + 1)
x, y ∍ {0, …, b − 1}, i ∍ {0, …, M − b}, and j ∍ {0, …, N − b}
- 3.
Now dimension reduction technique is applied over each b x b block as follows:
x, y ∍ {0, …, b − 1}, i ∍ {0, …, M − b}, and j ∍ {0, …, N − b}
Other dimension reduction techniques and detection techniques mathematical models is explained in section 3.1
- 4.
Then the feature vector is extracted as follows:
Where Nc = {1, … … n}, n is the length of C. - 5.
These feature vectors are arranged into a (M − b + 1) × (N − b + 1) matrix, represented by m.
- 6.
The resulting feature matrix is then sorted lexicographically on order to arrange similar components adjacent to each other. A matching procedure based on calculating offset value between neighboring elements is applied to find the similarity. A threshold value is set to determine the amount of neighbor. “If the Euclidian distance between the pair is less than the threshold then the pairing neighbor is considered to be part of forgery”. Their location information (xi, yi)(xjyj) and the shift vector between them [|xi, − xj|, |yi − yj|] are therefore stored. From these offset values most frequent element is calculated and each pixel in the image is compared with this frequent element and accordingly replaced with black pixel.
- 7.
Weight value for the fuzzy inference system is then calculated based on the difference between the detected and the copied portion.
here (x1, y1) → (x2, y2) and (x′1, y′1) → (x′2, y′2) and are the dimensions of copied and detected region respectively. Finally the performance of the algorithm is evaluated based on True Positive Rate, False Positive Rate and Accuracy given as:
5. Results Analysis and Discussions
Under this head, simulations are performed on MATLAB with 13 (32GB RAM) processor using MICC-F220 images and CASIA dataset [27, 28]. The investigated images are exposed with varied values of variance and standard deviation associated with Gaussian blurring and then tried to validate our fuzzy based algorithm in its sequential detection. As it is already known, 6 different forgery detection techniques in individual as well as hybrid form (which is also a novel approach) are applied. The role of the fuzzy-based classifier comes into picture afterwards. Fig. 11. represents the proposed FIS system while Fig. 12. shows different Membership functions in the fuzzy systems. Fig. 13. shows is an image of fuzzy rules defined in the system.
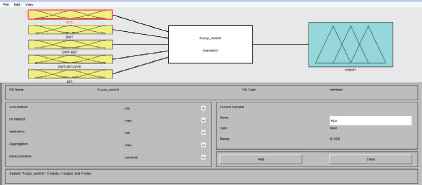
Proposed FIS system.

Fuzzy Membership Functions- Triangular and Gaussian are taken as Membership Functions.
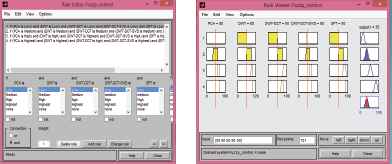
Fuzzy Rules- Required Fuzzy Rules on Various Reduction Tools for the Purpose of Classification.
The Table 3 and Table 4 testimonies that as the block size is increased, the computational complexity for the algorithm ekes out and thus the overall efficiency dwindles. This section will deal with the prolific issues of the paper. The result analysis has been divided into 5 main sections, which in turn, have been divided into further sub-sections. The first section deals with the applicability and validity of the proposed fuzzy logic based algorithm under various types of forgerial modifications. Here, for better understanding of the algorithm, 2 blocks are used (for lexicographic sorting) differing in the size. The second section prologues a graphical outlook on the conclusions of the algorithm, with reference to the previous section. The last section compares the related works in this field of forensic sciences and the peculiarity of our algorithm.

Result for Forgery Detection System (56×56).
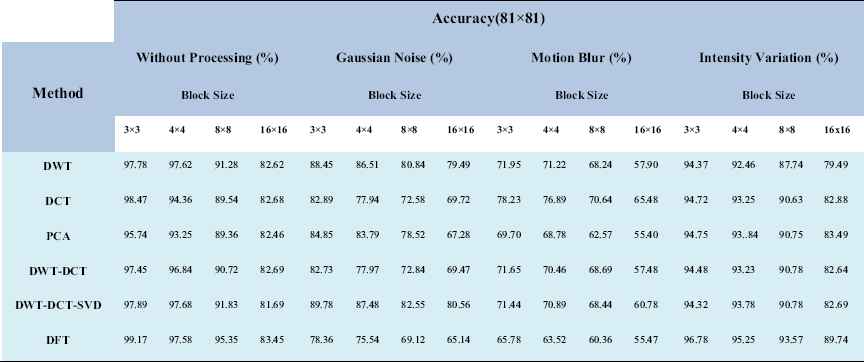
Result for Forgery Detection System (81×81).
5.1. Performance Analysis for Image Forgery Detection, in Concordance with Variation in Block Length and Size of Copied Portion
The proposed fuzzy based forgery detection system is simulated on MATLAB (2013a). A random set of images has been taken from MICC-F220 & CASIA [14]–[15] data set and tested for varying block length and size of copied portion and results have been compared with respect to accuracy. Block size are varied as 3×3, 4×4, 8×8 and 16×16 while the size of duplicated portion is taken as 56×56 and 81×81.
Table 3 shows the comparative accuracy result for 56×56 sized copied part for proposed forgery detection system and the Accuracy Result for Forgery Detection System (81×81) with Gaussian noise, motion blurring, intensity variation and without processing for various block sizes for 81×81 are given in Table 4.
Table 3 shows the variation of accuracy for different block sizes with 56×56 size copied portion. It is observed that for smaller block size accuracy value is high while it reduces on increasing the block size. DFT performs well with highest accuracy of 94.35% in case of Normal forgery and 88.13% in case of Intensity variation. While in presence of Gaussian noise and Motion blurring DWT based scheme outperforms all other schemes with an accuracy of 80.99% and 51.92% respectively. It should be noted that in proposed scheme accuracy is not calculated by number of correctly detected image while pixel based approach is chosen to calculate the accuracy.
Table 4 below shows the same for the size of copied portion to be 81×81. With increase in the size of copied portion (number of elements to be copied) improvement in the performance of detection techniques has been observed. Now the highest achievable accuracy is 99.17 % which was achieved with a block size of 3×3 in case of normal forgery and 96.78% in case of intensity variation both by DFT scheme. Unlike the prior case DCT based scheme provides the highest accuracy in case of motion blurring and DWT-DCT-SVD cascaded scheme provides 89.78% accuracy in case of Gaussian noise addition.
The Accuracy Vs Block size graph for DWT based forgery detection system is given in above. DWT performs better in case of normal forgery while it is found out to be the worst as far as our research standards are concerned.
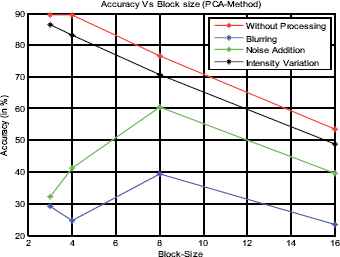
The performance of PCA based forgery detection system is given in Fig. 14., PCA performs well in case of Intensity variation and normal forgery while it does not perform well when Blurring and Gaussian noise addition is performed over forged image.
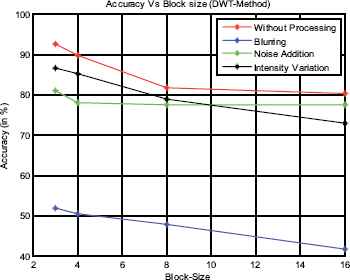
Accuracy Graph for DWT Based Forgery Detection System (56×56).
Fig. 14. to Fig. 19.; show the performance of DWT, PCA, DCT, DFT, DWT-DCT and DWT-DCT-SVD algorithms respectively. The overall observation shows that “accuracy of the algorithm is inversely proportional to the block size”. Also the “computational time is inversely proportional to the block size used”. Higher block size provides to lower computational time but it results in diminished accuracies.
Accuracy Graph for PCA Based Forgery Detection System (56×56).
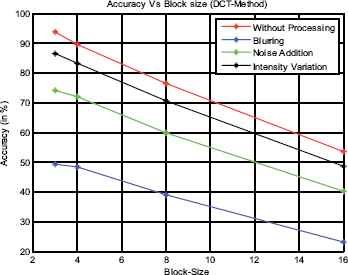
Accuracy Graph for DCT Based Forgery Detection System (56×56).
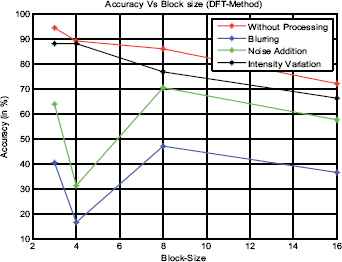
Accuracy Graph for DFT Based Forgery Detection System (56×56).
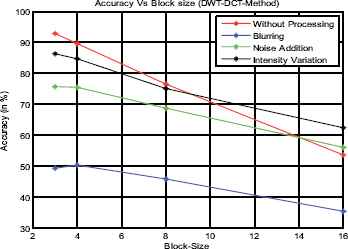
Accuracy Graph for DWT-DCT Based Forgery Detection System (56×56).
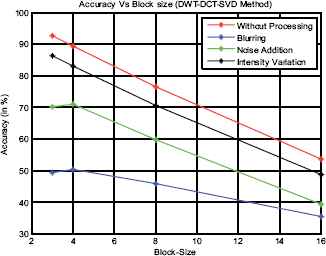
Accuracy Graph for DWT-DCT-SVD Based Forgery Detection System (56×56).
One general observation can be made from these graphs is that as the block size increases, the overall accuracy of the fuzzy based algorithm reduces. This fact can be justified from the fact that as the block size increases, the feature matrix ultimately increases and this impoverishes the computational efficiency of the lexicographical sorting. As lexicographical Sorting is one of the most significant precursors of the proposed algorithm, reduction in its coherence consequently abates the overall performance.
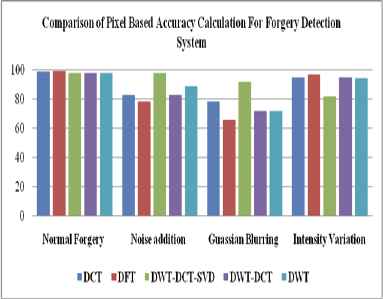
5.2. Visual Results for Forgery Detection Results from Database
In the following experiment, some images are selected with the size of 256×256 pixels from MICC-F220 dataset to test the effectiveness of our algorithm. All the doctored images in this experiment are without any post-processing operation and the corresponding detection results are illustrated in Fig. 20. The sub-figure of first column shows the tampered images. And sub-figure of the second column Images with the black box indicating the copy-move regions and pasting location gives the detection results. Each image was composed of two images: tampered image and map image from proposed algorithm could detect all the cases precisely.
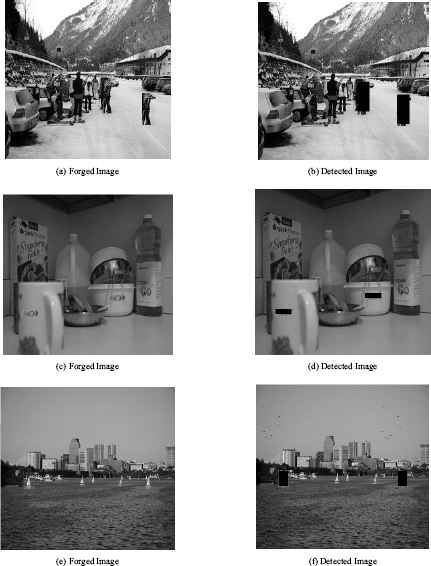
Detection Results of Proposed Algorithm without Distortion with MICC-F220 Database Images.
5.3. Visual Results for Forgery Detection Results with Various Attacks
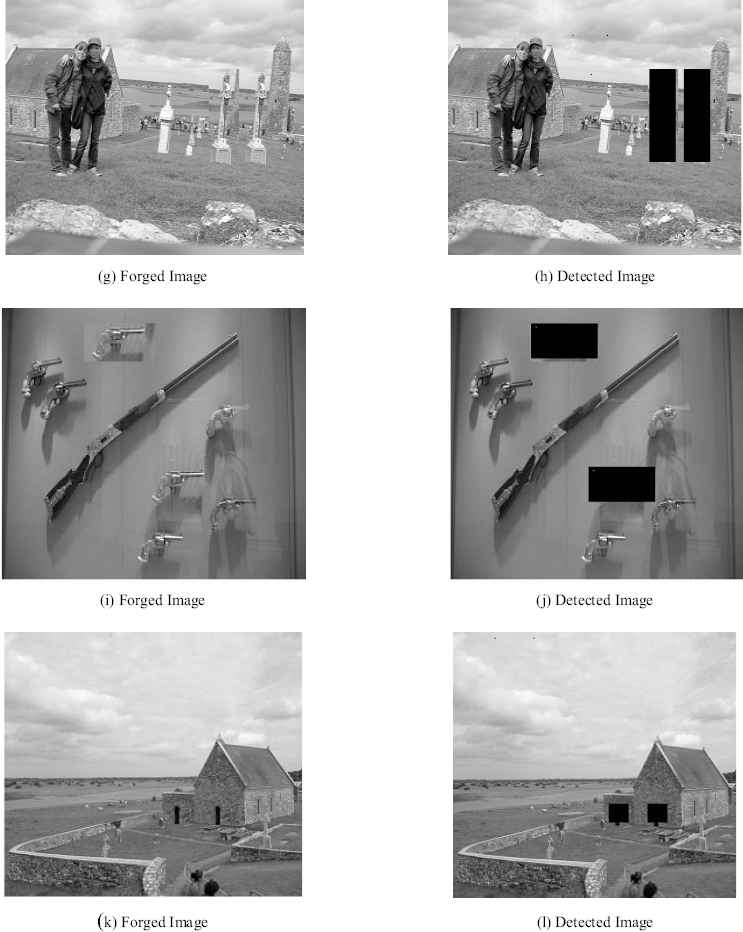
Since forgers usually do their utmost to create an imperceptible tampered image, various kinds of postprocessing operations are carried out such as additive Gaussian noise, Gaussian blurring, or mixed operations. In this section a series of experiments conducted to test the robustness of the proposed method. Furthermore, in order to evaluate quantitatively the robustness of our algorithm to different image distortions, 200 original images were selected randomly from the datasets to generate doctored images by copying a square region at a random location and pasting onto a non-overlapping region. Fig. 21 (a). is the tampered image with Intensity Variation and Fig. 21(b). is the detection result. Figure 21(c) is the tampered image blurred by a Gaussian blur filter ω=3 and σ=1 and Fig. 21(d). is the detection result. Fig. 21(e). is the tampered image is corrupted by adding White Gaussian noise with SNR = 21 db and Fig. 21(f). is the detection result. Proposed algorithms can locate the multiple duplication regions with a satisfactory degree, even though the image is processed by various kinds of post-processing operations.
Detection Result of Proposed Algorithm under Various Test Scenarios.
5.4. Performance Analysis for Accuracy of Image Forgery Detection
For practical applications, the most important aspect of a detection method is the ability to distinguish tampered and original images. However, the power to correctly locate the tampered region is also significant, which gives the strong evidence to expose digital forgeries. Thus, the performance is evaluated of proposed algorithm at two levels: at image level, which focus on whether the fact that an image has been tampered or not can be detected and the other is at pixel level, which evaluate how accurately tampered regions can be identified.
5.4.1 Pixel Based Accuracy Calculation
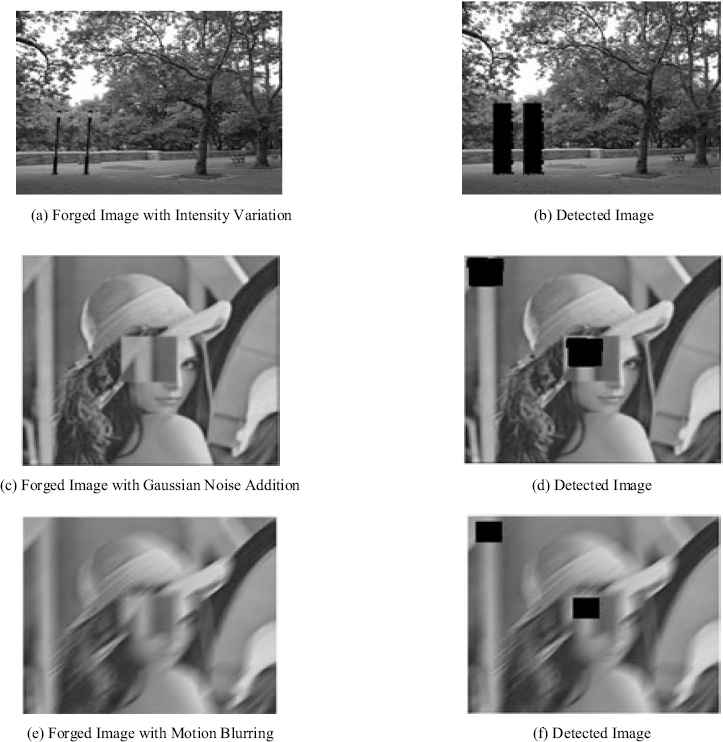
Performance of proposed detection forensic tools in terms of pixel based accuracy is given in Table 5 below. 220 images were randomly chosen from MICC-F220 [14] and undergone through Gaussian Noise addition, Motion Blurring, Intensity variation and Normal forgery respectively.
Pixel Based Accuracy Calculation for Forgery Detection System.
DFT performs well with highest accuracy of 99.17% in case of Normal forgery and 97.68% in case of Intensity variation. While in presence of Gaussian noise and Motion blurring DWT-DCT-SVD based scheme outperforms all other schemes with an accuracy of 97.68 and 91.83% respectively. Thus, the performance is evaluated of proposed algorithm at pixel level, which evaluate how accurately tampered regions can be identified.
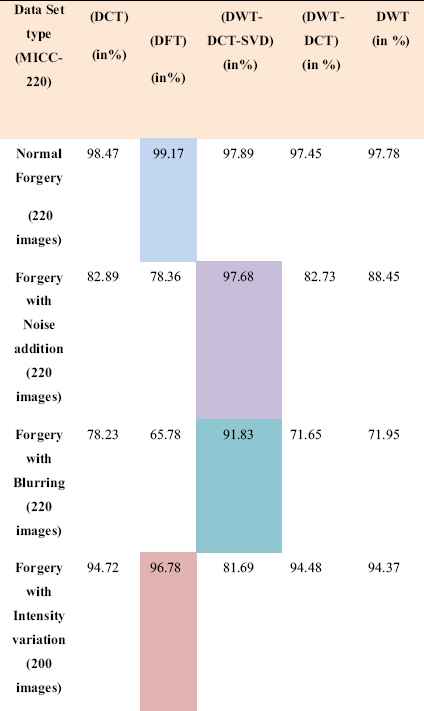
It should be noted that in our scheme accuracy is not calculated by number of correctly detected image while we have chosen pixel based approach to calculate the accuracy. All algorithms are able to detect all types of forgery with respect to pixel values. Comparison graph of pixel based accuracy calculation for forgery detection system on data set of 220 images; each with Normal forgery, with noise addition, with blurring, and with intensity variation is shown in Fig. 22. and represented in Table 5.
Comparison Graph of Pixel Based Accuracy Calculation for Forgery Detection System Based on Values in Table-5.
5.4.2 Images Based Accuracy Calculation
For the satisfactory progress of results discussions and analysis, in very terse, must know the basic parameters, upon which it would be making our conclusions. Generally, for faithful discussion, Three parametric elements are required, viz., False Positive Rate (FPR), TPR or Recall, Precision.
True Positive): Forged image identified as forged
FP (False Positive): Authentic image identifies as forged
TN (True Negative): Authentic image identified as authentic
FN (False Negative): Forged image identified as authentic
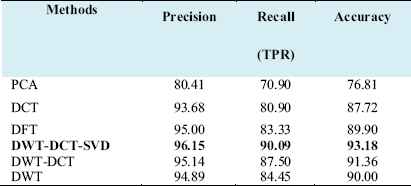
The performance of the algorithms is measured using these metrics. Hence they are termed as performance metrics. Recall is the ability of the algorithm to correctly detect a forged image as forged. It is also known as true positive rate. Precision is the probability of truly detecting a forgery. It is also known as Positive Predictive Value (PPV). A high value of precision and recall imply better performance of the system. For a better system, accuracy should be high. Eventually it elicit by its higher values that the methodology is going to be a precious tool in the Image Forensic cases. DWT-DCT-SVD based scheme outperforms all other schemes with an accuracy of 93.18 respectively. Performance parameter analysis for image forgery detection is tabulated in Table 6. The Proposed technique achieves a precision of 96.15% and a recall rate of 90.09%. Thus, the performance is evaluated of proposed algorithm at image level, which focus on whether the fact that an image has been tampered or not can be detected. It should be noted that in our scheme accuracy is calculated by number of correctly detected image. All algorithms are able to detect all types of forgery with respect to total no images. Results are represented in Table 7. Comparison graph of performance analysis for image forgery detection is shown in Fig. 23.
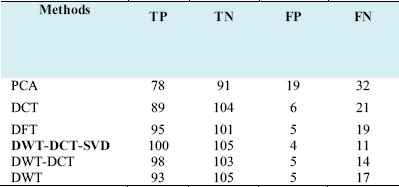
Performance Parameter Analysis for Image Forgery Detection.
Images Based Accuracy Calculation for Image Forgery Detection Obtained from Values in Table 6.
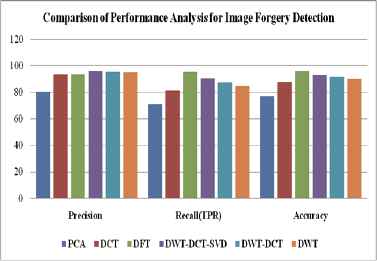
Comparison Graph of Performance Analysis for Image Forgery Detection Based on Values in Table-7.
It can be directly seen from the table that DWT-DCT-SVD gives highest precision and accuracy.
It can be seen here also that DWT-DCT-SVD gives highest accuracy and precision.
5.5. Performance Analysis for Image Forgery Classification
The performance of proposed fuzzy based classifier is given in Table 8 below. 100 images were randomly chosen from MICC-F220 and CASIA dataset [14, 15] and undergone through Gaussian Noise addition, Motion Blurring, Intensity variation and Normal forgery respectively. Hence a total number of 1600 images with 4 dataset were experimented by our proposed algorithm. Fuzzy logic was supposed to classify the distortion performed on the image after the detection of forgery. Out of 1600 images, 387 images were successfully classified in as normal forgery, 384 were classified as Noise addition based forgery, 357 as blurring and 378 as were detected to be undergone through intensity variation based attack. The overall accuracy provided by the algorithm was 94.12 % in terms of successful classification. Accuracy Result for Fuzzy based forgery classification system tabulated in Table 8 and presents the result of Accuracy Result for proposed fuzzy based classifier including four test scenarios. Accuracy Result for Fuzzy based forgery classification system is shown in Fig. 24.
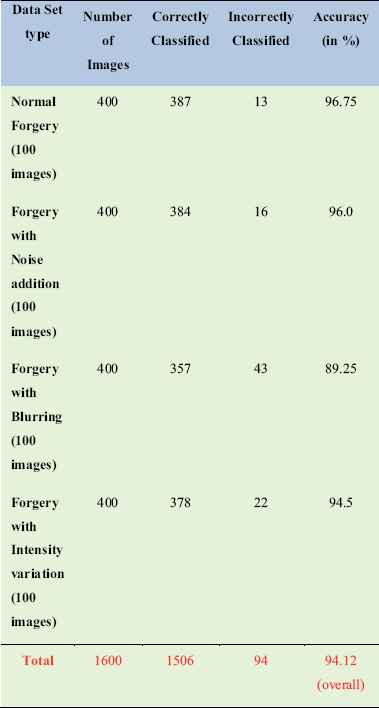
Accuracy Result for Fuzzy Based Forgery Classification System.
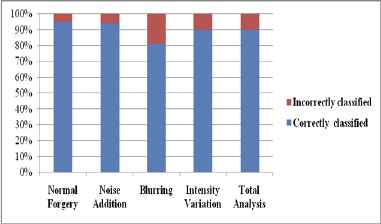
Accuracy Results for Fuzzy Based Forgery Classification System.
5.6. Performance Analysis of the Proposed Algorithm under Various Attacks on the investigated Image
This section tries to have a look at the authenticity of the algorithm under various types of attacks, generally encountered in image forensics like Gaussian Blurring, addition of Gaussian white noise to the image, Intensity variation etc. This section will depict the precision and recall rates of the methodology under typical attacks and that too with different parameters. It also affirm the false positive rates of algorithm under varied conditions and eventually elicit by its small values that the methodology is going to be a precious tool in the Image Forensic cases.
5.6.1. Effect of Gaussian (Motion) Blurring
It is also found that the hybridization of the methods has given more enthusiastic results than those given by the other techniques individually. Also, it is found that as the standard deviation corresponding to the Gaussian blurring increases, keeping the variance fixed, the geometry of the recall and precision rates obtained by simulation steeps down in a narrow manner. Similarly, as the variance is increased, a very similar trend is attested. This can be explained by the fact that as the variance or the standard deviation increase, the disturbance in the pixels increases and thus the overall efficiency decreases. As desired, very small values of false positive rates are obtained, thus increasing the reliability of the algorithm. It achieves maximum accuracy of 77.23%. It also provides TPR and Precision are 97.8% and 98.2%. The images shown in Fig. 21(e)–(f) below explain the scenario in a crystal clear manner. Performance analysis (Effect of Gaussian (Motion) blurring) for different values of standard deviation is tabulated in Table 9 to Table 12.
| Methods | TPR | 3×3 Precision | FPR | TPR | 4×4 Precision | FPR |
|---|---|---|---|---|---|---|
| DWT | 0.941 | 0.963 | 0.068 | 0.911 | 0.928 | 0.078 |
| DCT | 0.934 | 0.946 | 0.092 | 0.895 | 0.915 | 0.095 |
| PCA | 0.921 | 0.935 | 0.078 | 0.886 | 0.904 | 0.085 |
| DWT+DCT | 0.956 | 0.971 | 0.062 | 0.937 | 0.942 | 0.079 |
| DWT+DCT+SVD | 0.978 | 0.982 | 0.054 | 0.954 | 0.964 | 0.067 |
| DFT | 0.928 | 0.946 | 0.072 | 0.918 | 0.929 | 0.081 |
Performance Analysis for Effect of Gaussian (Motion) Blurring (ω=3 and σ = 0.5).
| Methods | TPR | 3×3 Precision | FPR | TPR | 4×4 Precision | FPR |
|---|---|---|---|---|---|---|
| DWT | 0.924 | 0.948 | 0.071 | 0.902 | 0.913 | 0.080 |
| DCT | 0.912 | 0.924 | 0.096 | 0.891 | 0.905 | 0.097 |
| PCA | 0.904 | 0.917 | 0.080 | 0.878 | 0.887 | 0.087 |
| DWT+DCT | 0.937 | 0.949 | 0.067 | 0.923 | 0.928 | 0.083 |
| DWT+DCT+SVD | 0.954 | 0.968 | 0.059 | 0.936 | 0.948 | 0.073 |
| DFT | 0.918 | 0.938 | 0.077 | 0.905 | 0.904 | 0.085 |
Performance Analysis for Effect of Gaussian (Motion) Blurring (ω=3 and σ = 1).
| Methods | TPR | 3×3 Precision | FPR | TPR | 4×4 Precision | FPR |
|---|---|---|---|---|---|---|
| DWT | 0.914 | 0.934 | 0.074 | 0.891 | 0.904 | 0.084 |
| DCT | 0.902 | 0.914 | 0.098 | 0.878 | 0.892 | 0.099 |
| PCA | 0.898 | 0.936 | 0.084 | 0.868 | 0.871 | 0.088 |
| DWT+DCT | 0.924 | 0.929 | 0.074 | 0.914 | 0.912 | 0.085 |
| DWT+DCT+SVD | 0.942 | 0.952 | 0.065 | 0.927 | 0.928 | 0.079 |
| DFT | 0.904 | 0.916 | 0.083 | 0.89.4 | 0.889 | 0.091 |
Performance Analysis for Effect of Gaussian (Motion) Blurring (ω=3 and σ = 1.5).
| Methods | TPR | 3×3 Precision | FPR | TPR | 4×4 Precision | FPR |
|---|---|---|---|---|---|---|
| DWT | 0.905 | 0.918 | 0.078 | 0.882 | 0.892 | 0.089 |
| DCT | 0.894 | 0.900 | 0.10 | 0.864 | 0.883 | 0.012 |
| PCA | 0.883 | 0.924 | 0.089 | 0.851 | 0.861 | 0.090 |
| DWT+DCT | 0.914 | 0.917 | 0.078 | 0.907 | 0.902 | 0.089 |
| DWT+DCT+SVD | 0.926 | 0.937 | 0.070 | 0.917 | 0.912 | 0.084 |
| DFT | 0.891 | 0.906 | 0.087 | 0.881 | 0.872 | 0.094 |
Performance Analysis for Effect of Gaussian (Motion) Blurring (ω=3 and σ = 2.0).
It can be seen from the data of all the above four tables (table 9–12) that as we change the parameters ω and σ (increasing σ from 0.5 to 2.0 in steps of 0.5 and keeping ω constant), TPR and precision is continuously decreasing while FPR is continuously increasing in each case. It is true for both 3×3 and 4×4 block size. One more key result to be noted is that corresponding values in a row for 3×3 blocks is always more than that of 4×4 in the column of accuracy and precision. But in the case of FPR, values corresponding to 4×4 are higher than the values corresponding to 3×3 sized block. From table-9 to table-12, it is clear that DWT+DCT+SVD give the highest precision, accuracy, and lowest FPR as compared to all other remaining reduction methods.
5.6.2. Effect of Addition of White Gaussian Noise
Additive White Gaussian Noise (AWGN) is a basic noise model used to mimic the effect of many random processes that occur in nature. Whenever white noise is added, this creates disturbance in the pixels of the image and thus the image is said to be tampered. The Signal to Noise ratio (SNR) is the measure of the extent of the noise added in the image. Now, take a look at the results obtained from simulation of the MATLAB Code, one trivia, common also to the previous analysis of blurring, is the increment in computational complexity of the image or relative decrement in the algorithm functioning efficiency with increase in the block size. This is used for lexicographic sorting. Also, as anticipated, increase the additive noise, SNR decreases and thus reduced Recall and Precision rates are obtained. This leads to an eventual hike in the False Positive Rate. It achieves maximum accuracy of 89.78%. It also provides TPR and Precision are 99.4% and 99.5%.The images shown in Fig. 2. (c)–(d) below explain the scenario in a crystal clear manner.
Extending the horizons, here, first of all, it is found whether the image is tampered or not and if yes, deduction of the image tampering is done with the help of a fuzzy classifier. This gives more zealous and authentic results. Performance analysis for (Effect of addition of white Gaussian Noise) with different SNR values is tabulated in Table 13 to Table 16.
| Methods | TPR | 3×3 Precision | FPR | TPR | 4×4 Precision | FPR |
| DWT | 0.981 | 0.987 | 0.032 | 0.972 | 0.973 | 0.036 |
| DCT | 0.988 | 0.990 | 0.030 | 0.978 | 0.985 | 0.033 |
| PCA | 0.912 | 0.984 | 0.056 | 0.897 | 0.912 | 0.061 |
| DWT+DCT | 0.992 | 0.994 | 0.028 | 0.984 | 0.986 | 0.031 |
| DWT+DCT+SVD | 0.994 | 0.995 | 0.026 | 0.988 | 0.987 | 0.029 |
| DFT | 0.942 | 0.956 | 0.048 | 0.931 | 0.946 | 0.054 |
Performance Analysis for Effect of Addition of White Gaussian Noise (SNR =50 dB).
| Methods | TPR | 3×3 Precision | FPR | TPR | 4×4 Precision | FPR |
|---|---|---|---|---|---|---|
| DWT | 0.976 | 0.979 | 0.034 | 0.961 | 0.966 | 0.039 |
| DCT | 0.980 | 0.984 | 0.032 | 0.964 | 0.973 | 0.036 |
| PCA | 0.907 | 0.976 | 0.060 | 0.881 | 0.904 | 0.065 |
| DWT+DCT | 0.985 | 0.985 | 0.032 | 0.972 | 0.972 | 0.036 |
| DWT+DCT+SVD | 0.987 | 0.988 | 0.028 | 0.974 | 0.974 | 0.031 |
| DFT | 0.934 | 0.943 | 0.054 | 0.926 | 0.929 | 0.060 |
Performance Analysis for Effect of Addition of White Gaussian Noise (SNR =40 dB).
| Methods | TPR | 3×3 Precision | FPR | TPR | 4×4 Precision | FPR |
|---|---|---|---|---|---|---|
| DWT | 0.961 | 0.964 | 0.037 | 0.954 | 0.958 | 0.042 |
| DCT | 0.972 | 0.976 | 0.035 | 0.958 | 0.967 | 0.038 |
| PCA | 0.896 | 0.964 | 0.064 | 0.875 | 0.894 | 0.069 |
| DWT+DCT | 0.972 | 0.978 | 0.035 | 0.964 | 0.966 | 0.038 |
| DWT+DCT+SVD | 0.978 | 0.980 | 0.030 | 0.969 | 0.964 | 0.033 |
|
|
||||||
| DFT | 0.926 | 0.934 | 0.059 | 0.912 | 0.918 | 0.064 |
Performance Analysis for Effect of Addition of White Gaussian Noise (SNR =30 dB).
| Methods | TPR | 3×3 Precision | FPR | TPR | 4×4 Precision | FPR |
|---|---|---|---|---|---|---|
| DWT | 0.948 | 0.954 | 0.040 | 0.939 | 0.945 | 0.046 |
| DCT | 0.956 | 0.967 | 0.037 | 0.942 | 0.958 | 0.041 |
| PCA | 0.882 | 0.956 | 0.068 | 0.867 | 0.875 | 0.072 |
| DWT+DCT | 0.968 | 0.969 | 0.037 | 0.958 | 0.954 | 0.040 |
| DWT+DCT+SVD | 0.972 | 0.971 | 0.032 | 0.954 | 0.953 | 0.036 |
| DFT | 0.908 | 0.921 | 0.062 | 0.902 | 0.897 | 0.069 |
Performance Analysis for Effect of Addition of White Gaussian Noise (SNR =20 dB).
From Table 13 to Table 16, it is can be seen that values of TPR and Precision, is continuously increasing as SNR value is decreasing. Value of FPR decreases as the SNR is decreased. It is also seen that corresponding values of TPR and Precision of reduction methods is higher in 3×3 blocks as compared to 4×4 blocks. But FPR values are less in 3×3 blocks as compared to the values in 4×4 blocks. DWT-DCT-SVD again shows maximum values for precision and TPR and lowest value for FPR.
5.6.3. Effect of Intensity Variation
Under this head, the effects of Intensity Variation are discussed on different algorithmic precursors, i.e., various transforms those are applied the variation of image contrast values. So that intensity of image can be adjusted, allowing a selectable tradeoff between storage size and image quality.
This section has dealt with this variation of Intensity and its effect on the Image and its subsequent detection by the proposed algorithm. Here, also, it is found that the trend as regards TPR and FPR remains almost same. The accuracy encountered is also very enthusiastic and as a matter of fact, hybrid method is the hot cake transform instrumentalised. Performance analysis for effect of Intensity Variation with different intensity values is tabulated in Table 17 to Table 18.
| Methods | TPR | 3×3 Precision | FPR | TPR | 4×4 Precision | FPR |
|---|---|---|---|---|---|---|
| DWT | 0.990 | 0.993 | 0.027 | 0.984 | 0.986 | 0.029 |
| DCT | 0.986 | 0.985 | 0.030 | 0.977 | 0.985 | 0.032 |
| PCA | 0.964 | 0.972 | 0.034 | 0.956 | 0.964 | 0.036 |
| DWT+DCT | 0.988 | 0.991 | 0.029 | 0.974 | 0.984 | 0.031 |
| DWT+DCT+SVD | 0.992 | 0.994 | 0.026 | 0.987 | 0.988 | 0.028 |
| DFT | 0.973 | 0.986 | 0.032 | 0.962 | 0.976 | 0.034 |
Performance Analysis for Intensity Variation.
| Methods | TPR | 3×3 Precision | FPR | TPR | 4×4 Precision | FPR |
|---|---|---|---|---|---|---|
| DWT | 0.982 | 0.987 | 0.024 | 0.976 | 0.979 | 0.026 |
| DCT | 0.978 | 0.986 | 0.027 | 0.965 | 0.978 | 0.029 |
| PCA | 0.953 | 0.966 | 0.029 | 0.948 | 0.956 | 0.032 |
| DWT+DCT | 0.979 | 0.986 | 0.025 | 0.968 | 0.977 | 0.029 |
| DWT+DCT+SVD | 0.987 | 0.989 | 0.022 | 0.978 | 0.979 | 0.025 |
| DFT | 0.962 | 0.975 | 0.028 | 0.957 | 0.967 | 0.031 |
Performance Analysis for Intensity Variation.
Reduce its size (for economical purpose), the pixels start getting compact and thus the quality and clarity of the image get suffered. The same conclusion is extracted from the tables enlisted below. The hybrid method gives very peptic results in this case. It achieves maximum accuracy of 96.78%. It also provides TPR and Precision are 99.2% and 99.4%.The images shown in Fig. 21(a)–(b) below explain the scenario in a crystal clear manner.
It can be seen from Table 17 and Table 18 that precision and TPR value of different reduction methods decreases with intensity variation. Precision and TPR for the same tool is lower when block size of 4×4 is taken. FPR value is higher in the case of blocks with size 4×4 as compared to 3×3. DWT+DCT+SVD shows highest value for precision and FPR but lowest value for FPR.
5.6.4. Effect of Copy-Move Forgery
Proposed algorithm also works quite satisfactorily as far as the detection of normal copy-move forgery is concerned. Copy move forgery is one type of tampering that is commonly used for manipulating the digital contents; in this case, a part of an image is copied and is pasted on another region of the image. The images shown in above Fig. 20. explain the scenario in a crystal clear manner.
Comparing with other types of attacks on the image, this is little bit easy to detect and it has been implemented. It is found, the normal trend is observed that DCT works very well. This is done by analyzing the low frequency coefficient matrix, obtained after applying DCT to the forged image. It achieves maximum accuracy of 99.17%. It also provides TPR and Precision are 98.8% and 99.1%.Performance analysis for Effect of Copy-Move Forgery is tabulated in Table 19.
| Methods | TPR | 3×3 Precision | FPR | TPR | 4×4 Precision | FPR |
|---|---|---|---|---|---|---|
| DWT | 0.965 | 0.971 | 0.034 | 0.963 | 0.969 | 0.035 |
| DCT | 0.980 | 0.986 | 0.026 | 0.965 | 0.984 | 0.027 |
| PCA | 0.954 | 0.940 | 0.041 | 0.950 | 0.937 | 0.042 |
| DWT+DCT | 0.977 | 0.982 | 0.029 | 0.969 | 0.977 | 0.030 |
| DWT+DCT+SVD | 0.975 | 0.984 | 0.030 | 0.970 | 0.979 | 0.032 |
| DFT | 0.988 | 0.991 | 0.022 | 0.981 | 0.986 | 0.024 |
Performance Analysis for Effect of Copy-Move Forgery.
In table 19, In Copy-Move forgery, DWT+DCT+SVD shows the maximum value and for every reduction method TPR, precision is higher when block size 4×4 is taken. FPR is lower for block size 4×4 as compared to 3×3 sized blocks.
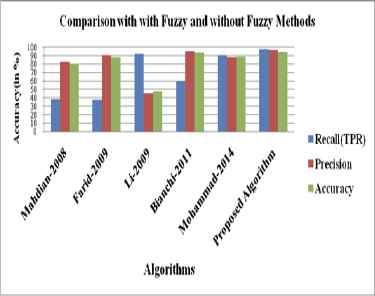
5.7. Comparison Study with Fuzzy and without Fuzzy Methods
This section, will try to develop a comparative outlook, in association with the algorithm designed in this paper with the related algorithms in the same field.
The peculiarity of this chapter over the previously developed algorithms is that in addition of applying the basic feature extracting transforms like DCT, DWT, etc. A Fuzzy based classifier is designed which, in crude words, will strive to refine the results fetched. A more novel approach in this paper is the prolific hybridization of the transforms, which has given a broader perspective regarding the utility and applicability of the feature extraction transforms.
Comparatively, the fuzzy logic proves to fetch the most authenticate results regarding the tampering of the image (authenticity), which is not discussed by any fellow in Image Forensics.
The performance parameters of this technique were compared with those of previously known techniques. As seen from above Table 20 and Fig. 25. The proposed technique provides acceptable values for all parameters. It achieves an accuracy of 94.12%. It also provides TPR and Precision are 97.18 and 96.12. Hence the proposed technique has a greater ability to detect a forged image as forged and an authentic image as authentic.
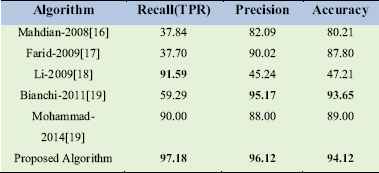
Comparison of Forgery Classification with Fuzzy and without Fuzzy Methods.
Graph for Comparison with the Fuzzy and without Fuzzy Methods.
5.8. Complexities in Calculations
This Section explains about computational complexities in our fuzzy system. We have used 7 tools in total and developed fuzzy system and its rules for classification of 5 post-processing methods on a forged image. Table 1 shows output of these tools (represented as 6 tools in total). There will be output patterns (including both standard and non-standard cases) depending upon output of each tool. We have considered only standard cases. Each tool will give either found or not found and thus If-then rules need to look for outputs for giving the desired output. The proposed fuzzy based forgery detection system is simulated on MATLAB (2013a). This system was build and developed on 32GB RAM, I7 processor, and windows 8. 8 minutes 14 seconds were consumed in detection of a forged area in an input image. Classification process by fuzzy system took 38 seconds to give output The proposed fuzzy based forgery classification system has been evaluated for four cases including images, without any post-processing, with noise addition (Gaussian noise), and with intensity variation and motion blurring. The proposed classifier has achieved 94.12% overall accuracy in classification of all test scenarios.
6. Conclusion and Future Scope
Block matching based forgery detection and fuzzy based forgery pattern classification system has been presented in this paper. Performance of digital forgery detection system for different dimension reduction approaches including DWT, PCA, DCT, DFT, DWT-DCT, and DWT-DCT-SVD has been evaluated and compared with varying block size and the size of copied portion. Simulation results presented in table-2 and table-3 shows that DFT based forgery detection system outperforms all the dimension reduction techniques in case of intensity variation and normal forgery (without any post processing) while DWT based technique is best suitable in case of noise addition and blurring. With the 56×56 sized copied part DFT based technique maximum accuracy of 94% (based on detection of total number of copied and detected elements) while in case of 81×81 sized copied portion the maximum accuracy achieved is 99.17%. The proposed fuzzy based forgery classification system has been evaluated for four cases including images, without any post-processing, with noise addition (Gaussian noise), and with intensity variation and motion blurring. The proposed classifier has achieved 94.12% overall accuracy in classification of all test scenarios.
References
Cite this article
TY  - JOUR
AU  - Mohammad Farukh Hashmi
AU  - Avinash G. Keskar
AU  - Vikas Yadav
PY  - 2016
DA  - 2016/04/01
TI  - Fuzzy Based Image Forensic Tool for Detection and Classification of Image Cloning
JO  - International Journal of Computational Intelligence Systems
SP  - 351
EP  - 375
VL  - 9
IS  - 2
SN  - 1875-6883
UR  - https://doi.org/10.1080/18756891.2016.1161364
DO  - 10.1080/18756891.2016.1161364
ID  - Hashmi2016
ER  -