
A Decision Support System Based on a Genetic Algorithm for the Utilization of Leftovers
- DOI
- 10.1080/18756891.2016.1175813How to use a DOI?
- Keywords
- Decision support system (DSS); Genetic algorithm (GA); Usable leftovers; Scraps; Matching problem; Optimization
- Abstract
There are usually some leftovers (usable pieces of raw material) and scraps (unusable pieces of raw material).generated after the completion of a manufacturing process. These leftovers consist of many different types, materials, styles and sizes so the use of such materials is difficult to manage, resulting in a significant material management problem for manufacturers. This study examines ways to use these leftovers and proposes the application of a genetic algorithm to handle the problem of matching usable leftovers to incoming orders. In order to verify the feasibility of the solution, a decision support system was implemented, based on a genetic algorithm. With lots of experimental results, we conclude this method is thus of considerable value to the managers of manufacturing factories.
- Copyright
- © 2016. the authors. Co-published by Atlantis Press and Taylor & Francis
- Open Access
- This is an open access article under the CC BY-NC license (http://creativecommons.org/licences/by-nc/4.0/).
1. Introduction
After the completion of a manufacturing procedure, there is usually a certain amount of scraps (unusable leftover material) and leftovers (usable pieces of raw material) generated. Since leftovers cannot easily be reused as raw materials in the manufacturing process, they are often sold to the recycling industry as waste. However, with better planning, we believe the leftovers can be reused, resulting in a tremendous reduction manufacturing costs. Cherri et al.1 indicate that leftovers are non-standard objects, even though their properties are the same as the raw materials used in the manufacturing process. Therefore, they can be regarded as a different style of the raw material. When the quantity of leftovers increases, enterprises need to manage their inventories, in order to make the best of the resources they have on hand. This can reduce costs and enhance competitiveness.
Industrial Surplus World2 estimated that $12.5 billion of scrap metal was exported by scrap yards throughout the United States in 2011. Thus, there is a significant amount of material that could be used more efficiently by the manufacturers themselves, and this is a real-world ‘combinatorial optimization’ problem, which is a complex issue. There are many such problems in the real world and these problems are often solved using heuristic algorithms. For instance, Santos et al.3 used a heuristic algorithm and developed a Decision Support System (DSS) that integrated Google Maps to process multiple vehicle routing problems. Studies on the management of usable leftovers mostly focus on minimizing scrap4,5,6. It is perceived as a stock reduction problem, which refers to the minimization of leftovers when cutting raw material to a fixed length or amount, and strives to avoid unnecessary wastage7,8.
There have been several studies on this issue. For example, Jahromi et al.9 proposed a method that used two metaheuristic algorithms, Simulated Annealing (SA) and Tabu Search (TS), to evaluate the one-dimensional problem of cutting stock efficiently. Dikili et al.10 developed a heuristic approach to solve the problem of reducing the stock of raw materials in ship production. Onwubolu and Mutingi11 adopted a Genetic Algorithm (GA) approach for the problem of reducing stock. These studies have mainly targeted ways to minimize the amount of scrap material. However, as far as we are aware, the stock problem has mostly been discussed from the viewpoint of raw materials; the raw material was a fixed standard object, and the usable leftover was a non-standard object. Recently, Cherri et al.12 regarded the usable leftovers, consisting of nonstandard objects, as another stock reduction problem, and solved it using a heuristic algorithm. This was to ensure effective utilization of these leftovers. It was found that the problem of non-standard objects could be solved through a stock reduction solution and by concentrating on the larger sized leftovers. Glover13 and Yang14 suggested that when any single method cannot solve a problem, it can be solved using different viewpoints or by integration with other methods. For example, Dyckhoff15 indicated that a solution could found from another viewpoint if a stock reduction problem is integrated with a bin-packing problem. For example, raw materials should be cut to a suitable length and placed in a box. In this case, the reduction demand is seen from the viewpoint of the box, which is different from the viewpoint of waste minimization. Thus, the optimization of waste consumption can be discussed from the viewpoint of the bin-packing problem.
The bin-packing problem is a typical optimization problem. One-dimensional bin-packing problems only consider box length, while two-dimensional ones consider both length and width. The three-dimensional ones examine all three sides (length, width, and height). In practical terms, the process of using leftovers differs in various industries. For instance, leftovers cannot be reused in the production of shock absorbers for automobiles and motorcycles because the sheer volume of production. Other industries also face this problem. For example, the process of manufacturing aluminum windows requires both machining and assembling, and the main components are aluminum frame and glass. The frame is one-dimensional and includes both outside and inside frames, and any material that remains after cutting the length of the frames as per the other specification can be counted as leftovers.
Heuristic algorithms offer a mature and reliable approach to evaluation. They can be used to find approximate solutions and, at times, optimal solutions. The current popular meta-heuristic algorithms include: Simulated Annealing; Tabu Search; Threshold Accepting (TA); Particle Swarm Optimization (PSO); Ant Colony Optimization (ACO) and GA. Generally, a heuristic algorithm can provide solutions for specific problems. Although meta-heuristic algorithms are known for solving similar problems, they cannot be applied to all problems, and cannot achieve the expected optimization for all problems. Lee and Geem16 and Arostegui Jr et al.17 indicated that it is usually difficult to ‘mathematize’ the solution, and that planners need to have relevant experience and mathematical knowledge. Thus, suitable meta-heuristic algorithms should be selected for different problems. With regard to combination matching, most of the related studies have used GAs, which are general metaheuristic algorithms that can be extremely efficient, and that have been applied to many optimization problems. For example, Liu et al.18 proposed a local search-based genetic algorithm, and found it to be effective and efficient for discovering community structure. Zakaria and Petrovic19 applied GA to conduct match-up rescheduling with non-reshuffle and reshuffle strategies, and the results showed both accuracy and efficiency. Paszkowicz20 and Vallada and Ruiz21 stated that GA can broadly applied to the area of stochastic search and optimization techniques, and thus, is helpful for solving complex problems. Comparing GA to other methods, Mastrolilli and Gambardella22 and Zhang et al.23 considered GA as being superior to greedy algorithms in the scheduling of pairings. Arostegui Jr. et al.17 compared GA, Tabu Search, and Simulated Annealing. Their findings show that the initial result of GA was not good. However, with the passage of time, the final result of GA was better than that of the other methods. Hassan et al.24 compared the difference between GA and PSO for typical problems of spatial optimization. The two algorithms can produce high-quality solutions. Although PSO can produce a more robust result, GA is faster and more efficient than PSO. For the bin-packing problem, Hopper and Turton25 consider GA as a very useful analysis tool. Using this method to solve the bin-packing problem is similar to methods that combine or pair problems. For example, for 2D graphs, the methods are paired to determine the minimum space. Thus, GA can be used to design a heuristic framework for each individual case, which is a useful method. However, the scope of GA can be extended through various applications. In the current study, we constructed a GA procedure to solve the problem of focal optimization.
For both the manufacturing and services industries, the researchers of the problems facing real-world operations should take advantage of the continual innovations in information technology, as they can help to improve a firm’s competitive advantage26. The approach taken in this study relies on DSS, which can be used to find solutions to semi-structured and unstructured problems27,28, and has been used in numerous studies. For instance, Wang et al.29 developed a DSS based on particle swarm optimization to solve sub-stage-zoning filling problems. Mendoza et al.30 used a routing algorithm embedded in a DSS, which combined a modified Clarke and Wright (C&W)31 savings heuristic and a GA. Repoussis et al.32 employed an enhanced Dijkstra algorithm33 to produce a DSS for vehicle routing and scheduling problems. On the basis of the results of these earlier studies, this study applied a heuristic algorithm to solve the problem of matching and using leftovers. By using this algorithm to develop a DSS, the results obtained can be clearly and simply presented. This system was then tested using a simulation of a real case to validate the usefulness and reliability of the method.
2. Problem description
Since the sizes of usable leftovers differ from the sizes of the raw materials, which are of a fixed size, an efficient and flexible Bill of Material (BOM) listing all the parts and sub-assemblies required to manufacture a product has to be designed in order to utilize these leftovers The research problem becomes more complicated with the increasing number and quantity of very different leftovers and an efficient method is needed to solve the problem. This research only addresses a one-dimensional aspect of the problem of leftovers; only the length of the material is used as a major hypothetical variable. Other special conditions, such as cost and weight, are not considered.
The study considered a real case. Boker Information is a software firm specializing in developing business information systems. The firm was founded in 1993 and serves the industry that manufactures aluminum windows and similar products. The firm has served other industries in the past, and the general operations management and management information systems of many companies have been developed. At present, Boker Information is developing high value-added information systems for enterprises, and providing consultant management services to increase their operating revenue. This study used information provided by an aluminum window company currently served by Boker Information. The aluminum window producers have stated that they have a large amount of leftovers and would like to consume them first when an order is placed, in order to reduce costs. In this case, the quantity of leftovers would be considered first, before the quantity of raw materials to be ordered is computed. Complex computation is required, but Boker Information has little experience with this type of problem. This study provides a practical solution by developing an appropriate module. Thus, the problem is defined as follows:
- 1.
Assuming that the production process uses raw materials that have been cut and used, the remaining materials are divided into scrap and leftovers and these are identified on the basis of the required length in the general order. Usually, the scrap materials are too short to be used (e.g., less than 30 cm.), whereas the leftovers are long enough, and thus are classified as part of the inventory of usable materials.
- 2.
When a new order is received, the manufacturing processes are planned so as to enable the use of the leftovers first, followed by the use of other raw materials.
- 3.
Even if all the usable leftovers are consumed, new scrap and usable leftovers will continue to be produced. If the length of these materials can be used to fill an order (i.e., if they are greater than 30 cm), then they will still be classified as part of the usable leftover inventory.
- 4.
If the length of new usable leftovers can meet the requirements of an order, then their use is prioritized.
This study examined the problem of matching leftovers and order lengths, assuming that bin-packing needs many bins, and that each item can only be put into one bin. However, the above conditions differ slightly from the bin-packing problem. First, usable leftovers can be ignored when they are not consistent with the requirements, although in some cases they can be packed separately. Second, it may not be possible to reuse these leftovers immediately, and thus, they could be classified as new inventory. The solution to the bin-packing problem is to optimize the bin use, but this problem is a consumption-matching problem. In summary, this problem occurs at the production stage, and thus, it is different from the bin-packing problem, which occurs at the shipping stage. However, the goals are the same with both problems and the solution for both can be determined by matching two groups. Therefore, the research findings of this study could also be used to address bin-packing problems in future studies.
3. Model
3.1. Notations
On the basis of the problem’s definition, the method proposed in this study matches up the supply of the leftovers with their demand, in order to optimize usage. We observed the values of the computer database field structure in order to understand the complexity of the problem, and then defined the relevant notation. Both the order form and the data structure for the leftovers are the same. The notations are listed as follows:
- usbleL(xi):
usable leftovers’ length.
- usbleN(xi):
usable leftovers’ quantity.
- count(usbleN(xi)):
total count of usbleN(xi).
- bomL(xi):
length the incoming order needs.
- bomN(xi):
quantity the incoming order needs.
- xi:
each sample, i = 1, 2, …, n. n denote the elements of an nth sequence number.
For example, if the orders require 4 different frames (4 different bomL(xi)), then, the series combinatorial number is 4!. So, the more the orders (frames), the larger the series combinatorial numbers. Thus, in order to distinguish the product order data, we suppose that Newbom is a collection of series combinatorial number as follows:
Newbom(E,Vj) is a random multiple-set event from Newbom where,
- E :
Indicates a certain subset (series).
- Vj:
Indicates a subset event, the quantity of the product order needs, j = 1, 2, …, n. n denote the elements of an nth sequence number.
Using the following example,
Then Newbom(2,2) and Newbom(4,3) are equal to 70 and 100 respectively.
3.2. Mathematical model
In the original data structure, both the quantity of leftovers and the order demand are used as variables so that these two quantities can easily be compared. They are both decomposed into space to create a single observation. Thus, we also suppose that Newsb is a multiple-set event, and that it is repetitive in nature as below:
- Newsb:
indicates all sample of usable leftovers’ length.
- Newsb(Xt):
indicates a leftover, t = 1, 2, …, X. X denote the elements of an nth sequence number.
In other words, Newsb is the new arrangement of usbleL(xi), and has many records. For example, if database has three records in leftovers, then, Newsb has 11 records (see Fig. 1).
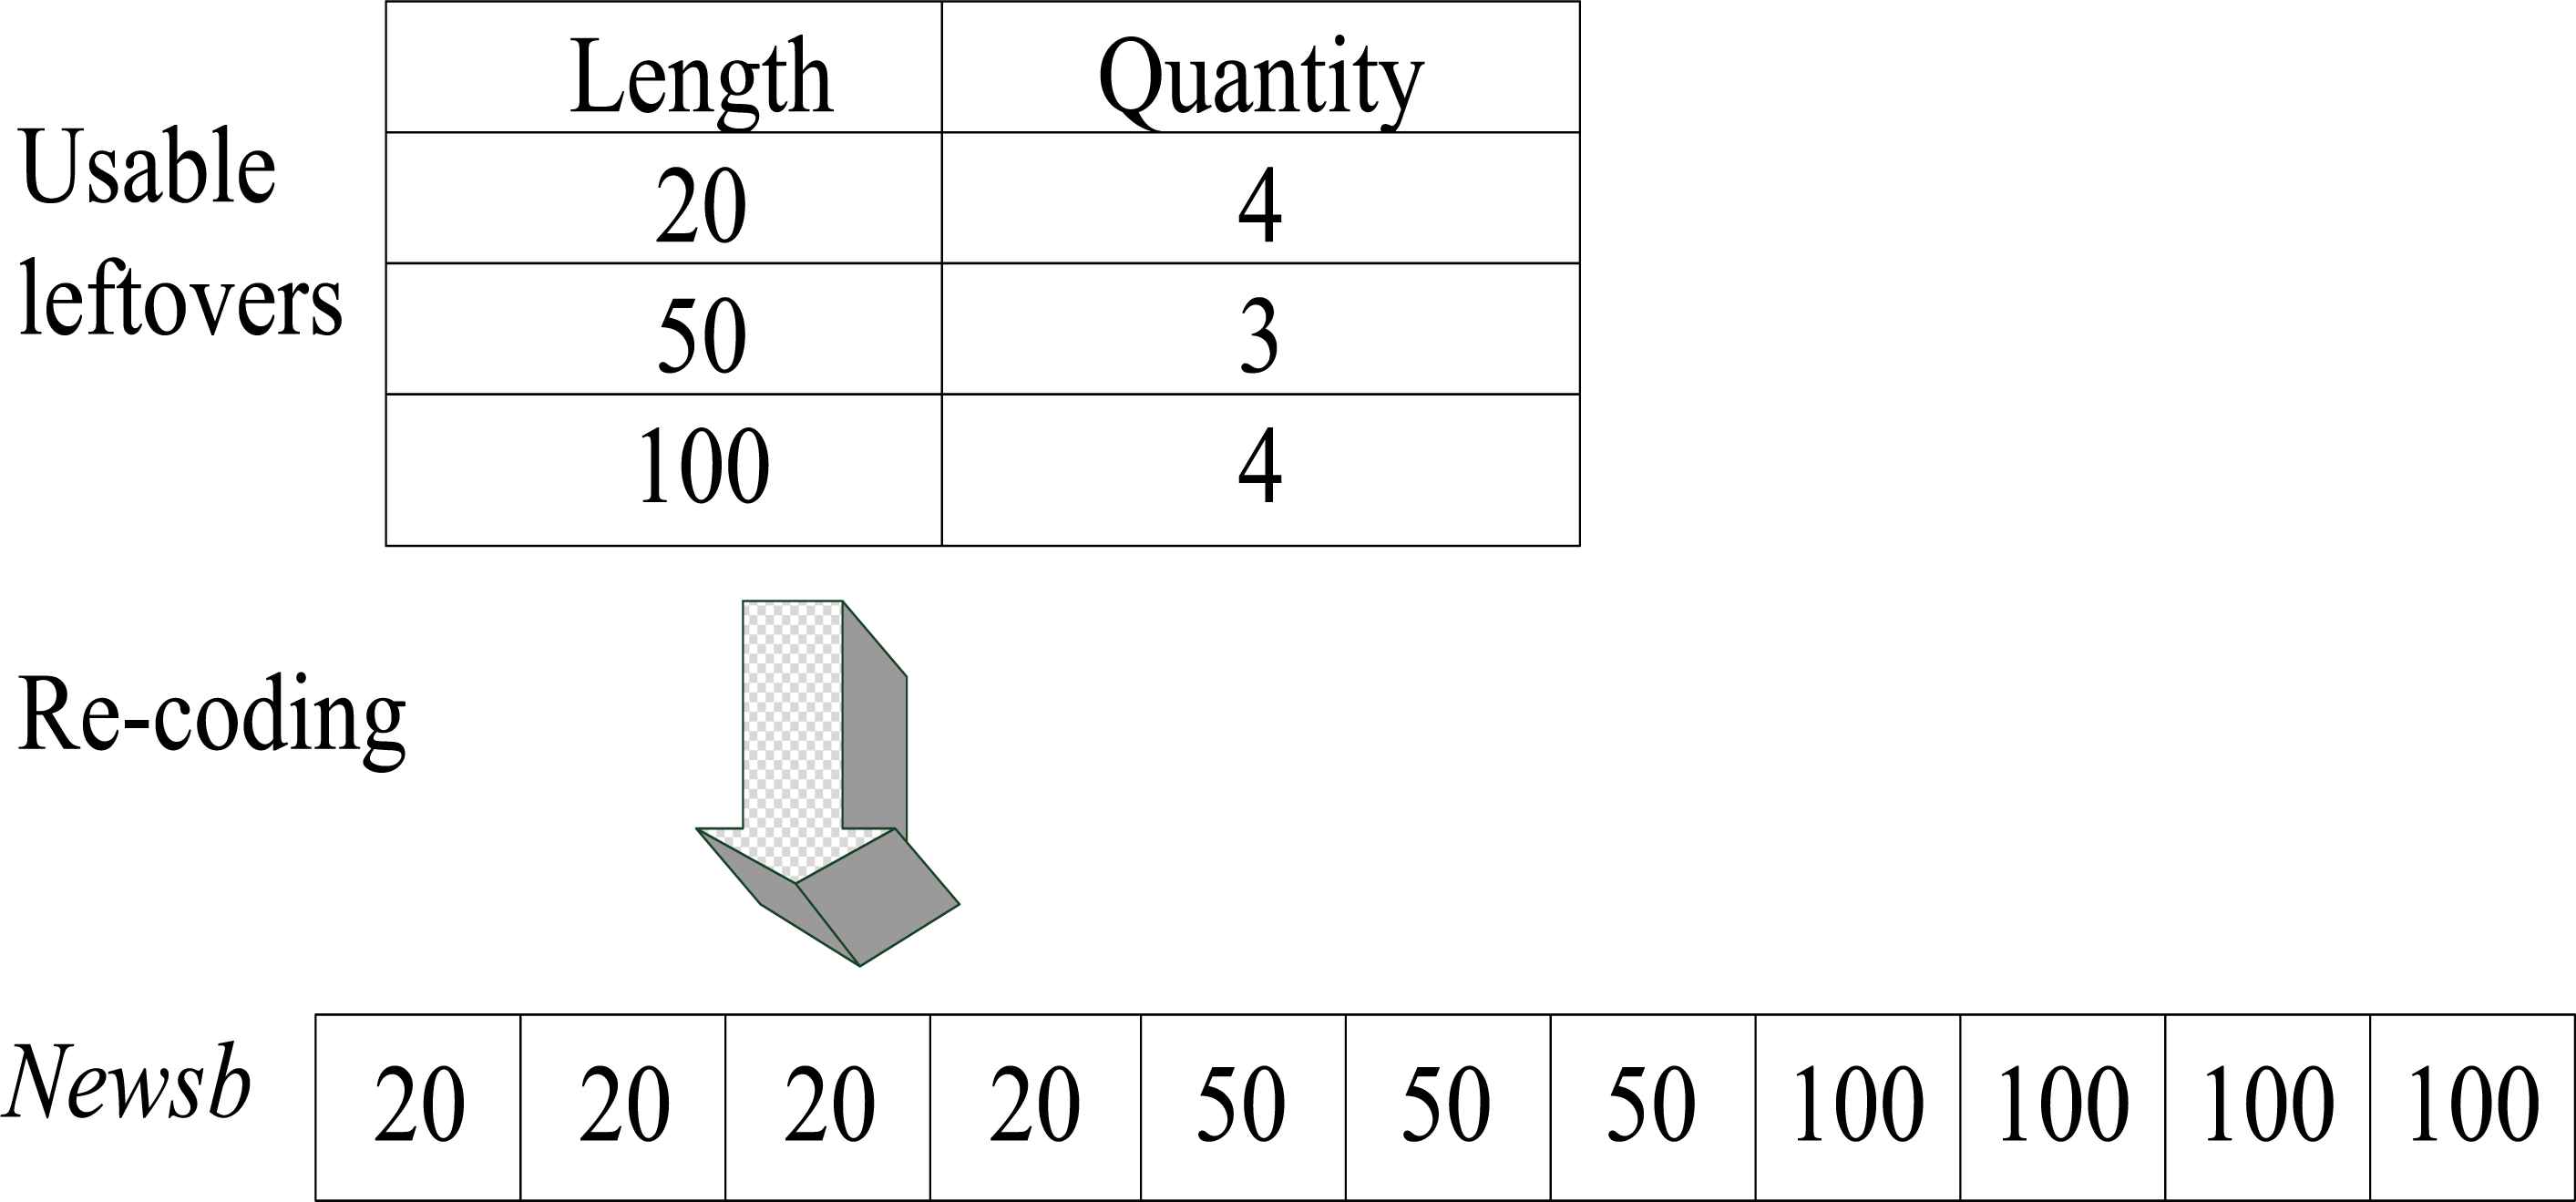
An example of Newsb
Assume Newsb(Xt) randomly draws out one record from Newsb, which can be used to compare with random Newbom(E,Vj). This is summarized as follows:
In Equation (3), Newbom(E,Vj)’s length must be less than the Newsb(Xt). To evaluate the gap, this is given by the following equation:
- Ocl:
indicates a gap between Newsb(Xt) and Newbom(E,Vj), j = 1, 2, …, n. n denote the elements of an nth sequence number.
- Ocl β :
new leftovers: Indicates a set of Ocl.
- Ocl β (X1):
indicates a value from Ocl β.
Otherwise, if
If Newbom(E,Vj) ≦ Newsb(Xt) for any j and t does not occur, there is not enough usable leftover stock or length to meet the orders. The system will record it and calculate the percentage of the value in the total number of matches. This means a successful probability of matching - match success rate. If all the fitness functions are consistent, the ratio becomes an important observation indicator.
We coded a judgment rule, which is obtained after cutting materials that are either scrap or new leftovers. These parameters are given collectively as below:
- P:
indicates a judgment value.
- Ock θ :
indicates a scrap material length, k = 1, 2, …, n. n denote the elements of an nth sequence number.
In general, P is 30 cms. However, P may change due to variations in production strategy, and thus, the information system functions can be defined by the user. Finally, the notation below is given in defining the fitness function:
Z is a fitness function, which indicates minimizing the scrap material.
In order to facilitate an understanding of the mathematical model used in this study, Fig. 2 presents a sample of matching process. First, leftover minus order form will get Ocl. If Ocl >P (set 30) it is classified into new leftovers (Ocl β), and the rest is classified as scrap material (Ock θ). When finding the new leftovers can totally minus “order form”(Newbom(E,Vj)), execute Equation (6) and then run the next record. Repeat this procedure until the end. Finally, we summarize all scrap materials to get a fitness function.
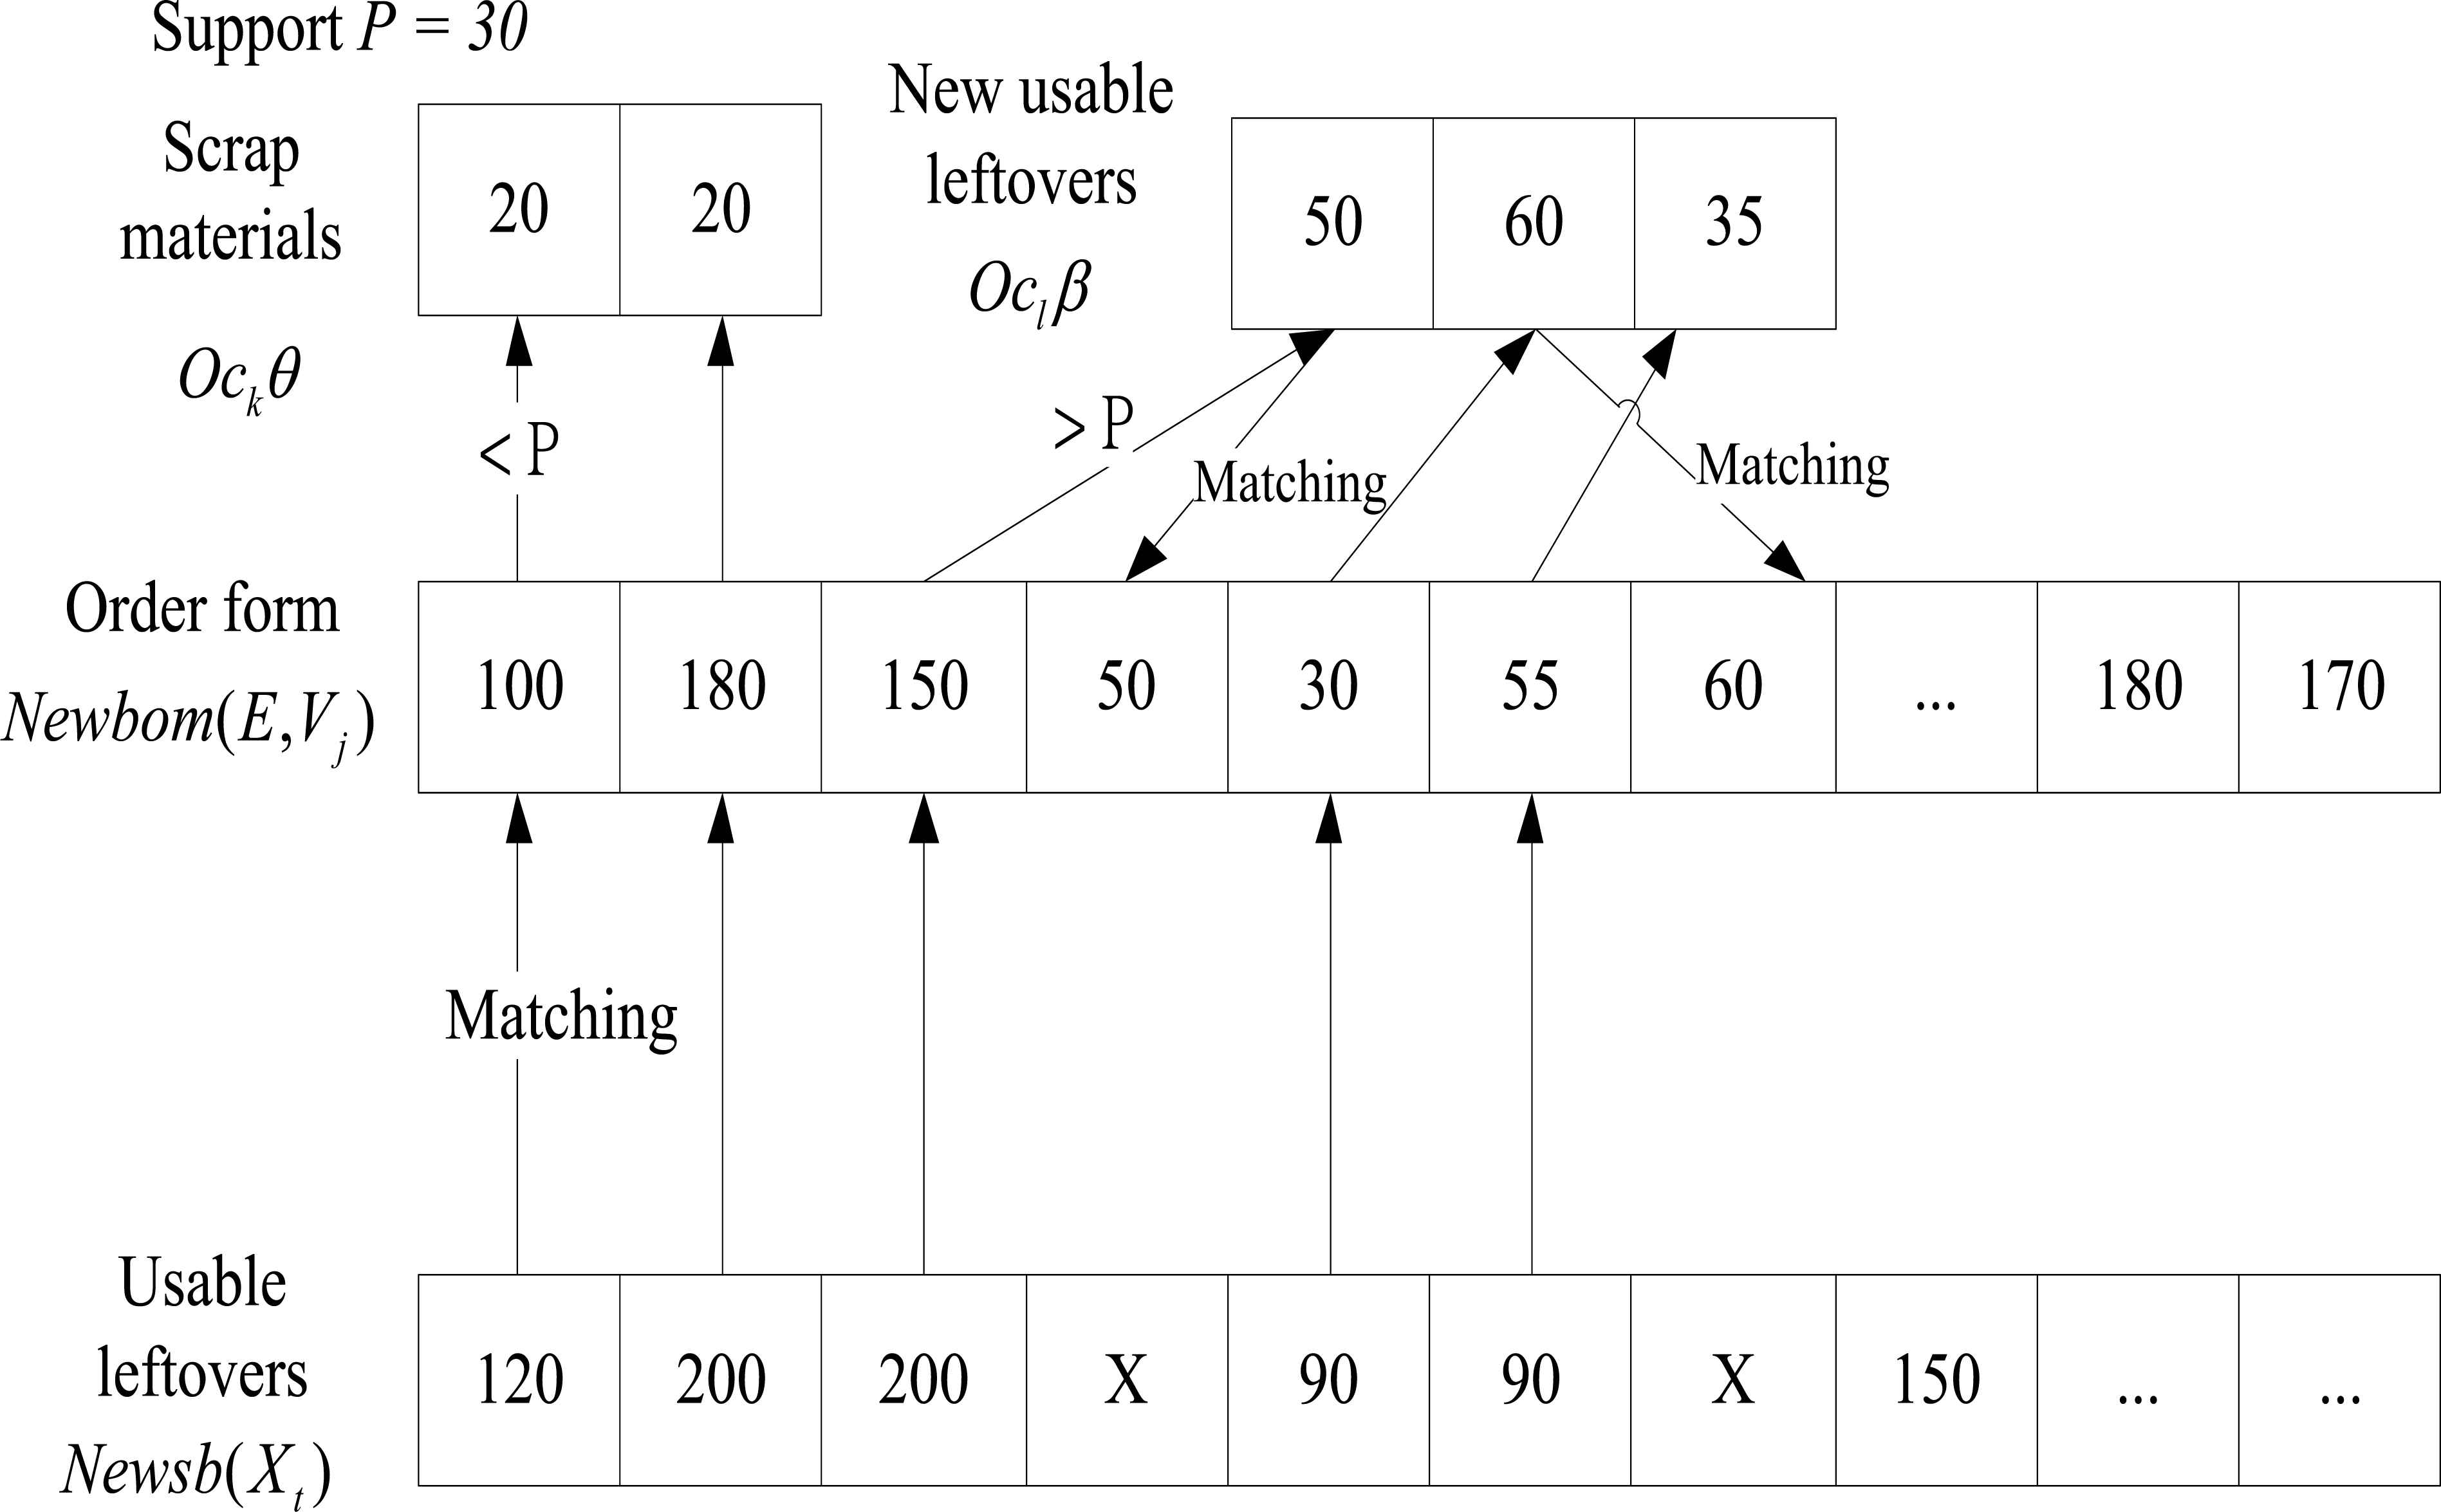
An example of the proposed method
This approach uses sequence matching in a random series to find the best solutions. However, as the sets’ Newbom increases, calculation becomes more difficult and only one fitness function may not be a good solution. Thus, this study applies a genetic algorithm to address this issue.
3.3. Genetic algorithm
Genetic algorithm was first proposed by Holland34, based on the concept of genetic evolution, and has since been applied in many fields with successful results. For example, Fan et al.35 applied a GA search heuristic to solve the matching/ranking of documents in an information retrieval (IR) system, while Basnet and Weintraub36 presented a multi-population GA to evaluate the supplier selection problem. This theory is widely used in research. Holland described a simple genetic algorithm (SGA) in 1975, with an architecture that makes it very easy for readers to understand how it is implemented, and this process is shown in Fig. 3, taken from Vidyarthi et al.37 In this example of the implementation of SGA, genes are initially selected randomly before calculating the fitness function, which then identifies the elite genomes, and this is followed by evolution operations. Evolution operations usually use three methods: selection, crossover, and mutation. This process is repeated until the termination conditions are reached.
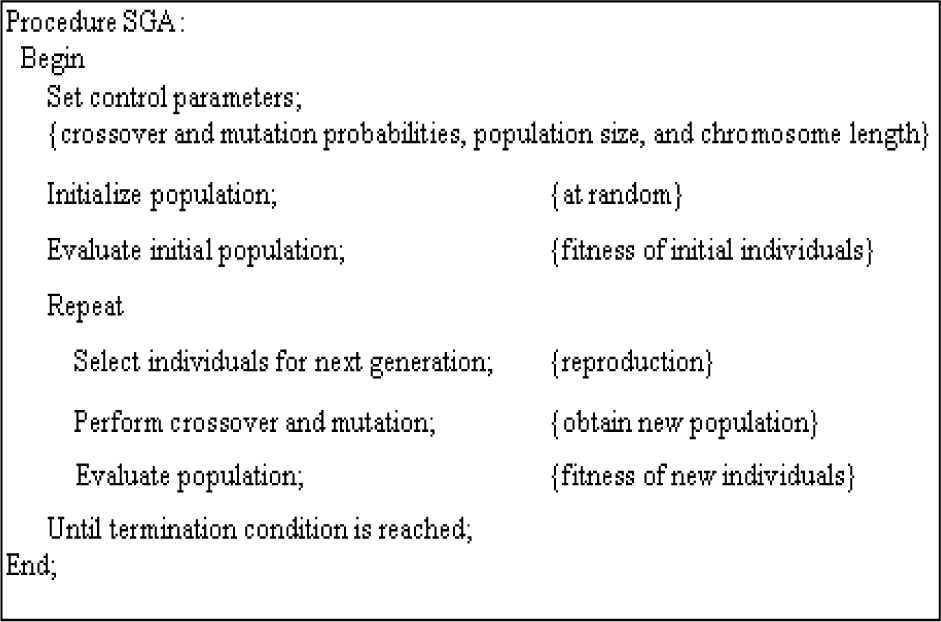
The pseudocode of SGA (Source: Vidyarthi et al.37)
Our study used the general structure of the SGA presented above to estimate the fitness function, using the following steps:
- Step 1:
The required order length is encoded into the data set of Newbom, while the usable leftover pieces are encoded into the set of Newbom to consistently present the two groups of data.
- Step 2:
The results of the random selection times from Newbom were selected as the initial group, and the fitness function was then calculated on the basis of this. According to the parametric conditions in the example, the k elite chromosomes are retained as the parent group.
- Step 3:
In the example, individual chromosomes were selected from the parent group, and then the evolution program was implemented. The probability that Steps 4-6 will occur is determined by the pre-set control parameters.
- Step 4:
The selection part of the evolution program was then executed. This process uses the elite selection method to retain the parent chromosomes, and then obtains the cumulative k’ chromosome groups.
- Step 5:
The crossover part of the evolution program was executed. Crossover refers to the production of a new chromosome by the process of two chromosomes exchanging genes at specific crossover points. The execution method used in that study divided a series (Newbom) split into two chromosomes and adopted a two-point crossover to exchange genes between them38, thus producing a new chromosome. In our study, this value was then used to recalculate ways to minimize the leftovers, as this will increase the likelihood of obtaining a globally optimal solution, rather than a local one.
- Step 6:
In the genetics example, the process of mutation means the complete change of chromosomes, and this generally occurs less often than crossovers and to prevent the results falling into a local optimum. The mutation part of the evolution program is executed by re-encoding the parent chromosomes and looking for match-ups to prevent falling into a locally optimal solution.
- Step 7:
Even when the fitness function is obtained, it may not necessarily be an appropriate solution. Since, in practice, the production strategy will often change, the basic design of the terminating conditions mainly depends on the number of times the parameters undergo evolution. The terminating condition has different mechanisms; by user needs, the evolutionary process will stop. If the terminating conditions are not satisfied, then there is a return to Step 3 to continue evolution.
Besides the applied two-point crossover, this study used a partially matched crossover (PMX) operator to execute the gene crossover process. Our PMX method assumes that the length of the gene - and only the length - can match the length of usable leftover pieces (see Fig. 4). Given this case, the matched gene will not be captured as an exchange point. This approach is designed to allow only fixed chromosomes and therefore avoid a random escape from the original solution space. When adopted unmatched chromosomes do exchange, the matching chromosomes is fixed, so it is expected that this will reduce the possibility of increasing the amount of scrap materials.

An example of partially matched crossover method
4. System implementation
There are many different system architectures for DSS. Luo et al.39 adopted an agent grid-supported dynamic sensor to carry out a DSS for use with floods. Shan et al.40 presented a Shanghai emergency management DSS that consists of ten modules and that can support emergency plans. There are also DSS implementations for Web-based architectures3,41 and mobile devices42,43. The DSS proposed in this paper is developed in C++. To more effectively evaluate the simulation efficiency and results, the program is mainly composed of locally hosted Windows applications. In general, a DSS should be composed of three core components, including: (1) user interface; (2) database; and (3) model base28,44. Thus, we introduce the implemented system in this work as follows:
(1) User interface
The program development platform is written in Borland C++, and there are helpful graphics on the user interface. User operations are executed using the one-click method, which is an intuitive way of interacting with the system. The system presents the simulation results using DB grid objects, with different colors to highlight different parts of the final results.
(2) Database
The program is linked to the database through ActiveX Data Objects (ADO), which must thus be installed before the system can be used. The database itself is not fully consistent with the principle of normalization, as decision-making problems are mostly semi-structured and non-structured ones. Moreover, the amount of data used will increase or decrease along with the size of the sample, and the data structure only supports the first principle of normalization.
(3) Model base
This study analyzes problems on the basis of heuristic algorithms, and thus, it is a near optimal analysis model. The near optimal model aims to determine the near optimal value of a variable on the assumption of some restricting parameters or conditions. With regard to the system functions, this paper designs two different methods (two-point crossover and PMX method) for the analysis of the consumption matching problem for leftovers of raw materials. The system allows some parameters to be modified in order to provide flexible solutions, including the number of parent genes, number of times gene evolution will occur, and the parameter P, so that users can use it under different conditions. The sample screen for this system is shown in Fig. 5.

A snapshot of user interface
5. Experiments
To validate the usefulness of this method, this study used data of the aluminum window manufacturing company gathered by Boker Information. The data in the company’s database changes every day; for this reason, if the system directly accesses it, it may cause problems. Therefore, we extracted various related data (e.g., about orders, usable leftover pieces, etc.) from the database to avoid interfering with the firm’s information system. This avoids distortion of extreme values and makes evaluation reasonable.
The large number of samples and the simulated data obtained can be used for reliable estimation45. Thus, after the data were obtained, study adopted a bootstrap simulation of the usable leftover pieces of raw material, which was used to increase the number of samples. The bootstrap method adopted uniform distribution. Finally, there were seventeen different lengths of usable leftover pieces of raw material. The mean value of the amount of usable pieces was 37.94, with allocated data as shown in Table 1.
| Usable leftover code number | Usable leftover _length (cm) | Usable leftover_amount |
|---|---|---|
| 1 | 30 | 43 |
| 2 | 40 | 42 |
| 3 | 46 | 35 |
| 4 | 54 | 40 |
| 5 | 70 | 36 |
| 6 | 75 | 37 |
| 7 | 89 | 32 |
| 8 | 95 | 40 |
| 9 | 100 | 35 |
| 10 | 106 | 40 |
| 11 | 110 | 39 |
| 12 | 115 | 36 |
| 13 | 120 | 39 |
| 14 | 128 | 31 |
| 15 | 135 | 37 |
| 16 | 140 | 47 |
| 17 | 170 | 36 |
Usable leftovers data.
5.1. Experiment description
The experimental design uses the random assumption environment. The aluminum windows were ordered in normal style and number. There are thirty different order structures, including some special, extreme orders (processing a rectangular window order). Each order uses two methods (two-point crossover and PMX method) and contains eight windows. The lengths of the eight windows approximate the designed length for each experimental environment. It is a general number of this company. All eight windows represent 32 sides (four sides per frame); some sides have the same length, and the bases of the eight windows differ so that the mathematical combinations used to estimate the occurrence of all units result in 32 solutions. In the inventory of leftovers, there are seventeen types or sizes, amounting to 645 leftovers.
To maintain consistency in the simulation background, the same conditions were set for each experiment. Assume that P is 30 as problem description, this and the conditions for the other detailed parameter settings are shown in Table 2. Genetic evolution is adopted elitism, and only optimizer values will be parent chromosomes. The gene population size is twenty, meaning that each generation reserved twenty records, but the first generation (initialization) has 100 records. In addition, concerning our computer simulation equipment, the CPU processing speed is 2.2 GHz, RAM is 2 GB, and the operation system is Windows XP. This computer hardware equipment is similar to the equipment of the production department of the enterprise under study.
| Parameter | Settings value | |
|---|---|---|
| Simulation times | 5,000 | |
| Simulation parameter P | 30 | |
| Record of usable leftovers | 17 | |
| Amount of usable leftovers | 645 | |
| An order record | 8 (32 frames) | |
| Genetic Algorithms | ||
| Evolution selected strategy | Elitism | |
| Initialization | 100 | |
| Population size | 20 | |
| Crossover probability | 0.85 | |
| Mutation probability | 0.01 | |
| Evolution terminating conditions | 1. | fitness function = 0 |
| 2. | fitness function ≦ 30 | |
| 3. | when evaluation time > 30, fitness function constant | |
Simulation parameter settings
This study set three terminating mechanisms in an optimization simulation as follows: 1) when the fitness function is zero, the global optimal solution has been met and the evolution is stopped; 2) when the fitness function is less than or equals thirty (meaning that the sizes of the materials are very small), few overall scrap materials account for a value lower than P and the evolution is stopped; 3) when the total amount of scrap materials is evaluated, and the evolution is continued for thirty times, this means that samples n> 30 and the evolution is stopped when the total amount of scrap materials is the same as that before evaluation. This means that results for gene evolution are unlikely to provide better results and thus, the evolution is stopped. Although there are conditions for terminating the evolution, this study’s design calls for the maximum number of evolutions to be 5,000 in order to evaluate the basic set-up parameters of gene evolution.
To describe the pros and cons of the experimental results, four values are used as observed criteria.
- •
Fitness function (Z value): The purpose of the fitness function is calculated for the minimum Z. Thus, the Z value is an important observed criterion. In general, the Z value must be as small as possible, meaning the lengths of the usable leftovers are broken down into smaller units.
- •
New usable leftovers: In the pairing process, some leftovers are longer than the P value; they are the new leftovers. The new leftovers can be used in the next round of matching. Sometimes, when order structure meets fitness function, it may leave a high amount of new leftovers. Therefore, the new leftovers can be used as an observation index.
- •
System simulation time: In this study, we observed system simulation time, in order to understand the efficiency of different methods. We believe, regardless of which method is used, the calculation will completed far more quickly than human assessment methods. This is the advantage of using information systems to access complex issues.
- •
GA evolution iterations: GA evolution iterations are an expression of how many times to evolution. We can use this to learn the iteration amount in the calculation of genes until the termination conditions are met. This can be used as an observation index of the efficiency of an algorithm.
5.2. Results and discussions
Appendix A shows the results of two methods, and some experiments were given a longer evolution time. We observed that these order structures have maximum and minimum length requirements. This indicates that the extreme values (too long or too short) will affect the efficiency of the computation. We observed in all experiments that the PMX method took the longest amount of time, but also obtained the best fitness function. Fig. 6 shows the statistics of the experiments for the fitness function numbers, and a low fitness function (Z value) represents the greatest accuracy. The PMX method had an excellent result from twenty-one different experiments, and the two-point crossover method, with four experiments, obtained the best fitness function. The other experiments resulted in the same optimal solution. Although the adopted PMX method is best and obtained a best near optimal solution, this does not mean that the PMX method always has a good analytical capability. For example, the gap in the new leftovers is very large in experiment 14. However, it is still grouped into the leftovers inventory and this will result in increased inventory costs. However, when calculating the Z-value to be less than or equal to thirty in all experiments, the PMX method occurred three times, and the two-point crossover method did not obtain this results at all. In summary, if the results only consider the fitness function, the PMX method is more complicated.
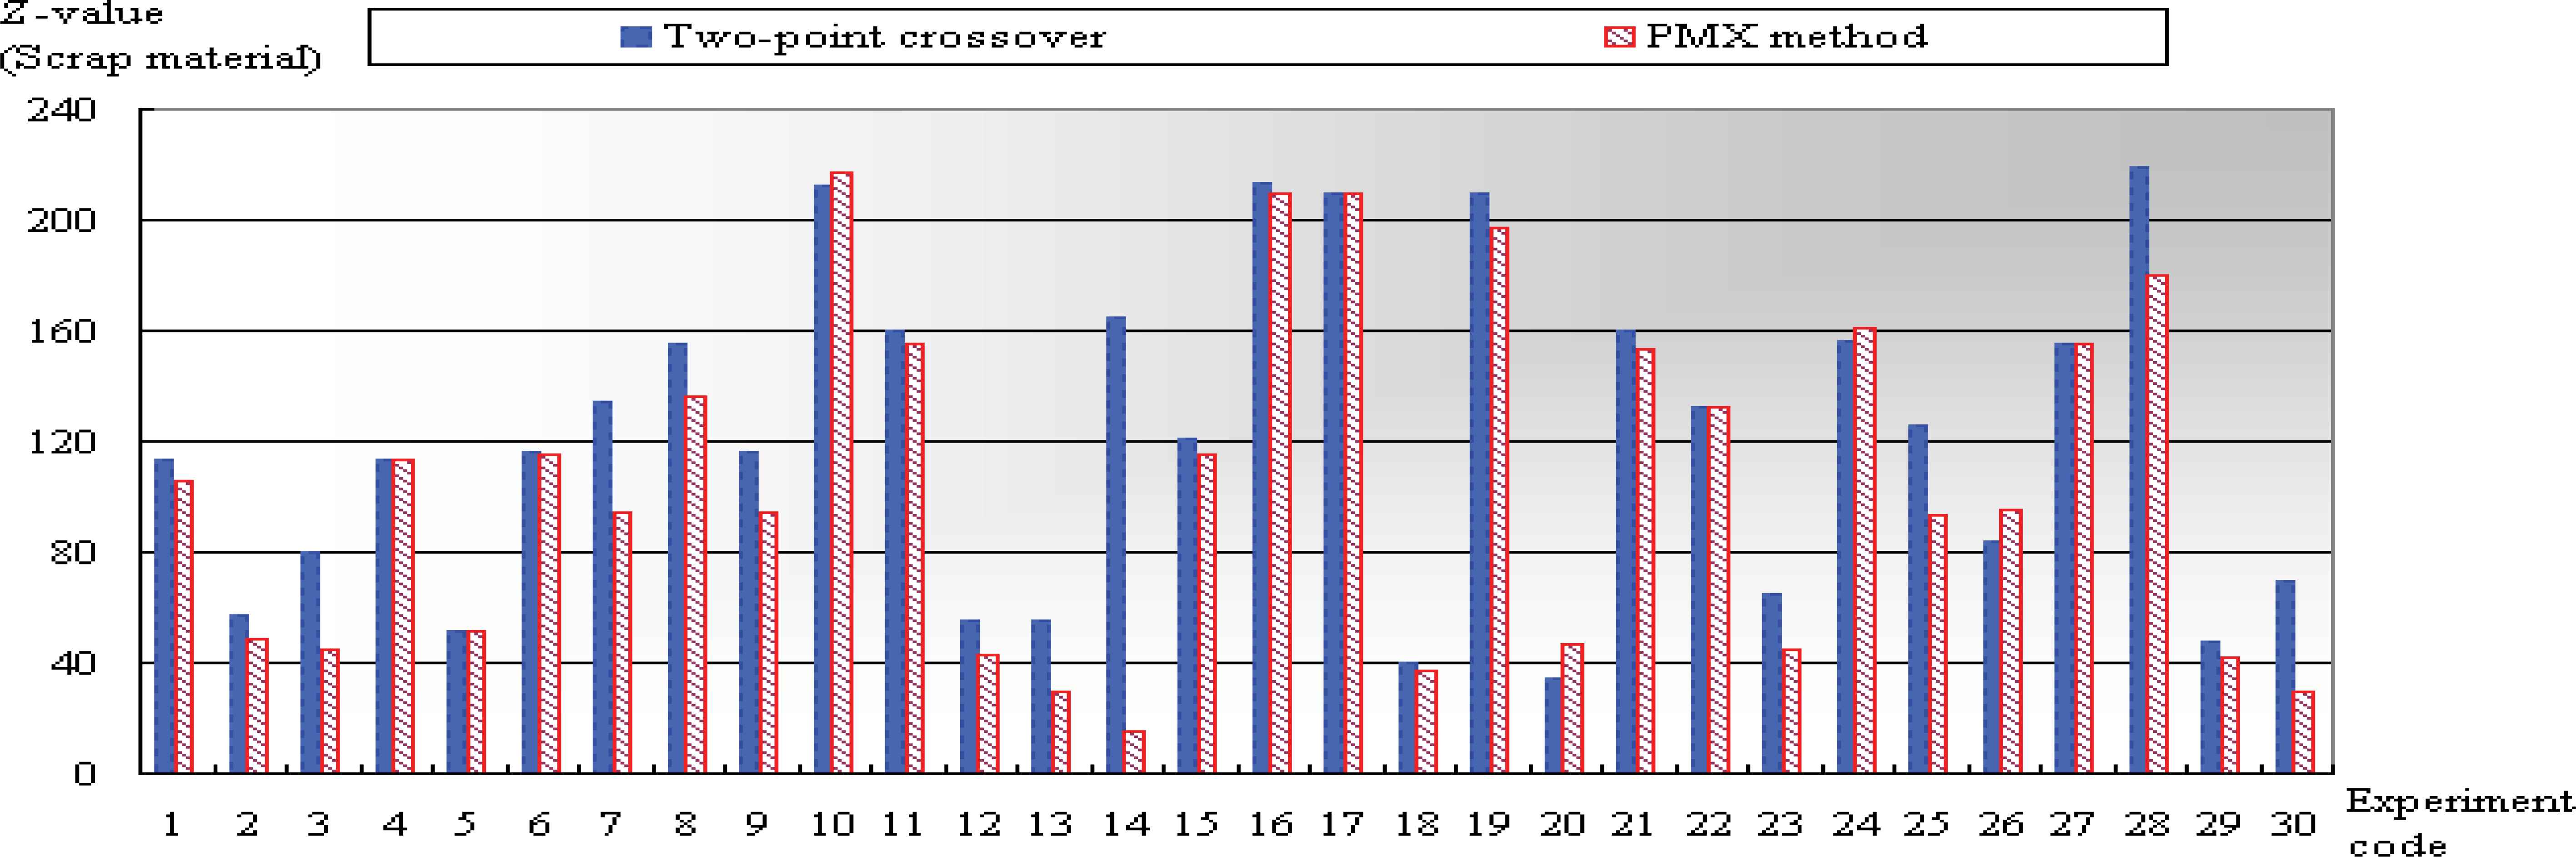
Comparison of solutions
For the staff managing the aluminum window materials, the results of this study can be helpful for solving the problem of ordering raw materials, while still using their leftovers. Also, the insights of this study enable them to plan more efficient production strategies. This study presents some opportunities for discussion for both management and academics.
First, when comparing the two-point crossover and PMX methods, genetic algorithms generally perform crossovers and mutations better, and avoid lapsing into the local optimum. Chen et al.46 and Ye et al.47 pointed out that they may want to control the rate of crossover and mutation to enhance the algorithm’s reliability. PMX crossover is a control gene crossover approach that is used to achieve a more optimal solution. This method is useful because the experimental results can be verified. In fact, many different crossover methods are adopted to control the gene, such as the optimized crossover operator method48. Also, Onnen et al.49 proposed a nonlinear crossover method for increasing the efficiency of the genetic search. The concept of this study limits the possibility of a change in some genes. Future studies should attempt to make further enhancements to this approach.
Second, this study determined a relationship between the bin-packing problem and the genetic algorithms and extended this relationship. Previous studies focused on reducing the use of raw materials to save costs, while this study also explored the consumption of leftovers, and thus, extended its scope into the realm of production management, by considering specific operational needs. This algorithm can be developed on the basis of the genetic algorithm; thus, it is a novel method as a reference for future studies on the matching problem.
Third, the proposed method can reduce the number of people required to calculate the quantity of matching leftovers to production needs. In addition, the complexity of the orders and the nature of the demands of the current market further complicate the problem. Even a decision support system developed in this way may not be sufficient for future use, as information systems must cope with the growth in the number, size and complexity of their problems. Past management experience and studies highlight the need for technological standardization to solve business management problems50,51. This type of system should be able to break a complex and multidimensional problem into many smaller parts, and comply with an information system function that can assist management in decision making. For example, the original order is broken down into the designed variables of only one type of frame, while it can also be used to classify several different types of material and frames. This study used the window-frame approach for classifying a minimum unit, resulting in more efficient support for decision making. The more complex the problem, the more difficult and time consuming it is to assess its algorithm. As a result, for enterprises to efficiently manage the problem of material inventories, they should decompose and standardize these methods into a fixed and simple procedure that can enhance the competitiveness of the operation.
6. Conclusions, limitations, and future work
There are many possible combinations of materials and orders, resulting in greater difficulty and complexity as the number of samples increases. This study’s proposed calculation methods that have proven to be feasible, and can be used to handle this type of matching problem. As an example, the experiments presented here provided the aluminum window manufacturer with a more useful method to reduce the amount of new raw materials ordered, by identifying the leftovers already in stock, thus, saving both cost and time. The contribution of this study is that it provides a method that can be implemented on an information system and the system architecture is provided for reference. Furthermore, it provides and illustrates a standardized procedure and an information system function that management in business enterprises can use to address a complex problem by dividing it into smaller, more manageable units. In the real world, businesses face difficult problems, which continue to increase in complexity. The use of resources can be optimized through the computation of increasingly complex variables and, there is ample room for continued study, discussion and improvement of the optimization method.
Although this study considered real-world problems as issues, constraints on resources and environmental conditions remain. First, a company considers reducing the consumption of leftovers as a priority, because this can save costs. This can result in great benefits. Nevertheless, the time and cost of using these leftovers are not considered in this study. If cutting costs is taken into consideration, this may affect results, which may not necessarily be consistent with the manufacturer’s expectations regarding the consumption of leftovers. Second, the results of this study have been validated by simulation experiments. This is a complete supply and demand assumption. In practice, orders may vary according to consumers’ demands. However, the study does not consider the condition of the real-world special and unusual order and stock number.
Finally, it is recommended that future studies focus on the following points. There are other metaheuristic algorithms, such as ant colony, PSO. This study uses the GA for evaluation; hence, other metaheuristic methods should be considered for evaluation in order to expand the scope of this research topic. In addition, this study considers only a one-dimensional factor, namely, the length of the material. For practical applications, two-dimensional or three-dimensional factors should also be taken into consideration.
Appendix A. Experimental results
| Experiment code | Methods | Fitness function | New usable leftover | System simulation time (sec.) | GA evolution iterations |
|---|---|---|---|---|---|
| Ex01 | Two-point | 113 | 865 | 2,655 | 38 |
| PMX | 106 | 680 | 5,744 | 73 | |
| Ex02 | Two-point | 57 | 96 | 1,823 | 34 |
| PMX | 49 | 84 | 1,826 | 33 | |
| Ex03 | Two-point | 80 | 420 | 12,746 | 175 |
| PMX | 45 | 340 | 15,607 | 196 | |
| Ex04 | Two-point | 113 | 616 | 1,216 | 31 |
| PMX | 113 | 616 | 1,272 | 31 | |
| Ex05 | Two-point | 51 | 121 | 1,600 | 31 |
| PMX | 51 | 121 | 1,631 | 31 | |
| Ex06 | Two-point | 116 | 135 | 1,613 | 31 |
| PMX | 115 | 140 | 1,866 | 37 | |
| Ex07 | Two-point | 134 | 652 | 2,953 | 41 |
| PMX | 94 | 675 | 3,051 | 41 | |
| Ex08 | Two-point | 155 | 161 | 3,335 | 38 |
| PMX | 136 | 49 | 4,660 | 58 | |
| Ex09 | Two-point | 116 | 933 | 2,700 | 69 |
| PMX | 94 | 621 | 2,565 | 63 | |
| Ex10 | Two-point | 212 | 324 | 11,290 | 192 |
| PMX | 217 | 278 | 13,863 | 250 | |
| Ex11 | Two-point | 160 | 65 | 2,808 | 31 |
| PMX | 155 | 65 | 2,986 | 31 | |
| Ex12 | Two-point | 55 | 31 | 1,639 | 31 |
| PMX | 43 | 19 | 3,071 | 58 | |
| Ex13 | Two-point | 55 | 350 | 10,101 | 143 |
| PMX | 30 | 405 | 7,476 | 98 | |
| Ex14 | Two-point | 165 | 220 | 8,366 | 115 |
| PMX | 15 | 505 | 12,279 | 163 | |
| Ex15 | Two-point | 121 | 101 | 1,753 | 35 |
| PMX | 115 | 135 | 2,857 | 59 | |
| Ex16 | Two-point | 213 | 296 | 12,320 | 270 |
| PMX | 210 | 303 | 16,713 | 330 | |
| Ex17 | Two-point | 210 | 340 | 9,825 | 185 |
| PMX | 210 | 340 | 12,859 | 265 | |
| Ex18 | Two-point | 40 | 118 | 3,006 | 31 |
| PMX | 37 | 130 | 5,327 | 52 | |
| Ex19 | Two-point | 210 | 300 | 22,535 | 280 |
| PMX | 197 | 473 | 4,080 | 47 | |
| Ex20 | Two-point | 34 | 28 | 4,897 | 50 |
| PMX | 47 | 68 | 3,214 | 31 | |
| Ex21 | Two-point | 160 | 75 | 2,853 | 31 |
| PMX | 153 | 72 | 4,115 | 46 | |
| Ex22 | Two-point | 132 | 846 | 2,607 | 50 |
| PMX | 132 | 865 | 1,162 | 31 | |
| Ex23 | Two-point | 65 | 345 | 5,146 | 137 |
| PMX | 45 | 495 | 6,154 | 150 | |
| Ex24 | Two-point | 156 | 61 | 4,680 | 53 |
| PMX | 161 | 46 | 4,616 | 51 | |
| Ex25 | Two-point | 126 | 671 | 2,369 | 34 |
| PMX | 93 | 590 | 2,955 | 39 | |
| Ex26 | Two-point | 84 | 626 | 3,679 | 46 |
| PMX | 95 | 823 | 2,923 | 37 | |
| Ex27 | Two-point | 155 | 170 | 1,455 | 31 |
| PMX | 155 | 170 | 1,450 | 31 | |
| Ex28 | Two-point | 219 | 360 | 19,211 | 188 |
| PMX | 180 | 308 | 5,341 | 60 | |
| Ex29 | Two-point | 48 | 125 | 2,343 | 46 |
| PMX | 42 | 83 | 2,137 | 42 | |
| Ex30 | Two-point | 70 | 340 | 5,877 | 152 |
| PMX | 30 | 245 | 6,901 | 168 | |
References
Cite this article
TY  - JOUR
AU  - Hsin-Pin Fu
AU  - Cheng-Yuan Ku
AU  - Tsung-Sheng Chang
PY  - 2016
DA  - 2016/06/01
TI  - A Decision Support System Based on a Genetic Algorithm for the Utilization of Leftovers
JO  - International Journal of Computational Intelligence Systems
SP  - 483
EP  - 496
VL  - 9
IS  - 3
SN  - 1875-6883
UR  - https://doi.org/10.1080/18756891.2016.1175813
DO  - 10.1080/18756891.2016.1175813
ID  - Fu2016
ER  -