
A New Approach to Extract Text from Images based on DWT and K-means Clustering
- DOI
- 10.1080/18756891.2016.1237189How to use a DOI?
- Keywords
- Text extraction; Texture features; DWT; K-means clustering; sliding window; voting decision
- Abstract
Text present in image provides important information for automatic annotation, indexing and retrieval. Therefore, its extraction is a well known research area in computer vision. However, variations of text due to differences in orientation, alignment, font, size, low image contrast and complex background make the problem of text extraction extremely challenging. In this paper, we propose a texture-based text extraction method using DWT with K-means clustering. First, the edges are detected from image by using DWT. Then, a small size overlapped sliding window is used to scan high frequency component sub-bands from which texture features of text and non-text regions are extracted. Based on these features, K-means clustering is employed to classify the image into text, simple background and complex background clusters. Finally, voting decision process and area based filtering are used to locate text regions exactly. Experimentation is carried out using public dataset ICDAR 2013 and our own dataset for English, Hindi and Punjabi text images for different number of clusters. The results show that the proposed method gives promising results with different languages in terms of detection rate (DR), precision rate (PR) and recall rate (RR).
- Copyright
- © 2016. the authors. Co-published by Atlantis Press and Taylor & Francis
- Open Access
- This is an open access article under the CC BY-NC license (http://creativecommons.org/licences/by-nc/4.0/).
1. Introduction
Text present in image contains high level semantic information which is used to understand the contents of the image1,2. Many television, educational, advertisements, multimedia and training programs contain mixed text, picture and graphic regions. With rapid growth of multimedia documents and increasing demand for indexing and retrieval, many efforts need to be done on text extraction3. Text extraction plays an important role in document analysis, vehicle license plate detection, identification of parts in industrial automation, signboards, libraries for computerized storage of books, postal code from address on the envelope, text translation system for foreigners and bank cheque processing forms. Image texts can be classified into three types: document texts, scene texts and caption texts. A document text image is acquired by scanning journal, book cover, printed and handwritten document. Scene text occurs in the natural world. These photos are taken by people through digital cameras and mobile phones in their journey and daily life. Caption text is artificially inserted or overlaid on the image during editing processes4. Among these, Scene texts are most difficult to detect because images often have complex background and text in these images may have different style, size, color, orientation and alignment. Therefore, many researchers are focusing on text extraction from natural scene images.
Text extraction techniques are widely classified into two categories-region-based and texture-based. Region-based methods use the properties of the color or gray-scale in a text region or their variance with the corresponding properties of the background. It can be further sub-divided into two types: edge-based and connected component (CC)-based. Edge-based methods5–18 focus on the high contrast between text and background. The edges of text are identified, merged and then various techniques are applied to filter out the non-text regions. This technique is sensitive to shadow, highlight and complex background. CC-based methods19–24 use a bottom-up approach (grouping small components into large components) until all the regions are identified in the image. Presence of noise, complex background, multicolored text, low resolution and small font size hinders the efficiency of text extraction. Texture-based methods25–29 are based on the observation that texts in images have distinct textural properties that differentiates them from the background. It works efficiently even in presence of noisy, complex background and low resolution images. These methods usually divide the image into blocks and extract features of text and non-text regions using Gabor filters, Wavelet Transform, Fast Fourier Transform (FFT), spatial variance and Discrete Cosine Transform (DCT). These features are then employed to e.g. neural network (NN) classifier, support vector machine (SVM) classifier or clustering algorithm to locate the text regions. The processing of NN and SVM classifier is time consuming because they need to be trained on dataset containing different kind of images before testing. Therefore, K-means clustering algorithm is a better technique to classify the image into text and non-text cluster.
The rest of the paper is presented as follows. Section 2 describes related work. Section 3 explains the proposed text extraction technique. Results and discussion are included in Section 4 and conclusions are provided in Section 5.
2. Related work
A lot of efforts have been put up by many researchers for text extraction from images and video frames. Shekar et al.30 suggested a hybrid approach for text localization in video frames and natural scene images based on discrete wavelet transform (DWT) and gradient difference. This approach is found to be inefficient in case of more complex background images. Bai et al.31 formulated a seed based segmentation method which extracted seed points of text and background by judging the text polarity. Text is further segmented by semi-supervised learning. This method does not work well with non-uniform text polarity in a text line and appearance of strokes in images having strongly striped background. Kumar et al.32 proposed an efficient algorithm for text localization and extraction in video text images. It includes edge map generation using line edge detection mask followed by text area segmentation using projection profile based method. The drawback of this method is its inefficiency to extract the text in more widely spaced and large font size text images. Shivakumara et al.33 suggested a video scene text detection method by using Laplacian and Sobel operations followed by Bayesian classifier and boundary growing method. Limitation of this method is its low precision rate and F-measure which is due to more false positives. Yi et al.34 proposed a novel method for text extraction from scene text images. It consists of sequence of three steps: boundary clustering, stroke segmentation and string fragment classification. This method does not work well with very small font, blurred, tilted and non-uniform colored text strings. Khodadadi et al.35 formulated algorithm using stroke filter for text localization. Color histogram method is used to extract text characters accurately and finally inpainting algorithm is used to refine text regions. Nagabhushan et al.27 suggested a hybrid (CC and texture feature analysis) approach for text extraction in complex color document images. This approach fails to separate foreground text when contrast between foreground and background is poor. Zhao et al.36 suggested a classification based algorithm for text detection using a sparse representation with discriminative dictionaries. Adaptive run-length smoothing algorithm and projection profile analysis are used to refine the text regions. Pan et al.37 proposed a hybrid (region and CC) approach to localize texts in natural scene images. It is done accurately by using local binarization, conditional random field and energy minimization approaches. Grover et al.10 suggested edge based feature for detection of text embedded in complex colored document images. It is done by using Sobel edge detector and block classification method. This technique does not work well when intensity of text and background is similar. Jung et al.38 proposed a method based on SVM for accurate text localization in images. It includes three modules: (1) text detection based on edge-CC analysis, (2) text verification based on classifier fusion of normalized gray intensity and constant gradient variance and (3) text line refinement based on SVM. This technique does not work well if distortion and skewing are present in text lines. Zhang et al.39 have applied wavelet transform to extract edges from the image and K-means clustering is used to classify the text area from high frequency wavelet coefficients. Ji et al.40 suggested a method for extracting hybrid features by using sliding window method. SVM classifier is used to differentiate text from the background. Finally, vote mechanism and morphological operations are used to exactly locate text regions. Disadvantage of this method is its inefficiency to work accurately on non-horizontal aligned texts. Zhao et al.41 proposed a video text extraction method by using DWT in combination with NN. After applying DWT, Kurtosis feature is used to improve the accuracy of text location. NN is used to classify pixels as text and background. An efficient text extraction method using fuzzy classifier and dual-tree discrete wavelet transform is suggested by Saeedi42. Fuzzy classifier is applied to classify pixels as either text or non-text regions. Shivakumara et al.43 formulated a classification based text detection method for extracting both scene and graphic text in video images. Combination of filter and edge based analysis are used for classification of low and high contrast video images. It is done so as to choose proper threshold value for detecting text line accurately. This method fails to detect the text lines when it gives the same threshold value for both low and high contrast images. Wei et al. 44 suggested a video text detection approach using three steps: (1) detecting text region by using pyramidal gradients and K-means clustering, (2) refining text using projection profile analysis and (3) text identification using geometrical, texture properties and SVM. Limitations of this method are its low detection rate and more false positives. Xu et al.45 proposed a hierarchical text detection method for scene text images based on convolutional neural networks (CNN). On the basis of maximally stable extremal regions (MSER), the boosted CNN filtering is performed to detect candidate character components. Random forest classifier is then applied on statistical characteristics of text lines for finer filtering. Zhang et al.46 presented a symmetry-based algorithm for text line detection in natural scene images. This method fails to detect all the characters in the images having extremely low contrast or highly illuminated background or presence of large difference in the size of characters. Chen et al.47 proposed an efficient local contrast-based segmentation method for text localization in born-digital images. This method fails to locate text in case of curved text lines.
From literature review, it is concluded that text extraction from images having complex background, variance of alignment and orientation of text is still a challenging task.
3. Proposed method
The method proposed (Fig. 1) is based on the fact that edges in an image play a significant role in text extraction as the intensity of text edges is higher than that of non-text edges.
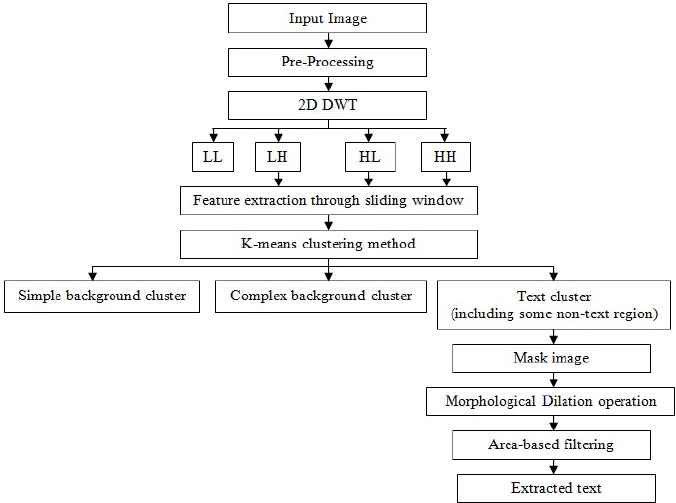
Flowchart of proposed text extraction method
3.1. Pre-processing
Pre-processing operation converts color image into gray-scale image. This is because the color of text does not provide any information in text extraction. Its RGB components are combined to give an intensity image (Y) given by Eq. (1)
3.2. 2D DWT
2D DWT is used to decompose gray-scale image into four sub-bands-one approximation (LL) component and three detailed (LH, HL and HH) components. Edges of text region have high contrast, therefore its texture characteristics are better reflected by high frequency wavelet coefficients. LH, HL and HH sub-bands detect the horizontal (H), vertical (V) and diagonal (D) edges respectively.
3.3. Feature extraction through sliding window
Irregular texture property of the text to some extent makes it as a special texture. Statistical features like mean and standard deviation are computed so as to capture the texture property. A sliding window is moved from left to right and top to bottom with 4 pixels overlapping. It extracts the features of text and non-text regions from wavelet coefficients.
3.3.1. Sliding window
A sliding window of size w × h (typical values are e.g. 8× 8 and 8 ×16) is used to scan LH, HL and HH sub-bands of size (M × N) by the sliding step size (s1× s2), where 1 ≤ s1 ≤ w, 1 ≤ s2 ≤ h. In this paper, 4 × 4 sliding step size is used.
For zero padding, two variables (p1 and p2) are calculated by Eq. (2) & Eq. (3)
If p1 = 0 and p2 = 0 is true, then the sliding window will scan all the areas of every sub-band.
If p1 ≠ 0 or p2 ≠ 0 is true, the sliding window will not scan all the areas. Hence, zero padding is required at the end of each row and column so that it covers all the area of every sub-band.
The number of rows (w1) and columns (h1) to be padded with zeros are given by Eq. (4) & Eq. (5) respectively.
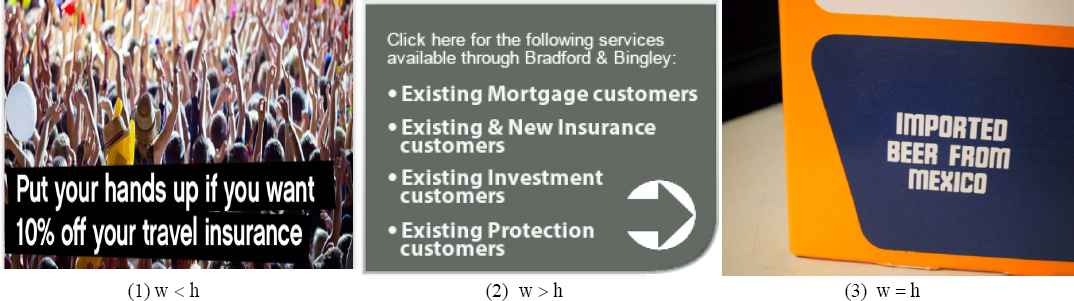
Sliding window size (Fig. 2) is chosen on the basis of the following criteria:
- (1)
w < h : When text is aligned in horizontal direction
- (2)
w > h : When text is aligned in vertical direction
- (3)
w = h : When text is equally aligned in both horizontal and vertical direction
Sliding window size
Texts usually appear in cluster and lie horizontally. So, mostly w = h and w < h windows are used.
3.3.2. Feature extraction
Two statistical features i.e. mean and standard deviation are calculated (Eq. (6) & Eq. (7)) from each sliding window for every sub-band (LH, HL and HH).
We will get 6 feature vectors i.e. 2 from each detail sub-band which is combined to give a single feature matrix X (Eq. (8)) of dimension n × 6 .
Text region is characterized by high values of mean and standard deviation than non-text region. Further, K-means clustering is employed to form clusters on the basis of these features.
3.4. K-means clustering algorithm
It is an unsupervised technique. It classifies a set of elements into K-clusters according to distance measurement such that intra-cluster similarity is high and the inter-cluster similarity is low. X is considered as the feature vector of n samples for implementing the clustering algorithm. Steps for K-means clustering (Fig. 3) are enlisted as follows:
- (i)
Initialize the center of each cluster.
Z1, Z2, Z3 are selected as initial centers of cluster C1 (simple background), C2 (complex background) and C3 (text) respectively and is given by Eq. (9)
where K is the number of clusters - (ii)
For partition of n samples into K clusters, Euclidean distance (ED) of each sample from each center is computed (Eq. (10)). For each sample, the following step is iterated K times.
If - (iii)
Calculate new center (
where nK is number of samples in CK cluster - (iv)
If the condition
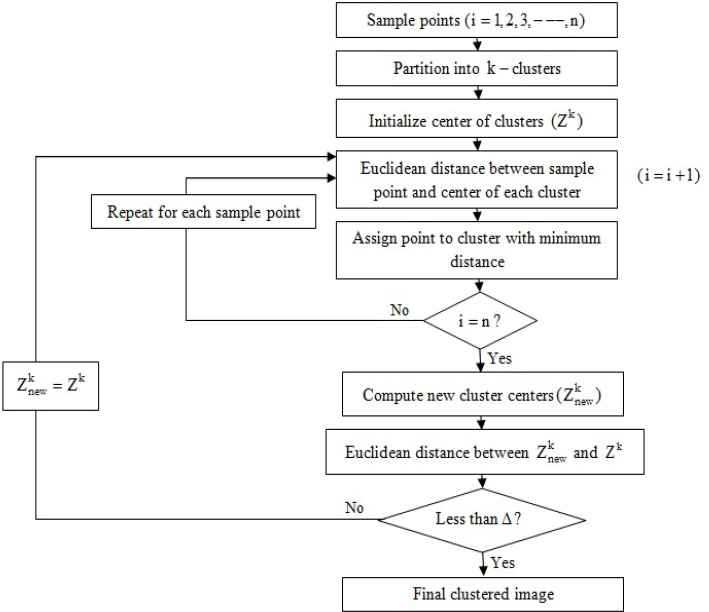
Flowchart of K-means clustering algorithm
For simple background images, K = 2 is chosen such that image is divided into two clusters-background and text.
3.5. Binarization
Voting decision process is used to create the mask image40. The steps involved are:
- (i)
Voting image (V) and mask image (M) of input image size is generated whose pixel values are set to zero.
- (ii)
If the sliding window in the image is classified as text cluster, the corresponding pixel of that window in voting image is voted once.
- (iii)
After voting process of all sliding window, we create the mask image. If the vote of pixel in the voting image is greater than 1, then that pixel value in the mask image is set to 1, otherwise set to 0. This is chosen to remove some of the noisy pixels around the text so that masked image contains only the text region. In case of more complex background images, we use area-based filtering to further remove non-text regions.
3.6. Morphological dilation operation
It is performed on the masked image (M) . It connects the adjacent text edges so that text pixels can be clustered together. The number of pixels added in an image depends on the size of structuring element. Dilation operation is given by Eq. (12)
In this paper, structuring element of size [4 × 4] and [4× 9] is used.
3.7. Removal of non-text regions
Two area-based filtering constraints are employed to remove non -text regions present in the image. First constraint is used to filter out small-sized objects (or non-text regions) using relative area value. Only those regions are retained in the image which have an area greater than relative maximum area (Eq. (13)).
Value of p depends upon small-sized objects in the image so as to remove them. Experimentally, it is observed that p varies from 7 to 11. Second constraint removes the remaining non-text regions with the help of a _ ratio, which is the inverse of extent value (Eq. (14) & Eq. (15)).
Experimentally, it is found that value of a _ ratio for text region is always less than 2.7. This value is useful for the localization of text in the image. Actual text is finally obtained by multiplying gray-scale image with the image obtained after removing non-text region. Further, Global thresholding is applied for refining the text region.
4. Results and discussion
The proposed method is implemented using MATLAB and run on an Intel (R) Core (TM) i5 CPU-1.80 GHz with 4 GB RAM memory. Dataset of ICDAR 2013 Robust Reading Competition, Challenge 1: “Reading Text in Born-Digital Images (Web and Email)” and Challenge 2: “Reading Text in Scene Images” are used. We also created our own dataset containing images of book covers, magazines, printed materials, sign-boards, caption and scene text of different languages (English, Hindi and Punjabi) collected from internet. These datasets cover a variety of text in different fonts, sizes, resolutions, alignments, orientations, languages, illuminations and background complexity. We have considered 180,150 and 260 images from challenge 1, challenge 2 and our own dataset respectively for experimentation. Various parameters used to analyze the performance of proposed technique are enlisted as follows:
- (1)
- (2)
- (3)where
True positive (TP):-The regions that are actually text characters in the image and also have been detected by the algorithm as text regions.
False positive (FP) or false alarms:-The regions that are not actually characters of text, but have been detected as text by the algorithm.
True negative (TN):-The regions which are not text characters in the image and also have not been detected by the algorithm.
False negative (FN) or missed detects:-The regions that are actually text characters, but have not been detected by the algorithm.
- (4)
Processing time (PT):-It is the time required to process the image. It depends upon the amount of the text present in the foreground and also on the background complexity.
Experimentation is carried out by using Haar wavelet as it is simple, symmetric, orthogonal and the only one that portrays binary like behavior. K-means clustering is a method of grouping elements into K clusters. The elements belonging to one cluster are close to the centroid of that particular cluster and dissimilar to the elements belonging to the other cluster. The choice of choosing either 2 or 3 clusters depends upon the image complexity and not dependent on image size. K is chosen as 2 for simple and less complex background images (document and caption text) mostly present in ICDAR 2013 (challenge 1) dataset. For more complex background images (scene text), K is chosen as 3. These types of images are mostly present in ICDAR 2013 (challenge 2) dataset. Fig. 4 shows both types of input images (simple background and complex background) and images obtained after applying K-means clustering. It is found that K = 2 is a good choice for less complex background images as it gives best text extraction results, while it is not suitable for more complex background images. In more complex background images, many man-made structures (building windows, bricks, pillars, etc.) and natural scene objects such as trees, grasses and leaves are prone to be falsely detected as text for two clusters and these false alarms are eliminated by forming three clusters as shown in Fig. 4. We have only considered K as 2 or 3 because, if more than 3 clusters have been generated it is complicated to decide which cluster is text cluster and which is not.
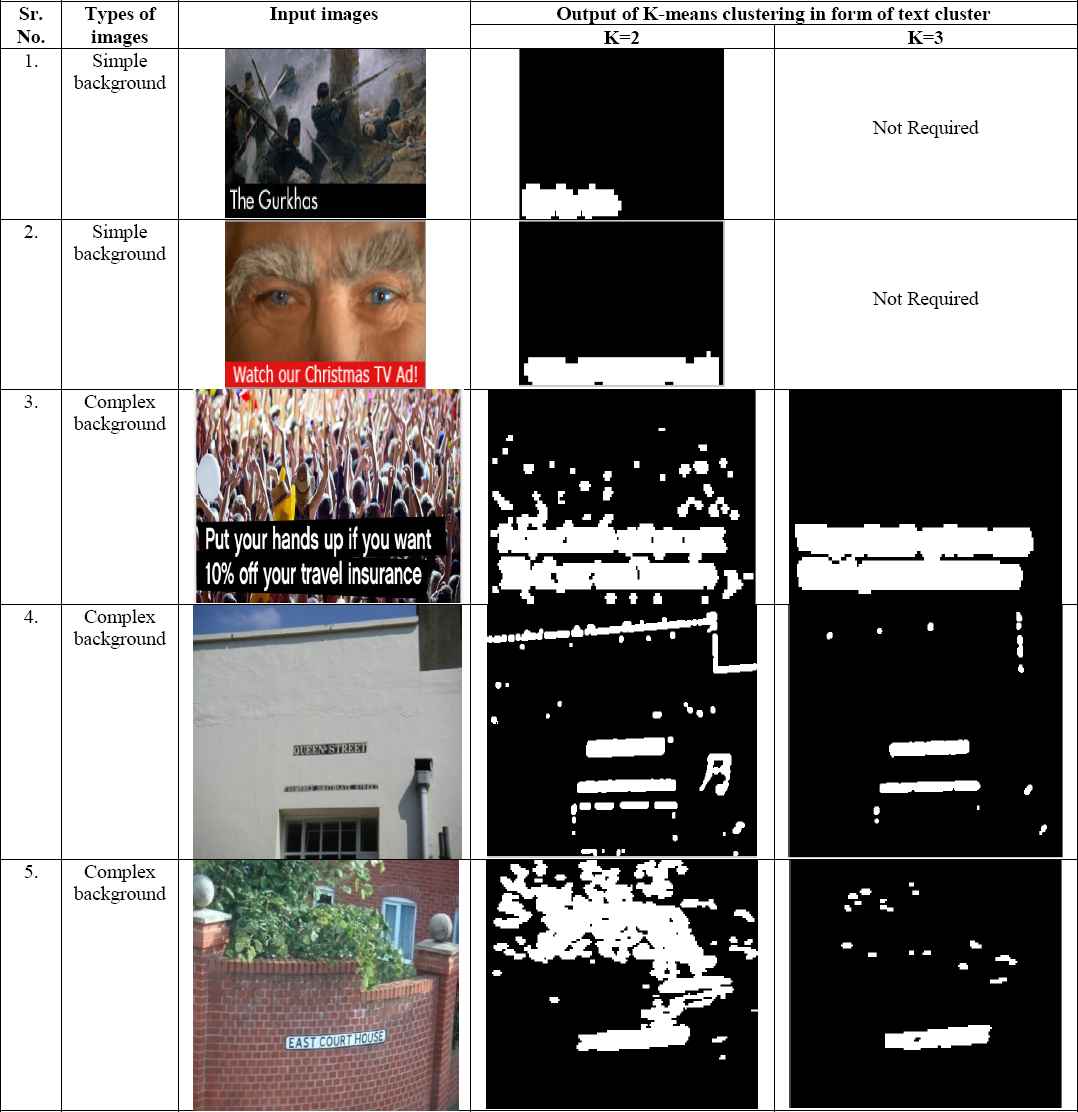
Images after K-means clustering
The steps involved in text extraction from complex background image are shown in Fig. 5. Pre-processing operation converts input color image (Fig. 5(a)) into gray-scale image (Fig. 5(b)). For the gray-scale image, we used 2D DWT to get four sub-bands (LL, LH, HL and HH) (Fig. 5(c)). Edges of text regions have high contrast; therefore its texture characteristics are better reflected by high frequency wavelet coefficients (LH, HL and HH). A sliding window of size w × h (w = 16 and h = 16) pixels for this image is used to scan LH, HL and HH sub -bands by the sliding step size (4 × 4). Two statistical features i.e. mean and standard deviation are computed from each sliding window for every sub-band (LH, HL and HH) . After feature computation, six features (two each for three high frequency sub-bands) are obtained. K-means clustering algorithm is used to classify the feature vectors into three clusters: simple background (Fig. 5(d)), complex background (Fig. 5(e)) and text (Fig. 5(f)). Voting decision process is used to create mask image as shown in Fig. 5(g) . Morphological dilation operation (Fig. 5(h)) is used to connect adjacent text pixels so that text information is retained around the segmented edge areas. Area-based filtering is used to discard very small objects as background shown in Fig. 5(i). True text regions (Fig. 5(j)) are obtained by multiplying gray-scale image (Fig. 5(b)) with the image obtained after removing non-text regions (Fig. 5(i)). Global thresholding is then used to refine text regions as shown in Fig. 5(k).
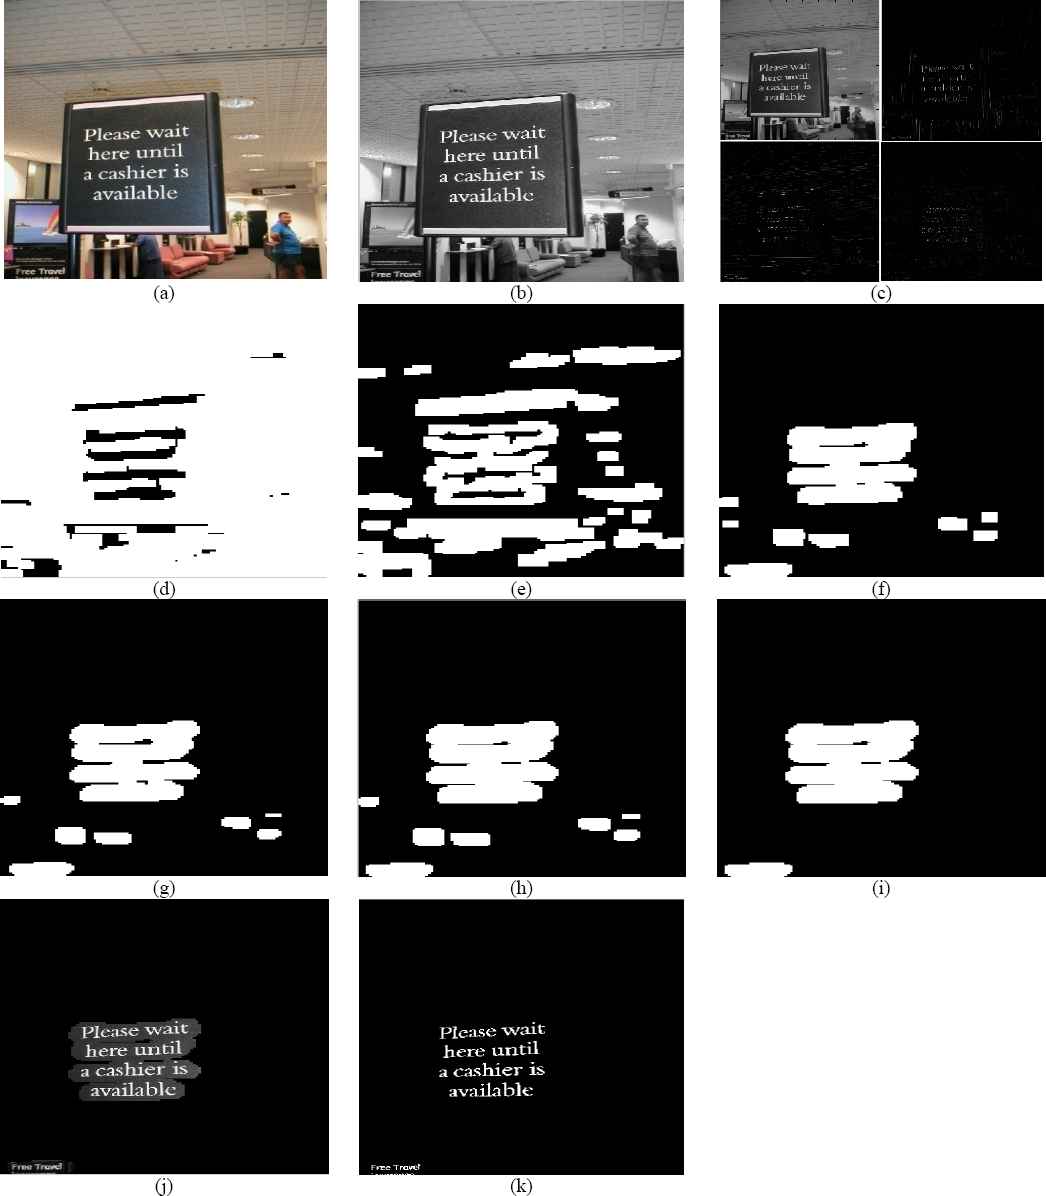
Steps involved in text extraction for complex background image: (a) input color image; (b) pre-processing; (c) 2D DWT; (d) simple background cluster; (e) complex background cluster; (f) text cluster; (g) masked image; (h) morphological dilation operation; (i) removal of non-text regions (area-based filtering); (j) extracted text; (k) refining of text region
Performance on ICDAR dataset and own dataset is shown in Table 1 and Table 2 respectively. Comparative analysis of proposed method with previously reported text extraction techniques for complex color images is shown in Table 3.
| Sr. No. | Resolutions | K=2 | K=3 | ||||||||
|---|---|---|---|---|---|---|---|---|---|---|---|
| No. of images | Evaluation parameters | No. of images | Evaluation parameters | ||||||||
| DR | PR | RR | Average PT (sec) | DR | PR | RR | Average PT (sec) | ||||
| 1. | 100 × 100 to 300 × 300 | 60 | 0.9995 | 0.9958 | 0.9959 | 0.6555 | 20 | 0.9993 | 0.9945 | 0.9934 | 0.8614 |
| 2. | 300 × 301 to 500 × 500 | 15 | 0.9993 | 0.9936 | 0.9972 | 2.4111 | 10 | 0.9999 | 0.9996 | 0.9982 | 2.7241 |
| 3. | 640 × 480 | 30 | 0.9995 | 0.9949 | 0.9932 | 5.2261 | 10 | 0.9997 | 0.9979 | 0.9876 | 6.9649 |
| 4. | 1280 × 960 | 10 | 0.9998 | 0.9958 | 0.9942 | 18.3751 | 5 | 0.9991 | 0.9954 | 0.9854 | 20.1644 |
| 0.9995 | 0.9950 | 0.9951 | 0.9995 | 0.9969 | 0.9912 | ||||||
Performance with ICDAR dataset
| Sr. No. | Resolutions | K=2 | K=3 | ||||||||
|---|---|---|---|---|---|---|---|---|---|---|---|
| No. of images | Evaluation parameters | No. of images | Evaluation parameters | ||||||||
| DR | PR | RR | Average PT (sec) | DR | PR | RR | Average PT (sec) | ||||
| 1. | 100 × 100 to 300 × 300 | 50 | 0.9989 | 0.9946 | 0.9944 | 0.4248 | 20 | 0.9994 | 0.9915 | 0.9929 | 0.6109 |
| 2. | 300 × 301 to 500 × 500 | 15 | 0.9993 | 0.9956 | 0.9930 | 1.9064 | 15 | 0.9996 | 0.9965 | 0.9957 | 2.6414 |
| 3. | 640 × 480 | 20 | 0.9991 | 0.9925 | 0.9928 | 4.6691 | 10 | 0.9990 | 0.9889 | 0.9928 | 7.1701 |
| 4. | 1280 × 960 | 15 | 0.9991 | 0.9922 | 0.9913 | 16.0149 | 10 | 0.9995 | 0.9872 | 0.9993 | 17.4146 |
| 0.9991 | 0.9937 | 0.9929 | 0.9994 | 0.9910 | 0.9952 | ||||||
Performance with our dataset
| Author (Year) | Method | Image source | No. of images | Evaluation parameters | |||
|---|---|---|---|---|---|---|---|
| DR (%) | PR (%) | RR (%) | Average PT (sec) | ||||
| Shivakumara et al. [43] (2010) | Sobel and Canny edge operators, arithmetic filter, median filter, edge maps, feature extraction through sliding window, K-means clustering algorithm, morphological operations | Video images taken from movies, news clips, sports videos, music videos (own dataset) | 2580 | 85.60 | - | - | 21 |
| Shivakumara et al. [33] (2012) | Laplacian and Sobel operations, Bayesian classifier, boundary growing method | ICDAR 2003 scene images | 251 | - | 72 | 87 | 7.9 |
| own dataset | 1020 | - | 74 | 87 | 9.3 | ||
| Yi et al. [34] (2012) | Boundary clustering, stroke segmentation, string fragment classification | ICDAR 2003 scene images | 487 | - | 73 | 67 | - |
| ICDAR 2011 scene images | 228 | - | 81 | 72 | - | ||
| Born-digital and broadcast video images (own dataset) | 420 | - | 64 | 67 | - | ||
| Scene images of blind-captured objects (own dataset) | 112 | - | 52 | 62 | - | ||
| Wei et al.[44] (2012) | Bilinear interpolation, gradient difference, K-means clustering algorithm, projection profile analysis, DWT, SVM | TV news, web images and movie clips (own dataset) | 200 | 95.10 | 89.60 | - | 8.7 (image size 288 × 352) |
| Shekar et al. [30] (2014) | DWT, gradient difference based method, morphological operation and CC analysis | ICDAR 2003 scene images | - | - | 83.80 | 94.60 | - |
| Xu et al. [45] (2015) | MSER, CNN, random forest classifier | ICDAR 2013 | - | - | 84 | 78 | - |
| Zhang et al. [46] (2015) | Symmetry-based text line detection approach | ICDAR 2013 | - | 97.70 | 88 | 74 | - |
| Chen et al. [47] (2015) | Local contrast based segmentation method, CCs generation and CC analysis | ICDAR 2013 Challenge 1: Reading Text in Born-Digital Images (Web and Email) | - | - | 91.57 | 85.80 | - |
| Our method | DWT, feature extraction through sliding window, K-means clustering algorithm, voting decision process and area-based filtering | Own dataset | 100 (K=2) | 99.91 | 99.37 | 99.29 | 0.4248 to 16.0149 |
| 55 (K=3) | 99.94 | 99.10 | 99.52 | 0.6109 to 17.4146 | |||
| ICDAR 2013 dataset | 115 (K=2) | 99.95 | 99.50 | 99.51 | 0.6555 to 18.3751 | ||
| 45 (K=3) | 99.95 | 99.69 | 99.12 | 0.8614 to 20.1644 | |||
Comparison of proposed method with other techniques for complex color images
ICDAR 2013 (challenge 1) is a modified version48 of ICDAR 2011 (challenge 1) with some newly added images. The scene image dataset of ICDAR 2013 (challenge 2) is almost the same as the datasets of ICDAR 2011 (Challenge 2) and ICDAR 2003. Therefore, it is justified to compare the performance of the proposed method using ICDAR 2013 with previously reported methods employing ICDAR 2011 and 2003 datasets.
Compared with the previously reported methods, the main advantages of the proposed algorithm are as follows:
- (1)
Fast detection: Our method is a hybrid approach of DWT and k-means clustering for text extraction. Wei et al.44 and Xu et al.45 have used learning-based methods belonging to supervised segmentation such as SVM and CNN classifier respectively for text extraction. K-means clustering algorithm, an unsupervised technique is faster than SVM and CNN to classify the image into text and non-text clusters as these classifiers need to be trained on dataset having different kind of images before testing.
- (2)
Reduced number of texture features: Selecting a proper set of texture features not only reduces the dimension of feature vectors, but also speeds up the classification. Shivakumara et al.43 used six statistical features from four edge maps to distinguish text and non-text regions. Our method uses only two statistical features i.e. mean and standard deviation so as to reduce computational complexity and improve the segmentation accuracy of text from complex background.
- (3)
Fast and accurate edge detection: The precision and recall rate of our method is higher than that of canny- and sobel-based methods33,43. 2D DWT edge detection is more accurate when background is complex. 2D DWT also reduces processing time compared to sobel and canny edge detector as it detects three different kinds of edges at the same time.
- (4)
Robust text extraction: The method can extract text in different fonts, font sizes, colors, and languages. It is also insensitive to text line orientation and alignment. It also works efficiently on widely spaced characters, low and high contrast images. The method reduces false alarms and makes it more effective even in complex background.
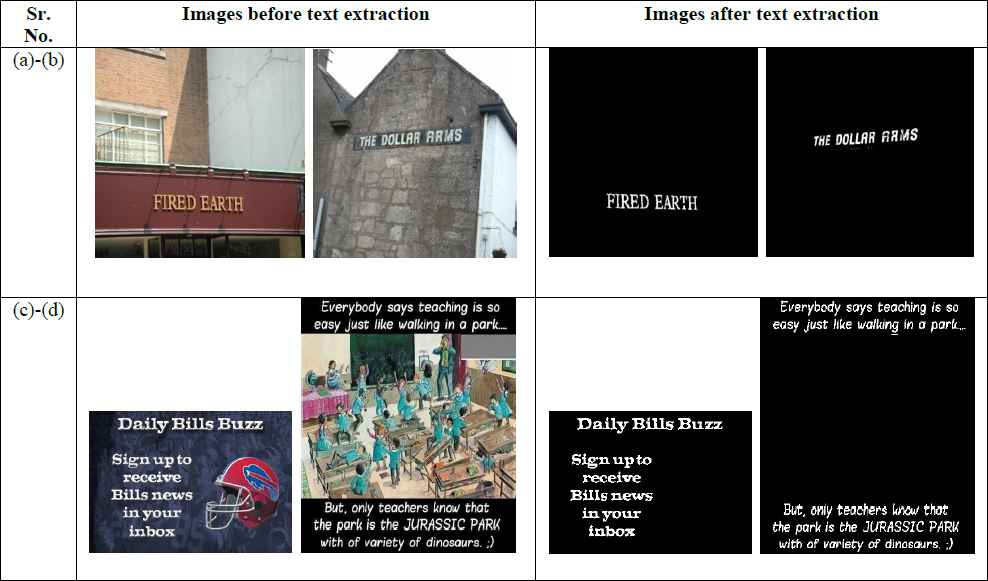
As can be seen in Table 3, the detection rate of our method is higher than Zhang et al.46 method. Zhang et al.46 method presented the symmetry property of character groups to extract text lines from natural images. It fails to detect all the characters in the images having extremely low contrast or highly illuminated background or presence of large difference in the size of characters. The precision rate of proposed method is higher than Chen et al.47 and Wei et al.44 methods. These methods44,47 show lower precision rate due to more false positives. Chen et al.47 method fails to locate text in case of curved text lines and Wei et al.44 method does not work well in presence of complex background. The recall rate of our method is higher than Shekar et al.30 method. This method30 is unable to detect characters when background complexity is high. Yi et al.34 method shows the lowest recall rate. This is mainly because of noisy and complex background that often occurs in images. The processing time of proposed method is reduced to 2.7241 sec for 300 × 301 to 500 × 500 image size compared to 8.7 sec for 288 × 352 image size44. It is concluded that the proposed method shows highest DR, PR and RR in comparison to the previously reported methods. It works efficiently on multilingual texts, skewed texts and handwritten texts. It extracts text information accurately from images having varying fonts, sizes, contrasts, resolutions, alignments, orientations, colors and complex background. The proposed method is superior to the previously reported methods, as it takes the maximum number of evaluation parameters for the study under consideration. Images before and after text extraction are shown in Fig. 6.
- •
Fig. 6(a) and (b) contain texts in natural scene images.
- •
Fig. 6(c) and (d) contain texts that are superimposed on the image.
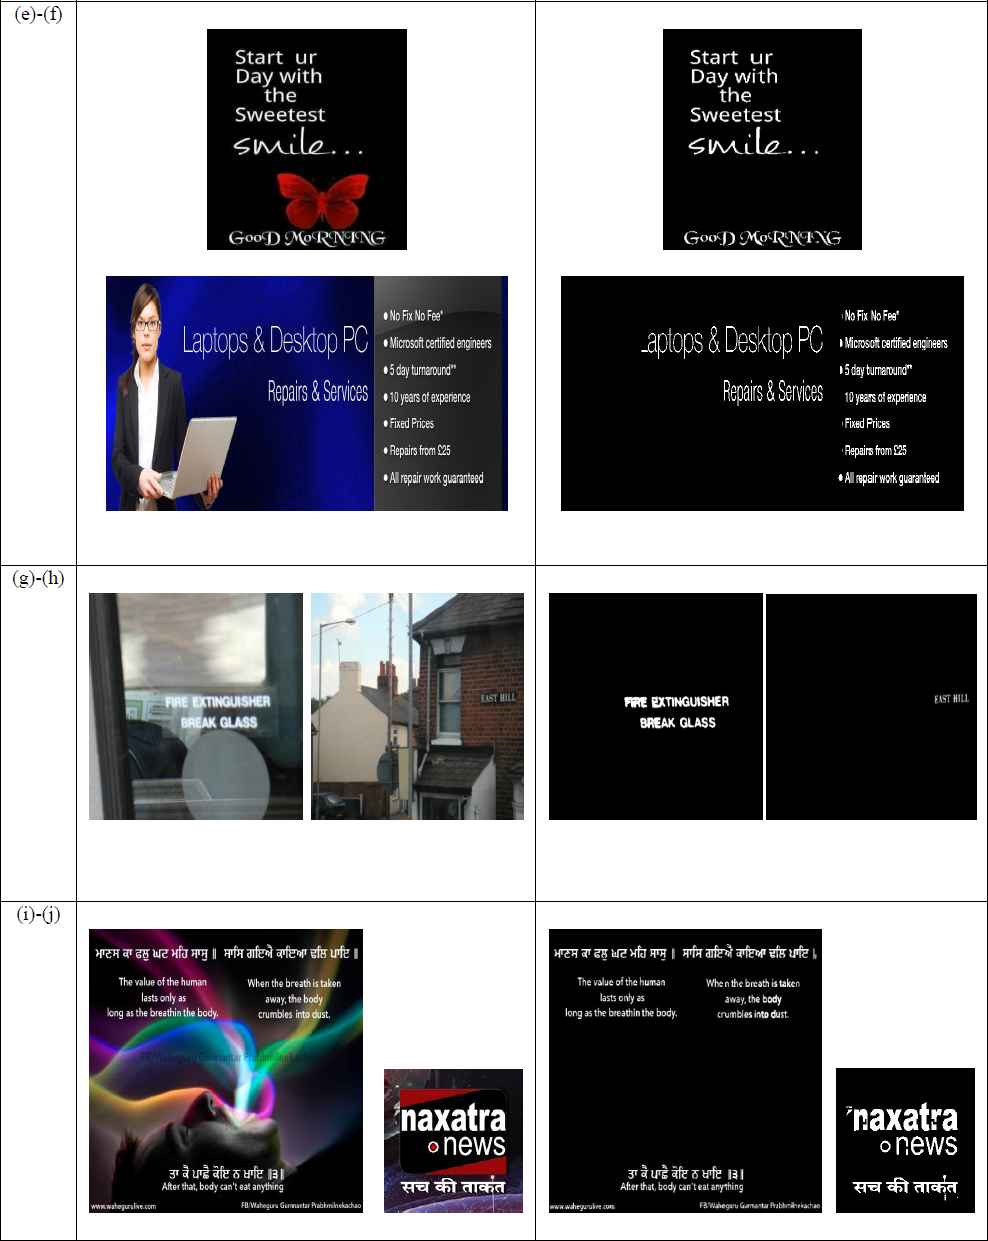
- •
Fig. 6(e) and (f) contain texts of different fonts and sizes.
- •
Fig. 6(g) and (h) contain texts in complex background.
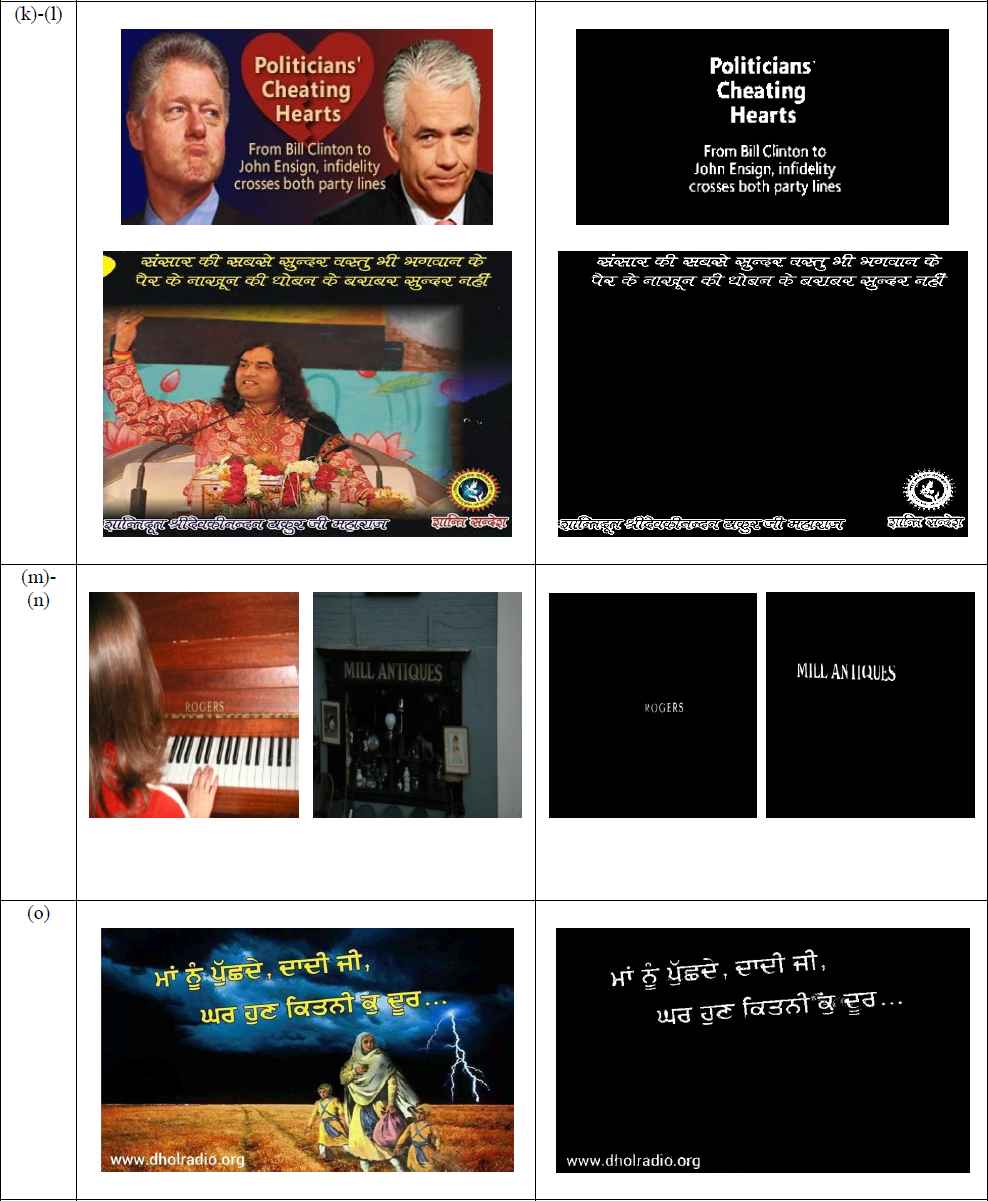
- •
Fig. 6(i) and (j) contain texts with different languages.
- •
Fig. 6(k) and (l) contain texts with different colors.
- •
Fig. 6(m) and (n) contain light texts on complex background.
- •
Fig. 6(o) contains aligned text in image.
Images before and after text extraction from complex color images
5. Conclusions
In this paper, an effective and efficient text extraction method from complex color images is proposed. We first extracted the edges of an input image by using DWT. A small sized overlapped sliding window is then used to scan high frequency component sub-bands from which texture features are extracted. Based on these features, K-means clustering is used to classify the image into text, simple background and complex background clusters. Finally, voting decision process and area-based filtering are used to locate text regions exactly. The proposed method is based on selecting a proper set of basic statistical features i.e. mean and standard deviation so as to reduce computational complexity and improve the segmentation accuracy of text from complex background. It is tested with different kind of images and compared with the previously reported methods in terms of evaluation parameters such as DR, PR and RR. All the experimentation is carried out by using Haar wavelet for complex color images. Experimental results showed that proposed method is robust and best for extracting text regions of different fonts, sizes, alignments, orientations, colors, languages and background complexity. It is found that with increase in resolution of images, processing time also increases. However, the performance of our method is inefficient when the images are highly illuminated. Our future work will be focused to find the solution of this problem.
Acknowledgement
Authors would like to thank ECE Department, PEC University of Technology, Chandigarh for providing necessary facilities and CSIR for providing funds required for carrying out this research work.
References
Cite this article
TY  - JOUR
AU  - Deepika Ghai
AU  - Divya Gera
AU  - Neelu Jain
PY  - 2016
DA  - 2016/09/01
TI  - A New Approach to Extract Text from Images based on DWT and K-means Clustering
JO  - International Journal of Computational Intelligence Systems
SP  - 900
EP  - 916
VL  - 9
IS  - 5
SN  - 1875-6883
UR  - https://doi.org/10.1080/18756891.2016.1237189
DO  - 10.1080/18756891.2016.1237189
ID  - Ghai2016
ER  -