
Gray image enhancement using harmony search
- DOI
- 10.1080/18756891.2016.1237191How to use a DOI?
- Keywords
- Harmony Search; Image enhancement; Optimization; Intelligent Agent
- Abstract
For decades, image enhancement has been considered one of the most important aspects in computer science because of its influence on a number of fields including but not limited to medical, security, banking and financial sectors. In this paper, a new gray level image (edge preserving) enhancement method called the harmony search algorithm (HSA) is proposed. HSA is a recently introduced population-based algorithm stemmed by the musical improvisation process when a group of musicians play the pitches of their instruments seeking for pleasing harmony. Tremendous successful stories of HSA application to a wide variety of optimization problems have been passed on at a large scale. In order to evaluate the proposed HSA-based image enhancement method, 14 standard images from the literature are used. For comparative evaluation, the results of the 14 enhanced image produced by HSA are compared with two classical image enhancement methods (i.e., Histogram Equalization algorithm and Image Adjacent algorithm) and two advanced methods (i.e., genetic algorithm and particle swarm optimization). It is note worthy that all these methods employed the same criteria (number of edges in an gray scaled images, summation intensity of edges detected using a Sobel filter and entropy measure) in order to evaluate their results. The HSA almost achieves the best results in comparison with the other classical and advanced image enhancement algorithms. Due to such achievements, we believe that the proposed method is very promising and has a potential to provide a substantial addition to the image enhancement domain.
- Copyright
- © 2016. the authors. Co-published by Atlantis Press and Taylor & Francis
- Open Access
- This is an open access article under the CC BY-NC license (http://creativecommons.org/licences/by-nc/4.0/).
1. Introduction
Image enhancement is a special procedure of processing images to produce output image that is more suitable for special applications such as contrast image enhancement, edge enhancement, removing noise, brightening an image and saturation transformations 16. The main purpose of image enhancement is to improve the quality of the images to be more visible for viewers or to extract their important features to provide better input for other appli-cations. Image enhancement methods are problem-dependent. For example, a method that is quite useful for enhancing X-ray images may not be the best approach for enhancing satellite images taken by the infra-red band of the electromagnetic spectrum 16.
According to 16, image enhancement techniques can be classified into two major categories: Spatial and Frequency domain methods. Spatial domain methods, which is the concern of this paper, directly consider the image pixels as follows:
Where f(x,y) is the input image, g(x,y) is the output image obtained by enhancing f(x,y) with the aid of an operator T, defined over a predefined neighborhood of (x,y).
In the recent time, Celik and Tjahjadi 11 introduced an adaptive image enhancement algorithm based on a Gaussian Mixture Model(GMM) to enhance the contrast level of a given image. By using standard deviation as a control measure, the authors compress or disperse the data entities. According to the authors, this mechanism has the ability to retain the grey-level distribution, thereby enhancing the contrast levels entailed in the image domain. Their method yields comparable results in comparison with other state-of-the-art image enhancement algorithms.
Arici et al.6 proposed a content-adaptive contrast enhancement algorithm to enhance images. The authors have capitalized on the idea that the normalized histogram of an image gives the approximate probability density function of its pixel intensities. By manipulating it, the model can infer the probability that a pixel can hold a specific grey value in a given image. Further, the objective of enhancing the images has been achieved by formulating the criteria as an optimization problem. One of the primary goals of the solution is to minimize the residual between the modified histogram, which is closer to an uniformly distributed histogram, and the input histogram. In brief, the study deals with the fine tuning of several parameters that affect the histogram equalization process.
Saitoh 26 presented a method for the contrast enhancement of the gray image using the genetic algorithm. For evaluation, the intensity of spatial edges is included in the image. He represented a chromosome as an arrayed-bits that forms the curve of the relation between input gray levels and output gray levels. To evaluate an individual fitness, he used the sum of intensities of edges in an enhanced image where the intensity of the edges is calculated using Prewitt operator. The author used two-point crossover and reversing bits for mutation. The proposed method was tested using images of size 256 × 240 pixels, the number of gray levels is 256, the number of individuals in the population G=100. The crossover rate of individuals to the next generation S=50% and the mutation rate M=0.l%. Finally, this method showed that the produced images have good and natural contrasts compared with those images produced by the conventional methods during the subject and an object evaluation.
Munteanu and Rosa 24 introduced a new automatic technique for solving image enhancement based on real-coded Genetic Algorithms. The authors used genetic algorithm for adapting chromo-some parameters; they used four parameters (A, B, C and K) for representing the chromosome. The selection method is a combination between binary tournament and K-elitist. They used the arithmetic crossover method and the PCA-mutation operator. For experimental evaluation, they used 8 tested images for comparing their proposed work with other automatic enhancement techniques, such as contrast stretching and histogram equalization methods. The authors claimed that the results obtained showed a notable superiority of their proposed method over other works based on the subjective and objective evaluation. Another work which is based on GA is carried out by Hashemi et al 19 where an efficient method for solving the image enhancement problem is proposed. A simple chromosome structure with some corresponding operators was used. The representation of chromosome is a vector of size n to sort integer numbers, where n represents the numbers of gray levels in the original image. Roulette-wheel selection method is used to control the selection of individuals based on their fitness values. The number of edges is detected using Sobel operator. The authors implemented their proposed method us-ing standard images like plane, crowd, and lena, and found that it had a better results than than comparative methods. The best data value for enhancing image appeared with gray level.
The presentation of Real-coded Particle Swarm Optimization is proposed to solve image enhancement problem 10 where local enhancement technique is adapted by the authors. They defined four parameters (a, b, c, and k) represented by positive numbers which are the same for the whole image. The four parameters represents the particle and are tuned by PSO method to obtain optimal objective value. The objective of their work is to increase the relative number of pixels in the image edges and improve the overall intensity of such edges. The authors compared the proposed method with genetic algorithm where four images: Cameraman, Tyre, Pout and House with different sizes are utilized during the evaluation process. Finally, they argued that the fitness values obtained and the number of edges produced by PSO are better than those produced by GA and original image. Note that the running time in PSO is 130.5 seconds while in GA it is 182.4 seconds. Gorai and Ghosh 17 presented another PSO method for image enhancement where the local and global information that is necessary for transforming the image is utilized. In order to evaluate the produced image, three factors are employed by the authors are entropy value, sum of edge intensities and number of edges in the image. The number of edges was detected using Sobel operator. They decided to use four parameters to represent a particle (a, b, c and k) similar to the one in 10 and the range of these parameters are determined (a ∈ [0, 1.5], b ∈ [0, 0.5], c ∈ [0, 1] and k ∈ [0.5, 1.5]). The purpose of these parameters is to find the best set values to give the highest fitness. The authors compared their results with three existing image enhancement methods (linear contrast stretching, histogram equalization and genetic algorithm) using four gray-scale images Lady and Couple of size (256 × 256), Hut of size (250 × 150), and Duck of size (576 × 768). Finally, their proposed algorithm shown better results when compared with other existing techniques.
The introduction of fuzzy logic based on bio-inspired approach is proposed by Verma et al. 27 with sole aim of enhancing highly dynamic color images by preserving the chromatic information entailed in them. The authors applied the bio-inspired artificial ant colony system to optimize an intuitive objective function formulated by making use of Shannon entropy as well as visual appeal indicators. Furthermore, fuzzy logic is used to tackle the uncertainty of whether a pixel should be made darker or brighter than its original intensity level for the sake of enhancement. Importantly, as the naked human eye cannot quantitatively judge the level of contrast in an image and such visual assessment is subjective, the authors have resorted to fuzzy logic which is capable of associating a degree of belief to subtle image properties. They compared their approach with other previous work based on a bacterial foraging process and shown better results. Jevtic et al. 20 applied Ant Colony Optimization (ACO) for edge detection in grayscale images. The proposed method depends on extracting a set of images from the original gray image by using Multiscale Adaptive Gain for image contrast enhancement. The task of ACO here is to detect the number of edges from these extracted images. The authors used standard images such as Lina, Cameraman, House and Peppers of size (256 × 256). Finally, the produced results shown the effectiveness of the proposed method.
Harmony search algorithm (HSA) is a recent evolutionary algorithm (EA) proposed by Geem et al. 15 to imitate the musical improvisation process. Due to its advantages over other optimization methods, it stipulates fewer mathematical requirements in the initial search 22; it has a novel stochastic derivative which reduces the number of iterations required to converge towards local minima 13, in addition to being simple, adaptable, general, and scalable 2. Therefore, HSA has been intensively tailored for several optimization problems such as timetabling 5,3, nurse restoring 7,8, space allocation 9, and many others 18,30,14,12. However, due to the complex nature of some optimization problems and the avoidance of premature convergence situation, HSA theories are modified and hybridized 7,25,22. Furthermore, the control parameter adaptation for HSA is also studied 23,29,2,4.
In this paper, the harmony search algorithm is adapted to tackle the problem of enhancing the gray level image (edge preserving), increasing the number of image’s edges and improving the entropy measure. The operators of harmony search have been tweaked to embed the problem knowledge of the image enhancement. For evaluation purposes, the proposed algorithm is tested using 14 standard gray images with different sizes. The results show the superiority of the proposed method in comparison with some standard and advanced methods using same data-bed. As it is noted, the HSA provides the best results in terms of the number of edges for almost all standard images.
This paper is organized as follows: Sec. 2 provides a description of the harmony search fundamentals. The detailed description os the proposed methods is provided in Sec. 3. The experiments and results are illustrated in Sec. 4. Finally, the paper concludes with some hints for future research as provided in Sec. 5.
2. Fundamentals to the Harmony search algorithm
The recent EA that emulates the musical improvisation theory is the HSA created by Geem et al.15. The musical improvisation process consists of a set of musicians each playing their own instrument. The process is launched aiming for a pleasing harmony resulting from musicians’ practices. Each pitch is tuned at each practice in line with the following rules: i) considering one pitch stored in memory; ii) adjusting a pitch in the memory; iii) randomly picking a pitch from its available instrument range. At each practice, each musician tunes his/her instrument one pitch at a time while the pitches of all instruments played ensemble represent a complete harmony. That new harmony is measured using an audio-aesthetical standard and replaces the worst pitches stored in the musician’s memory. This improvisation process is practically repeated until a nice harmony is accomplished.
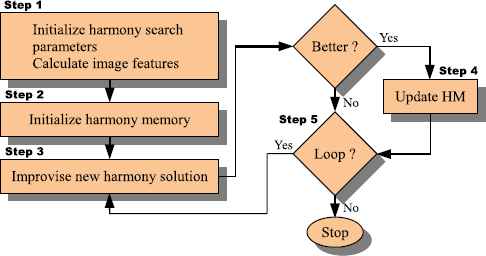
Five procedural steps of HSA have been described as follows:
2.1. Step 1: Initialize the HSA and problem parameters.
Normally, the parameters of the HSA needed for any optimization problem are determined in this step: the Harmony Memory Consideration Rate (HMCR) which determines the rate of selecting the value from the memory; the Harmony Memory Size (HMS) is similar to the population size in EA, Pitch Adjustment Rate (PAR) determines the probability of local improvement; the fret width (FW), determines the distance of adjustment, and Number of Improvisations (NI) or number of iterations. The problem is formulated as an objective function and the possible decision variables ranges are specified. Normally the parameters of any optimization problem will be directly extracted from the test-bed and the extracted parameters is organized into a proper data structure.
2.2. Step 2: Initialize the harmony memory.
The harmony memory (HM) is a matrix which includes the population of the solution vectors: HM = [x1,x2,...,xHMS]T, of size HMS. In this step, these vectors are often randomly generated as follows:
2.3. Step 3: Improvise a new harmony.
In this step, a new harmony vector, x′ = (x′1, x′2,···, x′N), is created (or improvised) based on three operators: (1) memory consideration, (2) pitch adjustment, and (3) random consideration.
2.3.1. Memory consideration.
In memory consideration, the value of the first decision variable x′1 is randomly selected from its historical values,
2.3.2. Pitch adjustment.
Each decision variable x′i assigned a value by memory considerations is pitch adjusted with a probability of PAR where PAR ∈ [0, 1] as follows:
If “Yes” is the decision for x′i, the value of x′i is modified as follows: x′i = x′i+U(−1, 1)×FW
2.3.3. Random consideration.
Some decision variables that is not met the condition of HMCR probability, and are not assigned values using the memory consideration. Thus the values are selected from the possible range using random consideration with a probability of (1-HMCR). For a summary of HSA operators, see Eq. (2).
2.4. Step 4: Update the harmony memory.
If the new harmony vector, x′=(x′1, x′2,···, x′N), is better than the worst harmony, xworst, stored in HM, the new harmony vector is contained by HM, and the worst harmony vector is excluded from it.
2.5. Step 5: Check the stop criterion.
As specified by the NI parameter, Step 3 and Step 4 of HSA are repeated until the stop criterion (maximum number of improvisations) is met.
3. Harmony Search Algorithm for Gray Level Image Enhancement
In order to tailor the HSA for gray level image, it is necessary to embed the problem knowledge in the form of objective function in the process of HSA. In spatial domain of image enhancement, the HSA uses the pixels transformation method as follows:
The transformation function T used in Eq. (3) is designed to deals with both global and local information to produce the enhanced image. Local information is obtained from defined window of size n × n. The transformation function T can be then expanded as shown in Eq. (4) which similar to what was used in 24,10,17.
The form of the enhancement function K(i,j)
And the standard deviation can be defined as in Eq. (8)
Therefore, the formula of the enhancement process is given in Eq. (9):
By this transformation given in Eq. (9), the contrast of the image is stretched considering local mean as the center. Four parameters,(a, b, c, and k) to produce large variations in the processed image are introduced in the transformation function.
To evaluate the quality of an enhanced image, an efficient objective function is used, where three performance measurements utilized are: i) the entropy value, ii) sum of edge intensities and the iii) number of edge pixels (edges). This objective function is employed for the same purpose in 24,10,17. It is observed that compared to the original image good contrast, the enhanced image has more numbers of edges pixels 16 likewise it should have a higher intensity of the edges 26. It is worthy of mentioning that studies have shown that both features are not sufficient to test any enhanced image and that is why one additional measurement called the entropy value of the image is considered. The function of entropy value is to reveals the information content in the image. If the distribution of the intensities is uniform then the histogram is equalized and thus the entropy of the image is higher. Therefore, the objective function is given in Eq. (10).
In Eq. (10), Ie denotes the enhanced image of Is (i.e., the original image) produced by the transformation function defined in Eq. (9). As in Eq. (10) above, the edges or edgels can be detected by many efficient edge detector algorithms such as Sobel 16, E(Is) is the sum of M × N pixel intensities of Sobel edge image Is n_edges is the number of pixels, whose intensity value is above a threshold in the Sobel edge image. Based on the histogram, entropy value is calculated on the enhanced image Ie as in Eq. (11) and (14) defined below.
The main mission of the HSA is to find the optimal combination of the four parameters (a, b, c and k) according to the objective function criterion given in Eq. (10). These parameters a, b, c, and k are represented as vectors. Each vector represents a candidate solution to solve the optimal enhancement problem. The flowchart drawn in Fig. 2 shows HSA steps for solving image enhancement problem.
The Harmony Search Algorithm Steps
Comparison of HSA with Histeq and Imadust
Step 1 : Initialize the problem and HSA parameters
In this step, we need to initialize HSA parameters and evaluate image features. The image features which must be calculated from the original image are local and global mean, standard deviation. At the same time, there are other important features that should be defined such as the number of edges and the summation of the intensity value. The number of edges is detected using Sobel operator 16.
In this study, the Sobel operator is used to compute the sum of intensity value for the entire image using Sobel filter as formulated in Eq. (11), (12), and (13).
The last feature in this step is to find the entropy measure based on Eq. (14).
Step 2 : Initialize Harmony Memory In this step, the harmony memory (HM) is initialized based on the range of parameters and harmony memory size (HMS). As discussed previously, four parameters (a, b, c and k) are employed to represent the solution in HSA process. The range of these parameters is selected from a ∈ [0, 1.5], b ∈ [0, 0.5], c ∈ [0, 1] and k ∈ [0.5, 1.5], which is similar to what was done in 24,17. The representation of HM of image enhancement solutions is shown in Eq. 15 and where the solutions are stored in ascending order in accordance with their objective function value.
The other steps (step 3, Step 4, and step 5) of HSA have been used as described in Sec. 2.
4. Experimental Results and Comparative Evaluation
This section focuses on the experimental analysis of the convergence behavior of the proposed work and comparative evaluation with other image enhancement approaches from the literature. Firstly, the comparison between the proposed HSA with other standard image enhancement algorithms (i.e., Histogram Equalization algorithm proposed by Kim 21 and Image Adjacent algorithm by Gonzalez and Woods 16 is carried out. This is followed by the comparison of the proposed HSA with other evolutionary algorithms (i.e., genetic algorithm 10 and particle swarm optimization 17). In addition, the proposed HSA is coded in MATLAB 2008b on Windows 7 platform, on Intel 2.2GHz Core 2 Duo processor with 4 GB of RAM. The parameters settings of the proposed algorithms are shown in Table 1, which were carefully chosen based on our preliminary experiments. Furthermore, the choice is inline with an optimal range of parameter settings values of the harmony search algorithm suggested by Omran and Mahdavi 25.
| Parameter Name | value |
|---|---|
| Number of iterations (NI) | 200 |
| Number of variables (NVAR) | 4(a, b, c, k) |
| Harmony Memory Size (HMS) | 100 |
| Harmony Memory Consideration Rate HMCR |
0.9 |
| Pitch Adjustment Rate (PAR) | 0.6 |
The harmony search algorithm parameter settings
4.1. HSA algorithm Compared with classical image enhancement approaches
This section presents the performance comparison of the proposed HSA with the standard image enhancement approaches. It is worth mentioning that the standard images with a gray scale level are employed to evaluate the performance of the proposed algorithm against the other methods 16. The detailed descriptions of two standard image enhancement algorithms is provided in the next subsections.
4.1.1. Background to Histogram Equalization algorithm
The histogram equalization algorithm is one of the most popular methods that have been adopted for contrast enhancement in different image applications. Its adoption stems from its simplicity and effectiveness in which the global contrast of an image is enhanced. Furthermore, the histogram equalization is useful when the backgrounds and foregrounds of images are either bright or dark as in the case of bone structure in medical images 21. However, the histogram equalization method may be considered as one of the indiscriminate methods that increase the contrast of background noise (increase the brightness) consequently. Thus, some details in the image might be lost 1. It can be clearly seen that the idea of the histogram equalization method is based on the calculation of the image’s histogram. More-over, the histogram is redistributed by using the cumulative distribution function.
4.1.2. Background to Image Adjacent algorithm
Image adjacent algorithm (Imadjust), also known as contrast stretching is a simple image enhancement method that tries to improve the contrast in an image by stretching the range of intensity values. This algorithm is required to determine the upper and lower pixel values of the image which need to be enhanced (normalized). Note that normalization depends on the type of the targeted image. For example, in gray level image (8 bits), the minimum and maximum pixel values are between 0 and 255, so each pixel value of the output image is normalized between 0 to 255 using Eq. (16) as given by 1.
Here, the following sets of criteria are employed in order to compare the results obtained by the proposed HSA with Histogram Equalization and Image Adjacent algorithms. These include the number of edges, entropy measure and fitness value which shall be analyzed in the following subsections.
4.1.3. Results compared based on the number of edges
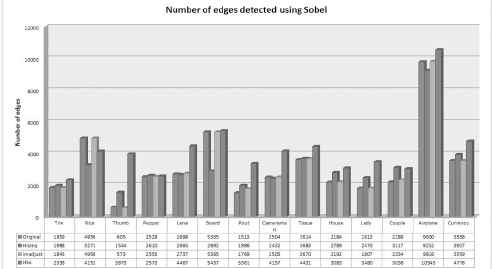
Determining the number of edges in gray scale images requires the use of edge detection filters that include Sobel or Laplacian filter 16. Thus as aforementioned, Sobel filter is employed to detect the number of edges where 14 standard gray images of different sizes are utilized. Figure 2 provides the results of HSA in comparison with Histeq and Imadust.
As shown in the Figure 2, it can be seen that the performance of the proposed HSA is better in terms of the number of edges for almost all the 14 gray images than other classical image enhancement algorithms. However, it cannot be excelled in the Rice image produced by Im-adust. This is due to presence of large background space in the image than the rice grains. In general, the performance proposed HSA is better in preserving the edges than the conventional oriented image enhancement algorithms. Figures 3 to 8 show the results of the proposed HSA implementation on standard images. Note that in these figures, the comparison between the original image, HSA image, Histeq image and Imadsut image is based on the number of edges using a Sobel filter. In addition, the histograms of each method which is in the form of a graphical representation of the intensity gray-level distribution in an image are also presented.
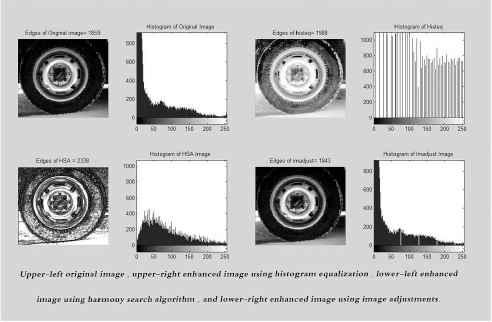
the comparison of HSA, Histeq and Imadjust on tire image using number of edges criteria
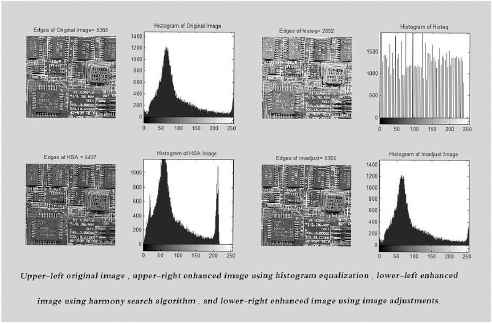
the comparison of HSA, Histeq and Imadjust on circuit image using number of edges criteria
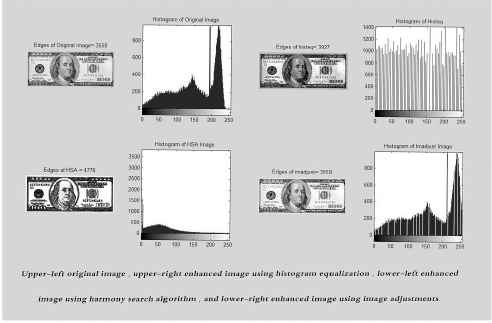
the comparison of HSA, Histeq and Imadjust on Currency image using number of edges criteria
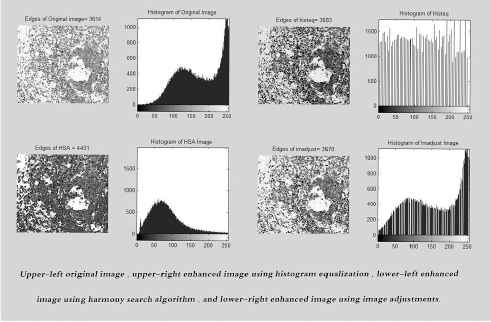
the comparison of HSA, Histeq and Imadjust on tissue image using number of edges criteria
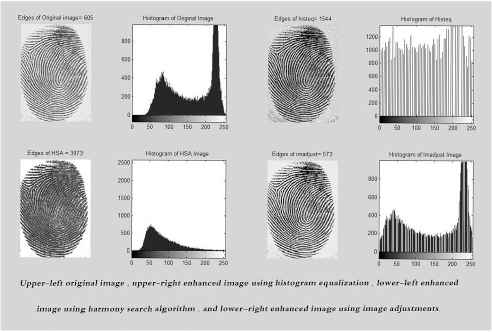
the comparison of HSA, Histeq and Imadjust on thumb image using number of edges criteria
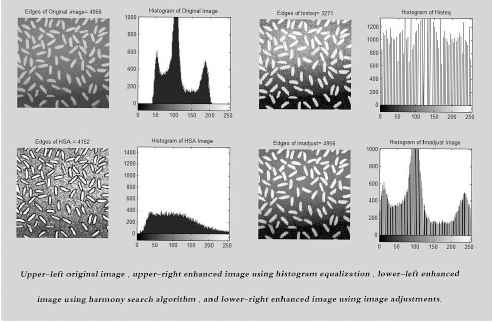
the comparison of HSA, Histeq and Imadjust on rice image using number of edges criteria
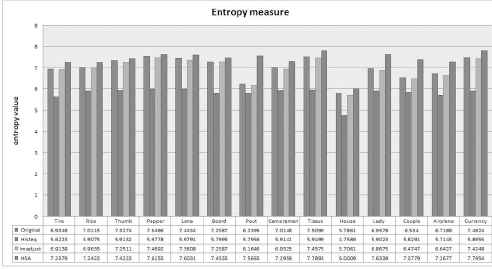
4.1.4. Results compared based on the entropy measure
The consideration of entropy measure as the second criterion for evaluating the performance of the proposed HSA. Entropy is a statistical measure of randomness that can be used to characterize the texture of the input image 16. The entropy measure of image can be calculated based on Eq. (17).
Where hi is the probability of occurrence of ith is the intensity value of Ie image 17. Figure 9 shows the results of comparing the proposed algorithm with others based on entropy measure.
Comparative analysis between HSA, Histeq and Imadust based on the entropy measure
It is worth mentioning that the proposed HSA provides the best results (highest is best) in all images in comparison with Histeq and Imadujst as shown in Figure 9. This is followed by the Imadujst that shows a better performance than Histeq algorithm.
4.1.5. Results compared based on fitness value
The fitness value calculation is the third criteria of evaluating the performance of the proposed HSA. The fitness value is calculated using equation (18) which is similar to what was used in 24,10,17.
Where Ie is the enhanced image of the original one Is which is produced by the transformation function. The n_edges represents the number of edges detected using Sobel filter, E(Is) is the sum of M × N pixel intensities of Sobel edge image. H is the entropy value and M × N is the size of original image.
In order to test the performance of the proposed HSA against other conventional algorithms, we used 200 iterations is enough to produce promising values. The optimal values generated showed that the performance of the proposed HSA can outperform the other classical image enhancement algorithms (i.e. Histeq and imadjust) as shown in Figure (10).
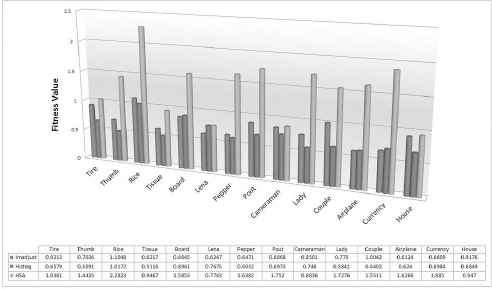
Comparative analysis between HSA, Histeq and imadust based on fitness score
It can be seen from Figure 10 that the proposed algorithm obtained the highest fitness value (i.e. fitness value = 2.2823) for the Rice image. This proves the effectiveness of the proposed algorithm in producing high quality solutions for the images with small objects and dark background.
4.2. HSA Compared with EA image enhancement approaches
In this section, the results obtained by the proposed HSA in terms of the number of edges 10 and Details Variance (DV) together with Background Variance (BV) are compared with GA and PSO 17. Note that the detailed comparison of the proposed HSA with GA and PSO approaches are given in the next subsections.
4.2.1. Comparison with GA and PSO in terms of the number of edges
The proposition of PSO for enhancing gray image based on the number of edges criteria is presented by 10. The authors compared the performance of the PSO with GA which depends on calculating the numbers of edges. Therefore, the highest number of edges in the image can be rated as having high detail contents. Thus, in this paper, we compare the performance of the proposed HSA with PSO and GA in order to determine a more suitable gray image enhancement approach. In this comparison, three standard images ie.e Cameraman with size of 256 × 256, Tyre with size of 291 × 240 and Pout with size of 232 × 205 are used. Note that edge detection is carried out with the aid of Sobel filter.
Figure 11 shows that the performance of the proposed HSA is better in terms of the number of edges detected using Sobel filter for all images than others.
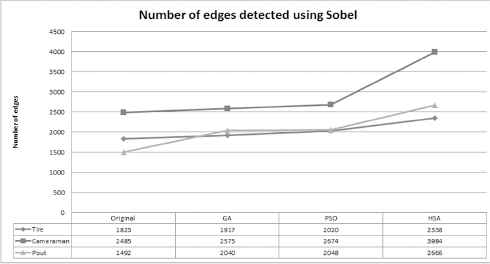
comparison between result and HSA
In addition, Figure 12, shows the results of the three images (i.e. Cameraman, Tyre and Pout) used in the evaluation. It can be easily seen that the proposed HSA provides the best results when compared with GA and PSO. This figure consists of four columns in which the first column represents the original image as taken from 16.The second and third columns have enhanced results produced by GA and PSO taken from 10. The last column is the enhanced image produced by the proposed HSA. Notably, in Cameraman and Tyre images the HSA provided a smooth image with efficient edge preservation, while in Pout image, the HSA obtained less details in some parts because the intensity levels of the majority of pixels are identical.
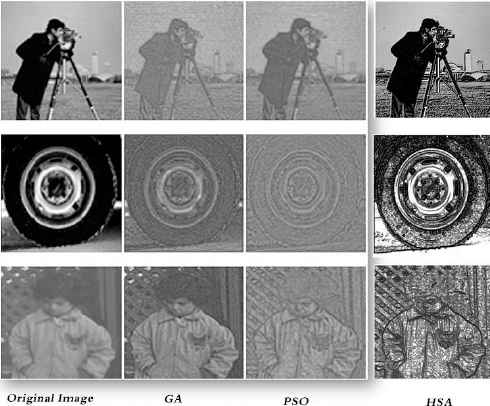
comparison between HSA, GA and PSO
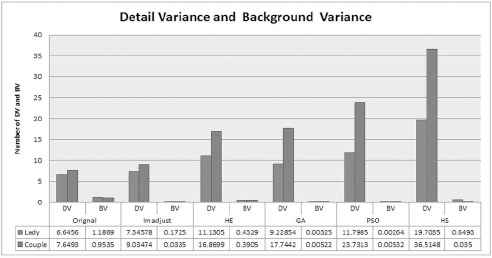
4.2.2. Comparison with GA and PSO based on the Details Variance and Background Variance
Studies have shown that DV and BV can also be used to determine the performance of the image enhancement algorithms 17. Note that in these techniques, the evaluation of the enhanced image is done by calculating the DV and BV of the output image and comparing them with the original image. Figure 13 provides the variance image derived from the original image, the DV and BV dealing with variance image. It is noteworthy that the DV and BV values are obtained as follows: firstly, the variance of the gray levels in the neighboring pixels is calculated at each pixel in the image. Then, the pixel is classified into the foreground when the variance of the gray levels is more than a certain threshold, and the pixel is classified to the background when the variance of the gray levels is lower than a certain threshold. In this paper, the threshold value of 1.5 is used. The average variance of all pixels included in the foreground class is DV, and the average variance of all pixels included in the background class is BV. When DV value of the output image increases and BV value is not changed compared with the original image, this means that efficient contrast enhancement has been achieved 17,24.
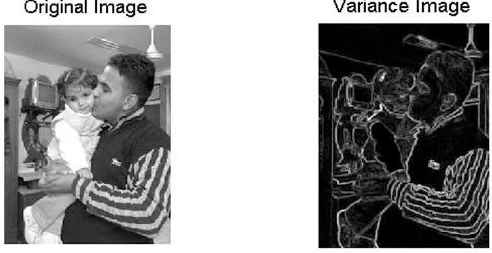
shows the original and variance image
comparison between HSA results and PSO
Figure 13 shows the comparison of the proposed HSA results with PSO and GA results. Two gray images (Lady and Couple) is used with size 256 × 256. The HSA achieved better results than GA and PSO, where it yields DV of Lady image equal to 19.7, but PSO achieved DV = 11.7 while GA achieved DV = 9.2. In the Couple image, the HSA achieved DV = 36.5, while DV = 23.7 and DV = 17.7 are achieved by PSO and GA respectively.
5. Conclusion and Future Work
In this paper, we presented a method for gray image enhancement called a harmony search algorithm (HSA). The main purpose of image enhancement is to improve the quality of the images to be more visible for viewers or to extract their important features to provide better input for other applications. The operators of harmony search have been tweaked to embed the problem knowledge of the image enhancement.
For evaluation purposes, the proposed algorithm is tested using 14 standard gray images with different sizes. The proposed HSA results were compared with other standard image enhancement algorithms (i.e., Histogram Equalization algorithm and Image Adjacent algorithm and then we compare the proposed HSA with other evolutionary algorithms (EA) (e.g., genetic algorithm and particle swarm optimization). The results show the superiority of the proposed method in comparison with classical and EA methods using same data-bed. It is noted that the proposed HSA works well in all tested gray images. However, this finding cannot be generalized in all types of gray images because according to the No Free Lunch Theorem of optimization 28, there is no superior algorithm that can work well in all types of problems of different category or even in different instances of the same category.
The idea presented in this paper can be expanded by considering some issues in the future: The harmony search algorithm can be tailored to enhance the color image. Furthermore, the comparison criteria shall be increased. Underwater image has many problems such as invisible some colors due to the reflection of light on the surface of the water. Therefor, we will try to adapt harmony search algorithm for enhancing the contrast of the underwater images.
References
Cite this article
TY  - JOUR
AU  - Mohammed Azmi Al-Betar
AU  - Zaid Abdi Alkareem Alyasseri
AU  - Ahamad Tajudin Khader
AU  - Asaju La’aro Bolaji
AU  - Mohammed A. Awadallah
PY  - 2016
DA  - 2016/09/01
TI  - Gray image enhancement using harmony search
JO  - International Journal of Computational Intelligence Systems
SP  - 932
EP  - 944
VL  - 9
IS  - 5
SN  - 1875-6883
UR  - https://doi.org/10.1080/18756891.2016.1237191
DO  - 10.1080/18756891.2016.1237191
ID  - Al-Betar2016
ER  -