
Crime Hotspot Detection and Monitoring Using Video Based Event Modeling and Mapping Techniques*
- DOI
- 10.2991/ijcis.2017.10.1.64How to use a DOI?
- Keywords
- Video Event Detection; Neuro-Fuzzy Inference; Crime Mapping; Hotspot Analysis
- Abstract
This paper presents a new approach to crime hotspot detection and monitoring. The approach consists of three phases’ namely: video analysis, crime prediction and crime mapping. In video analysis, crime indicator events are modelled using statistical distribution of semantic concepts. In crime prediction, a neuro-fuzzy method is used to model indicator events. In crime mapping, kernel density estimation is used to detect crime hotspots. This approach is tested in a simulated platform using violent scene detection (VSD) 2014 dataset.
- Copyright
- © 2017, the Authors. Published by Atlantis Press.
- Open Access
- This is an open access article under the CC BY-NC license (http://creativecommons.org/licences/by-nc/4.0/).
1. Introduction
Crime is not often distributed randomly or evenly in spatial space. Previous studies have shown that crime tends to cluster geographically and areas with high clustering are often termed crime hotspots.1, 2 However there is no widely accepted definition of crime hotspots, as researchers and law enforcement officers sometimes use the term differently. For the sake of this study we shall be adopting the definition of the International Association of Crime Analysts which defines crime hotspot as a group of similar crimes committed by one or more individuals at locations within close proximity to one another.3 Identifying crime hotspots and analyzing crime patterns is sometimes exploited by law enforcement agencies for predictive policing. This often helps in providing the necessary insights to responding or investigating crimes, prioritizing policing resources and evaluating policing tactics.
Owing to the importance of hotspots in strategic and tactical law enforcement, crime hotspots detection and analysis has received a lot of research attention and there exist several approaches in literature. Traditional methods often depend on crime incident data and mapping techniques. Some notable mapping techniques include: point mapping, spatial ellipse, thematic mapping and kernel density estimation (KDE).1,2 These methods often allow the visualization of areas with historical high crime concentration with the predisposition that future crimes often occur in the vicinity of past crimes. More recently researchers have explored the prospects of incorporating other crime related variables like social media information, demographic, socio-economic and spatial factors to improve the traditional methods.4 These recent methods have shown some significant improvements, however there are still some challenges in the sense that these methods do not meet real time demands.
Besides that, the issue of crime hotspot analysis and crime prediction is still an open research problem given the global surge in terrorism, gang violence and mass shootings. In light of the above we intend to exploit recent advancements in video based event detection, neuro-fuzzy inference, kernel density estimation (KDE) and spatial statistical techniques to detect and monitor crime hotspot dynamics. It is our conviction that using crime indicator events from real time video is a more realistic way of identifying and monitoring crimes hotspots for effective crime prevention. Moreover, our adoption of a neuro-fuzzy inference approach is informed by the fact that crime hotspot detection is a computational decision problem and there is currently no exact solution in polynomial time. Hence a hybrid neuro-fuzzy approach allows an approximated solution. Finally we adopted KDE in this specific context because it is by far the best methods of visualizing data patterns as a smooth continuous surface. 4, 6, 7 KDE is easy to interpret and it gives a better visual impression.
To implement our proposed approach we performed a series of experiments using violent scene detection (VSD) 2014 dataset deployed in a simulated study area. The main contribution of this study include: (1) Modifying and implementing the video based concept recognition method proposed by Ref. 5 (2) Evaluating and comparing existing video based events recognition methods (3) Modeling a Neuro-Fuzzy System for crime prediction using extracted video events and other crime factors (4) Using video based crime indicator events for wide area hotspot analysis (5) Integrating video event recognition, neuro-fuzzy inference and mapping techniques in a single framework for crime hotspot detection and monitoring. The rest of the paper is organized as follows. Section II discusses the related work. Section III presents the proposed framework. Section IV contains the description of the datasets, experiments and discussion of results. Section V concludes the paper with summary of our contributions and future direction.
2. Related Work
Hotspot mapping is one of the effective ways of visualizing the distribution of crime across space and time and kernel density estimation is often seen as the most suitable methods of depicting hotspots. Traditional KDE methods depend on historical crime incident data but recent improvements including Ref. 4 and 6 have successfully integrated twitter information into a KDE framework to achieve better performance. Ref 7 presented a different approach to hotspot mapping. In their framework they made use of spatial data mining concepts to map hotspots and investigate the relationship between socio-economic and criminal variables.
3. Proposed Solution
The proposed framework basically has three phases. The first phase is video analysis and in this phase we adopted a Concept-Based Event Recognition (CBER) approach to video event classification similar to Ref. 5. We modeled events in a semantic space consisting of concepts related to actions, scenes and objects. We classified new events by matching event representations in semantic space to reference event models. However, unlike Ref. 5 we used Spatio-Temporal Interest Points Chain (STIPC) for detection of action concepts and chi-square ( χ2 ) radial basis function (RBF) kernel for SVM learning. In the second phase which is crime prediction, we developed a neuro–fuzzy inference system for computing crime imminence levels across our simulated study area. We generated initial fuzzy rules using subtractive clustering and tuned the membership function parameters through adaptive learning, using a combination of backward propagation and least squares estimation. The third phase is crime mapping and in this phase we used kernel density estimation (KDE) to fit spatial probability density function to crime imminence values across the study area. We then performed spatial statistical analysis to monitor and understand the crime imminence patterns over time. Figure 1 is the schematic diagram of our proposed framework.
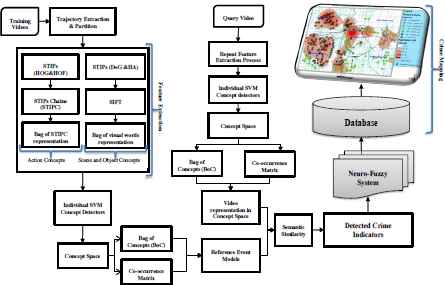
Schematic diagram of the proposed framework
3.1. Concept Based Event Recognition
Our concept based event recognition principally consists of two consecutive steps: concept detection and event recognition.
3.1.1. Concept Detection
In this study we considered action, scene and object concepts in building our semantic concept space. For action concepts we adopted the Spatio-Temporal Interest Points Chain (STIPC) model proposed by Ref 8. This chain model extract local space-time features (HOG and HOF features) around discontinuous motion points from sequences of images and then encodes the temporal relationships between interdependent local space-time features. To model action concepts we generated a codebook of chain features from training sequences using k-mean clustering and bag of features representation. Concept classification is performed using binary SVM classifiers with χ2 RBF Kernel. This approach has been proven to be more discriminative and computational efficient compared to previous state-of-the-art trajectory based methods as demonstrated by Ref 8.
For scene and object concepts we used the bag-of-visual words (BoW) implementation in Ref 9. The approach use Difference of Gaussian (DoG) and Hessian Affine detectors for extracting local key-points and SIFT descriptors for describing key-points. Average fusion is then used to combine the classification outputs generated by the different key-points detectors. To model our scene and object concepts, we built supervised SVM classifiers from labeled images in a BoW framework using soft-weighting and χ2 RBF Kernel. We refer interested readers to the original work by Ref. 9 for details about soft-weighting. For our binary SVM classifiers, the decision function for a test sample x is expressed as follows:
3.1.2. Event Recognition
After detecting the semantic concepts the next step is event recognition. In event recognition we first of all have to build reference event models using training videos. Assuming we have n events in our training videos, we can annotate the videos based on K defined concepts and train K concept detectors, thus creating kdimensional concept space CK .Using the concept space we can model each of the n events by creating a k-dimensional vector with bins containing binary values indicating the presence or absence of a particular concept in that event. To build the events models we used a combination of bag of concepts (BoC) and co-occurrence of concepts (CoC) methods.5 Having obtained the event models in semantic concept space we can tell if a query video belongs to an event by computing their semantic similarity in the concept space. For instance if we take
3.2. Crime Mapping
To visualize crime hotspots and monitor hotspots dynamics across our study area we used KDE and then statistically analyzed the hotspot patterns over time. To do this we created a simulated study area of 130 km2 as shown in figure 2. The area is divided into 5 zones with terrain features (roads). To deploy a surveillance camera network on the study area we used a grid framework with a block of size 1000m2. We subdivided each grid block into 4(n×n) mini-blocks. A camera is assigned to each mini-block representing our real time video source and we created a local processing point (LPP) at the center of each grid block of interest. We selected our grid block of interest with the aim of mimicking real world scenario by assuming the presence of natural obstacles in certain areas. The cameras of each grid block transmit video (surveillance footage) to their respective LPP’s (in real time) in a star topology fashion. Video analysis and crime predictions are performed at the LPP level and output of the LPP server is finally transmitted to a central processing station (CPS) where crime mapping and statistical analysis are performed.
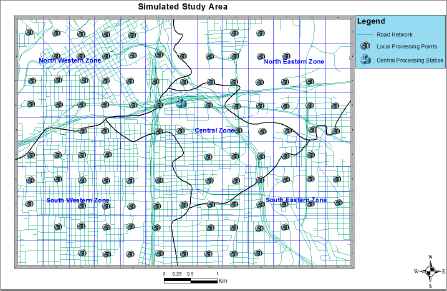
Study area with grid plan, camera network processing points, road network and zonal demarcations.
4. Experiments and Evaluations
4.1. Data Collection
For our experiments we used the violent scene detection (VSD) 2014 dataset. The VSD2014 datasets features diverse outdoor scenes and events that bear close alignment to real-world scenarios.10 The dataset is collected from various sources including user-generated videos shared on the web and popular Hollywood movies ranging from very violent ones to nonviolent ones. To begin, we sampled 200 short clips from the VSD datasets based on our concept definitions and used it as our training set. The clips are of different lengths ranging from 3 seconds to 5 minutes and they are sampled at a framerate of 20 Hz with a pixel resolution of 640*480. The clips are annotated and used for training and validation. For action concepts we annotated video segments and for object and scene concepts we annotated key-frames. We modeled 5 events using a concept space of 103 concepts which includes 72 action concepts (such as: punch, slap, kick, fall, run), 13 scene concepts (such as: crowd, street, park, residential, garden) and 18 object concepts (such as: gun, knife, fire, face mask, car).Each event has at least 100 segments in the entire sampled training videos.
4.2. Video Analysis Experiments
Given our concept space, there are many ways in which we could model and classify events using the occurrence of concepts. In our experiments we specifically used bag of concepts (BoC) and co-occurrence of concepts (CoC) representations methods. BoC measures the frequency of occurrence of each concept over the whole video clip, while CoC uses pairwise probability of concepts co-occurring in a clip. We created 103-dimensional model vector for each event with bins holding binary values indicating the presence or absences of each concept. Each event class is trained with binary SVM using χ2 RBF kernel.
To evaluate the performance of our concept based event recognition method using different feature representations, we deployed 10-fold leave-one-out cross validation approach. We created the semantic concept space utilizing the annotated clips of 9 folds and used the rest of the clips for validation. Table 1 shows the average precision (AP) of each event.
| AT | PE | TV | PS | VA | |
|---|---|---|---|---|---|
| BoC | 69.51 | 65.87 | 65.69 | 55.21 | 63.55 |
| CoC | 67.32 | 64.56 | 67.78 | 56.82 | 63.14 |
| Combined | 71.30 | 68.22 | 73.10 | 73.04 | 69.43 |
AT: Arms Threat, PE: Property Encroachment, TV: Traffic Violation, PS: Physical Struggle VA: Verbal Assault
The Average Precision of event recognition using various feature representation method. Five different events were classified and from the average precision values it can be seen that no individual method clearly outperforms the others in all events. However a combination of the methods outperforms the individual methods in all the events. This shows that the two methods are complementary
For comparison of the performance of our method against other methods, we implemented Ref.11, 12 and 13 which are other state-of-the-art concept based event recognition methods. Using the same dataset, we evaluated event classification as a function of number of positive training examples. Figure 3 shows the mean average precision over all events using the various methods. It should be noted that in all cases the parameters were tuned to obtain the best performance results.
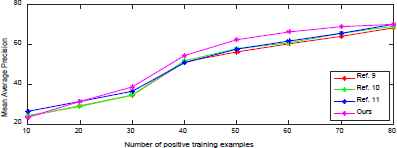
Mean AP over all events. The figure shows the performance of event recognition methods as the number of positive training examples increases. From the figure it can be observed that the mean average precision over all events increases as we increment the number of positive examples for all the methods. Our method performs slightly better than all the methods in terms of mean average precision.
4.3. Crime Modeling Experiments
For our crime predictive model we adopted a neuro-fuzzy inference approach which allowed us to make predictions about crime indicators events across our simulated study area. As the name suggests, neuro-fuzzy inference uses a combination of fuzzy logic and artificial neural networks (ANN). In this combination the learning capability of ANN is seen as an advantage from the viewpoint of FIS and the formation of linguistic rules becomes an advantage from the viewpoint of ANN.
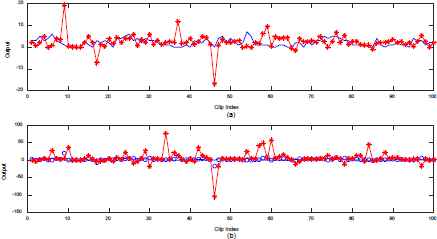
Before we begin, the fuzzy inputs and output are extracted from the annotated training videos and 50% is used for model training and the remaining 50% for model checking and validation. Figures 4 (a) and (b) are plots of the fuzzy inputs and output. Given the fuzzy inputs and output we created a FIS structure and extracted the initial fuzzy rules using subtractive clustering. Then a combination of gradient descent algorithm and least squares estimation are used to adaptively tune the parameters of the membership functions.

(a) Plot of fuzzy inputs (b) Plot of fuzzy output.
In subtractive clustering we used different clustering radii for different input variables (from 0.5 to 0.25).This allowed us to assigned priorities or weights to the various crime variables. After obtaining the initial FIS model, we computed the root mean square error (RMSE) and used it as a baseline for comparisons during the adaptive learning. In the first optimization experiments we used 20 training epochs with an error target of 0 and an initial step size of 0.1. To test the model for overfitting we trained the model again with 200 epochs and applied the checking data. Figure 5 (a) is the plot of the improved model output against the checking data. From the figure we can say that there is no overfitting since the model performs well with the checking data. Overfitting is said to occur when the checking error starts increasing instead of decreasing. Figure 6 (a) is the plot of the training error and figure 6(b) is the plot of the checking error. From figure 6(a) the lowest training error: 0.2345 occurs around the 30th epoch point after which the training error assumes a mostly steady track throughout the rest of the training. From figure 6 (b) the lowest checking error: 3.0894 occur at the 160th epoch, after which it remains steady even as the training continues till the 200th epoch point. This therefore confirms that, there is not overfitting since the checking error kept decreasing throughout the whole training period. Besides that, there is also great improvement in the checking error because it reduced from 134.5655 to 3.0894. Hence the plot indicates that the model has the ability to generalize over the checking data and for that matter it can be used to make predictions about different data.
(a) Testing for over-fitting (b) Comparison of Initial and final Trained Models
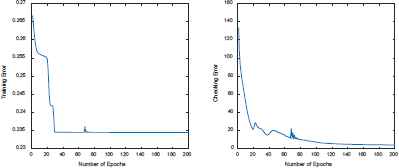
Error Plots for (a) Training (b) Checking
After subtractive clustering and adaptive learning, a crime imminence prediction fuzzy inference System (CIPFIS) is created as shown in figure 7. The CIPFIS is a Sugeno-type inference system with 7 inputs, 38 rules and 1 output. The system uses a gaussian membership function for all the inputs variables and a linear membership function for the output variable. Figure 9 is the plot of the input membership functions used to model the universe of discourse of crime indicator events.
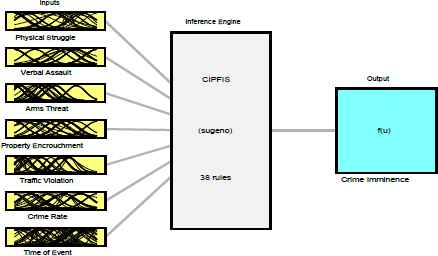
Crime Imminence Prediction Fuzzy Inference System (CIPFIS) Diagram. CIPFIS is a Sugeno-type inference system with 7 inputs, 33 rules and 1 output.
4.4. Model Implementation
The experiments in this section are performed to visualize crime imminence and to make statistical analysis about crime clusters and patterns across the study area. To do this we sampled 5 separate query datasets from the VSD2014 data and we named them VSD1, VSD2, VSD3, VSD4 and VSD5. Each query dataset contains 300 clips and each clip is assigned to a designated grid block. Each clip has 120 tracks which are geo-referenced to mini-grids within each designate grid block in a sequential manner. On the whole each mini-grid has a total of 90 tracks assigned to it. Taking each of the query dataset as our daily sample we performed five separate experiments representing five days.
In the experiments we first performed video analysis to obtain our crime indicators (fuzzy inputs) after which we used CIPFIS to compute the crime imminence for the grid blocks of interest across the study areas. It should be noted that a total of 100 grids blocks were designated as blocks of interest in our experiments. To obtain the “time of event” fuzzy input, we extracted the time stamp on the video frame at the spatio temporal interest point. For “crime rates” inputs we assigned predetermined values for each grid block based on its location. We then generated a KDE map using the crime imminence estimates obtained from CIPFIS after executing each of the daily samples. We adopted equal intervals for our classifications since our interest is both to identify hotspot clusters and to make comparison between different daily KDE maps. The results are shown in Figures 8, 9, and 10.
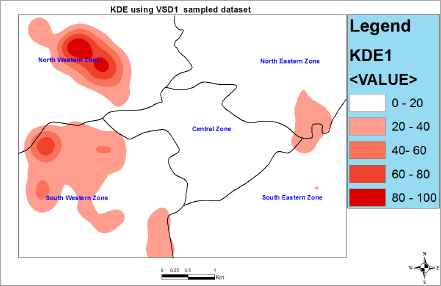
Density map of predicted crime locations per square kilometers using VSD1 sampled dataset. The figure represents the KDE map for day 1 in our experiments. We used a search radius of 1000m and made classifications (creating class groupings with similar values) using equal interval. The darkest red spots in the North Western and South Western zones are predicted regions of high crime imminence.
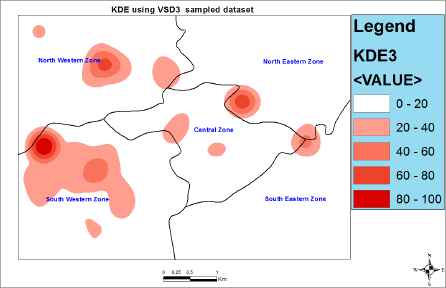
Density map of predicted crime locations per square kilometers using VSD3. This is the KDE map of the third day. We used a search radius of 1000m and equal interval was used for classification. The darkest spots represent predicted regions of high crime imminence
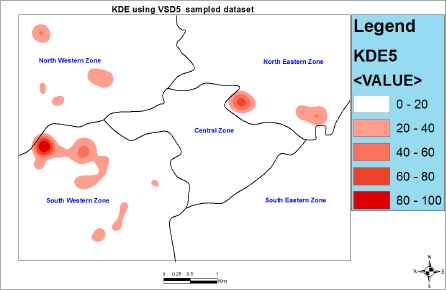
Density map of predicted crime locations per square kilometers using VSD5. This is the KDE map of the fifth day. We used a search radius of 1000m and equal interval for classification. The darkest spots represent predicted regions of high crime imminence for day 5.
From the KDE experiments in figures 8, 9, and 10 we can observe some consistency in the hotspots in the North Western and South Western zones of our study area. Hence we can project the presence of chronic hotspots in these two zones given that the current pattern can be maintained for a long period of time (say 1 month or more). The rest of the hotspots in the remaining zones seem not to follow any consistent pattern for now, hence we project the presence of acute hotspots given that no consistent pattern is established in these zones over time.
To explore emanating patterns and establish some statistical significance we applied Getis-Ord Gi* statistic.14 Figure 11 shows the results of the hotspot analysis using Getis-Ord Gi* statistics on the entire query sample. To perform this statistical test, we assumed complete spatial randomness (CSR) as our null hypothesis and we set our confidence interval at 95%. The Getis-Ord Gi* statistic returns z-scores and p-values for each of our input features. The p-value is the probability that the observed spatial pattern is as a result of some random process and the z-scores are simply standard deviations. Hence the returned values tell us whether or not to reject the null hypothesis. In essence the z-scores and p-values indicate whether the observed spatial clustering of high or low values is more pronounced than would be expected in a random distribution. Regarding the input parameters we used the fixed distance band for the conceptualization of spatial relationships and Euclidean distance for our distance calculations from feature to feature with a cut-off distance of 1000m.
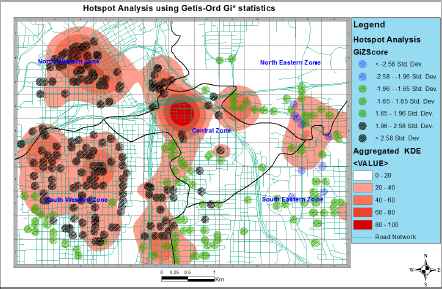
Hotspot Analysis using Getis-Ord Gi* statistics with the entire query sample
From the hotspot analysis results in figure 11 the features under the black circular patches have z-score values greater than 1.96 and p- values less 0.05. So at 95% confidence level, we can say there is enough statistical evidence to suggest that the areas marked by black circular patches are crime hotspots. Hence our null hypothesis of complete spatial randomness is rejected in this case. In a similar fashion, the blue circular patches have their z-scores less than -1.96 and p-values less than 0.05; as such we say the blue patches are statistical significant crime cold spots. The green patches however are as a result of random chance based on the hotspot analysis results. From figure 11 we can see that the Getis-Ord Gi* hotspot analysis actually places some spatial limits on the KDE hotspots.
4.5. Discussion
For our crime predictive analysis we used a neuro-fuzzy approach which actually allowed us to extract crime predictive rules from the sampled data. This kind of approach is well suited for real life applications because it allows localized and more informed prediction rules. It also takes away the burden of manually formulating prediction rules which often require human experts. Besides that, using a fuzzy approach allows the weighting or prioritization of crime factors. This is because crime factors do not necessarily have the same level of influence on the imminence of crime. So in our subtractive clustering experiments, different radii values were used to specify the range of influence of the various crime factors considered.
More importantly, the framework proposed in this study can be used to develop a real time field decision support system for police patrols. The system can be hosted in a secured network so that police on patrol duty can interactively access real time hotspot map and crime imminence statistics using tablet computers or smart phones. Such a system can be useful in directing police patrol to areas of tactical importance. It can also give police an insight of how to prepare or approach an area of importance. Besides that, such a system can also be used as an assessment tool for giving a visual impression of how policing actions are impacting the crime atmosphere in an area.
5. Conclusion
This paper presented a comprehensive approach to crime hotspot detection and monitoring. The approach makes use of video based concept modeling for crime indicator event detection, adaptive neuro-fuzzy inference system for crime prediction, kernel density estimation for hotspot visualization of hotspots and Getis-Ord Gi* for hotspot analysis. To test the practicality of the framework we performed a series of experiment using a simulated study area. We created a wide area surveillance network and hosted video clips sampled from VSD 2014 dataset. In the experiments five different sampled datasets were used and we successively monitored the hotspot patterns making projections about the likely nature of emanating hotspots.
Based on the experimental results, we can say the model has a generalizing capability and can be used to make reliable predictions since there is no overfitting. In our concluding remark, we say the framework is feasible and it can be used to develop wide area crime early warning systems. Going into the future, we look to implement the framework in a real world case study
Acknowledgement
This work is supported by the National Natural Science Foundation of China No.61573380.
Footnotes
South Lushan Road, Yuelu District, School of Information Science and Engineering, Central South University, Changsha, Hunan, China, 410083. This work is supported by the National Natural Science Foundation of China No.61573380.
References
Cite this article
TY  - JOUR
AU  - Zou Beiji
AU  - Nurudeen Mohammed
AU  - Zhu Chengzhang
AU  - Zhao Rongchang
PY  - 2017
DA  - 2017/06/09
TI  - Crime Hotspot Detection and Monitoring Using Video Based Event Modeling and Mapping Techniques*
JO  - International Journal of Computational Intelligence Systems
SP  - 962
EP  - 969
VL  - 10
IS  - 1
SN  - 1875-6883
UR  - https://doi.org/10.2991/ijcis.2017.10.1.64
DO  - 10.2991/ijcis.2017.10.1.64
ID  - Beiji2017
ER  -